

20 12. Survey design
Chapter outline.
- What is a survey, and when should you use one? (14 minute read)
- Collecting data using surveys (29 minute read)
- Writing effective questions and questionnaires (38 minute read)
- Bias and cultural considerations (22 minute read)
Content warning: examples in this chapter contain references to drug use, racism in politics, COVD-19, undocumented immigration, basic needs insecurity in higher education, school discipline, drunk driving, poverty, child sexual abuse, colonization and Global North/West hegemony, and ethnocentrism in science.
12.1 What is a survey, and when should you use one?
Learning objectives.
Learners will be able to…
- Distinguish between survey as a research design and questionnaires used to measure concepts
- Identify the strengths and weaknesses of surveys
- Evaluate whether survey design fits with their research question
Students in my research methods classes often feel that surveys are self-explanatory. This feeling is understandable. Surveys are part of our everyday lives. Every time you call customer service, purchase a meal, or participate in a program, someone is handing you a survey to complete. Survey results are often discussed in the news, and perhaps you’ve even carried our a survey yourself. What could be so hard? Ask people a few quick questions about your research question and you’re done, right?
Students quickly learn that there is more to constructing a good survey than meets the eye. Survey design takes a great deal of thoughtful planning and often many rounds of revision, but it is worth the effort. As we’ll learn in this section, there are many benefits to choosing survey research as your data collection method particularly for student projects. We’ll discuss what a survey is, its potential benefits and drawbacks, and what research projects are the best fit for survey design.
Is survey research right for your project?
To answer this question, the first thing we need to do is distinguish between a survey and a questionnaire. They might seem like they are the same thing, and in normal non-research contexts, they are used interchangeably. In this textbook, we define a survey as a research design in which a researcher poses a set of predetermined questions to an entire group, or sample , of individuals. That set of questions is the questionnaire , a research instrument consisting of a set of questions (items) intended to capture responses from participants in a standardized manner. Basically, researchers use questionnaires as part of survey research. Questionnaires are the tool. Surveys are one research design for using that tool.
Let’s contrast how survey research uses questionnaires with the other quantitative design we will discuss in this book— experimental design . Questionnaires in experiments are called pretests and posttests and they measure how participants change over time as a result of an intervention (e.g., a group therapy session) or a stimulus (e.g., watching a video of a political speech) introduced by the researcher. We will discuss experiments in greater detail in Chapter 13 , but if testing an intervention or measuring how people react to something you do sounds like what you want to do with your project, experiments might be the best fit for you.

Surveys, on the other hand, do not measure the impact of an intervention or stimulus introduced by the researcher. Instead, surveys look for patterns that already exist in the world based on how people self-report on a questionnaire. Self-report simply means that the participants in your research study are answering questions about themselves, regardless of whether they are presented on paper, electronically, or read aloud by the researcher. Questionnaires structure self-report data into a standardized format—with everyone receiving the exact same questions and answer choices in the same order [1] —which makes comparing data across participants much easier. Researchers using surveys try to influence their participants as little as possible because they want honest answers.
Questionnaires are completed by individual people, so the unit of observation is almost always individuals, rather than groups or organizations. Generally speaking, individuals provide the most informed data about their own lives and experiences, so surveys often also use individuals as the unit of analysis . Surveys are also helpful in analyzing dyads, families, groups, organizations, and communities, but regardless of the unit of analysis, the unit of observation for surveys is usually individuals. Keep this in mind as you think about sampling for your project.
In some cases, getting the most-informed person to complete your questionnaire may not be feasible . As we discussed in Chapter 2 and Chapter 6 , ethical duties to protect clients and vulnerable community members mean student research projects often study practitioners and other less-vulnerable populations rather than clients and community members. The ethical supervision needed via the IRB to complete projects that pose significant risks to participants takes time and effort, and as a result, student projects often rely on key informants like clinicians, teachers, and administrators who are less likely to be harmed by the survey. Key informants are people who are especially knowledgeable about your topic. If your study is about nursing, you should probably survey nurses. These considerations are more thoroughly addressed in Chapter 10 . Sometimes, participants complete surveys on behalf of people in your target population who are infeasible to survey for some reason. Some examples of key informants include a head of household completing a survey about family finances or an administrator completing a survey about staff morale on behalf of their employees. In this case, the survey respondent is a proxy , providing their best informed guess about the responses other people might have chosen if they were able to complete the survey independently. You are relying on an individual unit of observation (one person filling out a self-report questionnaire) and group or organization unit of analysis (the family or organization the researcher wants to make conclusions about). Proxies are commonly used when the target population is not capable of providing consent or appropriate answers, as in young children and people with disabilities.
Proxies are relying on their best judgment of another person’s experiences, and while that is valuable information, it may introduce bias and error into the research process. Student research projects, due to time and resource constraints, often include sampling people with second-hand knowledge, and this is simply one of many common limitations of their findings. Remember, every project has limitations. Social work researchers look for the most favorable choices in design and methodology, as there are no perfect projects. If you are planning to conduct a survey of people with second-hand knowledge of your topic, consider reworking your research question to be about something they have more direct knowledge about and can answer easily. One common missed opportunity I see is student researchers who want to understand client outcomes (unit of analysis) by surveying practitioners (unit of observation). If a practitioner has a caseload of 30 clients, it’s not really possible to answer a question like “how much progress have your clients made?” on a survey. Would they just average all 30 clients together? Instead, design a survey that asks them about their education, professional experience, and other things they know about first-hand. By making your unit of analysis and unit of observation the same, you can ensure the people completing your survey are able to provide informed answers.
Researchers may introduce measurement error if the person completing the questionnaire does not have adequate knowledge or has a biased opinion about the phenomenon of interest. For instance, many schools of social work market themselves based on the rankings of social work programs published by US News and World Report . Last updated in 2019, the methodology for these rankings is simply to send out a survey to deans, directors, and administrators at schools of social work. No graduation rates, teacher evaluations, licensure pass rates, accreditation data, or other considerations are a part of these rankings. It’s literally a popularity contest in which each school is asked to rank the others on a scale of 1-5, and ranked by highest average score. W hat if an informant is unfamiliar with a school or has a personal bias against a school? [2] This could significantly skew results. One might also question the validity of such a questionnaire in assessing something as important and economically impactful as the quality of social work education. We might envision how students might demand and create more authentic measures of school quality.
In summary, survey design best fits with research projects that have the following attributes:
- Researchers plan to collect their own raw data, rather than secondary analysis of existing data.
- Researchers have access to the most knowledgeable people (that you can feasibly and ethically sample) to complete the questionnaire.
- Research question is best answered with quantitative methods.
- Individuals are the unit of observation, and in many cases, the unit of analysis.
- Researchers will try to observe things objectively and try not to influence participants to respond differently.
- Research questions asks about indirect observables—things participants can self-report on a questionnaire.
- There are valid, reliable, and commonly used scales (or other self-report measures) for the variables in the research question.

Strengths of survey methods
Researchers employing survey research as a research design enjoy a number of benefits. First, surveys are an excellent way to gather lots of information from many people. In a study by Blackstone (2013) [3] on older people’s experiences in the workplace , researchers were able to mail a written questionnaire to around 500 people who lived throughout the state of Maine at a cost of just over $1,000. This cost included printing copies of a seven-page survey, printing a cover letter, addressing and stuffing envelopes, mailing the survey, and buying return postage for the survey. We realize that $1,000 is nothing to sneeze at, but just imagine what it might have cost to visit each of those people individually to interview them in person. You would have to dedicate a few weeks of your life at least, drive around the state, and pay for meals and lodging to interview each person individually. Researchers can double, triple, or even quadruple their costs pretty quickly by opting for an in-person method of data collection over a mailed survey. Thus, surveys are relatively cost-effective.
Related to the benefit of cost-effectiveness is a survey’s potential for generalizability. Because surveys allow researchers to collect data from very large samples for a relatively low cost, survey methods lend themselves to probability sampling techniques, which we discussed in Chapter 10 . When used with probability sampling approaches, survey research is the best method to use when one hopes to gain a representative picture of the attitudes and characteristics of a large group. Unfortunately, student projects are quite often not able to take advantage of the generalizability of surveys because they use availability sampling rather than the more costly and time-intensive random sampling approaches that are more likely to elicit a representative sample. While the conclusions drawn from availability samples have far less generalizability, surveys are still a great choice for student projects and they provide data that can be followed up on by well-funded researchers to generate generalizable research.
Survey research is particularly adept at investigating indirect observables . Indirect observables are things we have to ask someone to self-report because we cannot observe them directly, such as people’s preferences (e.g., political orientation), traits (e.g., self-esteem), attitudes (e.g., toward immigrants), beliefs (e.g., about a new law), behaviors (e.g., smoking or drinking), or factual information (e.g., income). Unlike qualitative studies in which these beliefs and attitudes would be detailed in unstructured conversations, surveys seek to systematize answers so researchers can make apples-to-apples comparisons across participants. Surveys are so flexible because you can ask about anything, and the variety of questions allows you to expand social science knowledge beyond what is naturally observable.
Survey research also tends to be a reliable method of inquiry. This is because surveys are standardized in that the same questions, phrased in exactly the same way, as they are posed to participants. Other methods, such as qualitative interviewing, which we’ll learn about in Chapter 18 , do not offer the same consistency that a quantitative survey offers. This is not to say that all surveys are always reliable. A poorly phrased question can cause respondents to interpret its meaning differently, which can reduce that question’s reliability. Assuming well-constructed questions and survey design, one strength of this methodology is its potential to produce reliable results.
The versatility of survey research is also an asset. Surveys are used by all kinds of people in all kinds of professions. They can measure anything that people can self-report. Surveys are also appropriate for exploratory, descriptive, and explanatory research questions (though exploratory projects may benefit more from qualitative methods). Moreover, they can be delivered in a number of flexible ways, including via email, mail, text, and phone. We will describe the many ways to implement a survey later on in this chapter.
In sum, the following are benefits of survey research:
- Cost-effectiveness
- Generalizability
- Reliability
- Versatility

Weaknesses of survey methods
As with all methods of data collection, survey research also comes with a few drawbacks. First, while one might argue that surveys are flexible in the sense that you can ask any kind of question about any topic we want, once the survey is given to the first participant, there is nothing you can do to change the survey without biasing your results. Because surveys want to minimize the amount of influence that a researcher has on the participants, everyone gets the same questionnaire. Let’s say you mail a questionnaire out to 1,000 people and then discover, as responses start coming in, that your phrasing on a particular question seems to be confusing a number of respondents. At this stage, it’s too late for a do-over or to change the question for the respondents who haven’t yet returned their questionnaires. When conducting qualitative interviews or focus groups, on the other hand, a researcher can provide respondents further explanation if they’re confused by a question and can tweak their questions as they learn more about how respondents seem to understand them. Survey researchers often ask colleagues, students, and others to pilot test their questionnaire and catch any errors prior to sending it to participants; however, once researchers distribute the survey to participants, there is little they can do to change anything.
Depth can also be a problem with surveys. Survey questions are standardized; thus, it can be difficult to ask anything other than very general questions that a broad range of people will understand. Because of this, survey results may not provide as detailed of an understanding as results obtained using methods of data collection that allow a researcher to more comprehensively examine whatever topic is being studied. Let’s say, for example, that you want to learn something about voters’ willingness to elect an African American president. General Social Survey respondents were asked, “If your party nominated an African American for president, would you vote for him if he were qualified for the job?” (Smith, 2009). [4] Respondents were then asked to respond either yes or no to the question. But what if someone’s opinion was more complex than could be answered with a simple yes or no? What if, for example, a person was willing to vote for an African American man, but only if that person was a conservative, moderate, anti-abortion, antiwar, etc. Then we would miss out on that additional detail when the participant responded “yes,” to our question. Of course, you could add a question to your survey about moderate vs. radical candidates, but could you do that for all of the relevant attributes of candidates for all people? Moreover, how do you know that moderate or antiwar means the same thing to everyone who participates in your survey? Without having a conversation with someone and asking them follow up questions, survey research can lack enough detail to understand how people truly think.
In sum, potential drawbacks to survey research include the following:
- Inflexibility
- Lack of depth
- Problems specific to cross-sectional surveys, which we will address in the next section.
Secondary analysis of survey data
This chapter is designed to help you conduct your own survey, but that is not the only option for social work researchers. Look back to Chapter 2 and recall our discussion of secondary data analysis . As we talked about previously, using data collected by another researcher can have a number of benefits. Well-funded researchers have the resources to recruit a large representative sample and ensure their measures are valid and reliable prior to sending them to participants. Before you get too far into designing your own data collection, make sure there are no existing data sets out there that you can use to answer your question. We refer you to Chapter 2 for all full discussion of the strengths and challenges of using secondary analysis of survey data.
Key Takeaways
- Strengths of survey research include its cost effectiveness, generalizability, variety, reliability, and versatility.
- Weaknesses of survey research include inflexibility and lack of potential depth. There are also weaknesses specific to cross-sectional surveys, the most common type of survey.
If you are using quantitative methods in a student project, it is very likely that you are going to use survey design to collect your data.
- Check to make sure that your research question and study fit best with survey design using the criteria in this section
- Remind yourself of any limitations to generalizability based on your sampling frame.
- Refresh your memory on the operational definitions you will use for your dependent and independent variables.
12.2 Collecting data using surveys
- Distinguish between cross-sectional and longitudinal surveys
- Identify the strengths and limitations of each approach to collecting survey data, including the timing of data collection and how the questionnaire is delivered to participants
As we discussed in the previous chapter, surveys are versatile and can be shaped and suited to most topics of inquiry. While that makes surveys a great research tool, it also means there are many options to consider when designing your survey. The two main considerations for designing surveys is how many times researchers will collect data from participants and how researchers contact participants and record responses to the questionnaire.

Cross-sectional surveys: A snapshot in time
Think back to the last survey you took. Did you respond to the questionnaire once or did you respond to it multiple times over a long period? Cross-sectional surveys are administered only one time. Chances are the last survey you took was a cross-sectional survey—a one-shot measure of a sample using a questionnaire. And chances are if you are conducting a survey to collect data for your project, it will be cross-sectional simply because it is more feasible to collect data once than multiple times.
Let’s take a very recent example, the COVID-19 pandemic. Enriquez and colleagues (2021) [5] wanted to understand the impact of the pandemic on undocumented college students’ academic performance, attention to academics, financial stability, mental and physical health, and other factors. In cooperation with offices of undocumented student support at eighteen campuses in California, the researchers emailed undocumented students a few times from March through June of 2020 and asked them to participate in their survey via an online questionnaire. Their survey presents an compelling look at how COVID-19 worsened existing economic inequities in this population.
Strengths and weaknesses of cross-sectional surveys
Cross-sectional surveys are great. They take advantage of many of the strengths of survey design. They are easy to administer since you only need to measure your participants once, which makes them highly suitable for student projects. Keeping track of participants for multiple measures takes time and energy, two resources always under constraint in student projects. Conducting a cross-sectional survey simply requires collecting a sample of people and getting them to fill out your questionnaire—nothing more.
That convenience comes with a tradeoff. When you only measure people at one point in time, you can miss a lot. The events, opinions, behaviors, and other phenomena that such surveys are designed to assess don’t generally remain the same over time. Because nomothetic causal explanations seek a general, universal truth, surveys conducted a decade ago do not represent what people think and feel today or twenty years ago. In student research projects, this weakness is often compounded by the use of availability sampling, which further limits the generalizability of the results in student research projects to other places and times beyond the sample collected by the researcher. Imagine generalizing results on the use of telehealth in social work prior to the COVID-19 pandemic or managers’ willingness to allow employees to telecommute. Both as a result of shocks to the system—like COVID-19—and the linear progression of cultural, economic and social change—like human rights movements—cross-sectional surveys can never truly give us a timeless causal explanation. In our example about undocumented students during COVID-19, you can say something about the way things were in the moment that you administered your survey, but it is difficult to know whether things remained that way for long after you administered your survey or describe patterns that go back far in time.
Of course, just as society changes over time, so do people. Because cross-sectional surveys only measure people at one point in time, they have difficulty establishing cause-and-effect relationships for individuals because they cannot clearly establish whether the cause came before the effect. If your research question were about how school discipline (our independent variable) impacts substance use (our dependent variable), you would want to make that any changes in our dependent variable, substance use, came after changes in school discipline. That is, if your hypothesis is that says school discipline causes increases in substance use, you must establish that school discipline came first and increases in substance use came afterwards. However, it is perhaps just as likely that increased substance use might cause increases in school discipline. If you sent a cross-sectional survey to students asking them about their substance use and disciplinary record, you would get back something like “tried drugs or alcohol 6 times” and “has been suspended 5 times.” You could see whether similar patterns existed in other students, but you wouldn’t be able to tell which was the cause or the effect.
Because of these limitations, cross-sectional surveys are limited in how well they can establish whether a nomothetic causal relationship is true or not. Surveys are still a key part of establishing causality. But they need additional help and support to make causal arguments. That might come from combining data across surveys in meta-analyses and systematic reviews, integrating survey findings with theories that explain causal relationships among variables in the study, as well as corroboration from research using other designs, theories, and paradigms. Scientists can establish causal explanations, in part, based on survey research. However, in keeping with the assumptions of postpositivism, the picture of reality that emerges from survey research is only our best approximation of what is objectively true about human beings in the social world. Science requires a multi-disciplinary conversation among scholars to continually improve our understanding.

Longitudinal surveys: Measuring change over time
One way to overcome this sometimes-problematic aspect of cross-sectional surveys is to administer a longitudinal survey . Longitudinal surveys enable a researcher to make observations over some extended period of time. There are several types of longitudinal surveys, including trend, panel, and cohort surveys. We’ll discuss all three types here, along with retrospective surveys, which fall somewhere in between cross-sectional and longitudinal surveys.
The first type of longitudinal survey is called a trend survey . The main focus of a trend survey is, perhaps not surprisingly, trends. Researchers conducting trend surveys are interested in how people in a specific group change over time. Each time researchers gather data, they survey different people from the identified group because they are interested in the trends of the whole group, rather than changes in specific individuals. Let’s look at an example.
The Monitoring the Future Study is a trend study that described the substance use of high school children in the United States. It’s conducted annually by the National Institute on Drug Abuse (NIDA). Each year, the NIDA distributes surveys to children in high schools around the country to understand how substance use and abuse in that population changes over time. Perhaps surprisingly, fewer high school children reported using alcohol in the past month than at any point over the last 20 years—a fact that often surprises people because it cuts against the stereotype of adolescents engaging in ever-riskier behaviors. Nevertheless, recent data also reflected an increased use of e-cigarettes and the popularity of e-cigarettes with no nicotine over those with nicotine. By tracking these data points over time, we can better target substance abuse prevention programs towards the current issues facing the high school population.
Unlike trend surveys, panel surveys require the same people participate in the survey each time it is administered. As you might imagine, panel studies can be difficult and costly. Imagine trying to administer a survey to the same 100 people every year, for 5 years in a row. Keeping track of where respondents live, when they move, and when they change phone numbers takes resources that researchers often don’t have. However, when the researchers do have the resources to carry out a panel survey, the results can be quite powerful. The Youth Development Study (YDS), administered from the University of Minnesota, offers an excellent example of a panel study.
Since 1988, YDS researchers have administered an annual survey to the same 1,000 people. Study participants were in ninth grade when the study began, and they are now in their thirties. Several hundred papers, articles, and books have been written using data from the YDS. One of the major lessons learned from this panel study is that work has a largely positive impact on young people (Mortimer, 2003). [6] Contrary to popular beliefs about the impact of work on adolescents’ school performance and transition to adulthood, work increases confidence, enhances academic success, and prepares students for success in their future careers. Without this panel study, we may not be aware of the positive impact that working can have on young people.
Another type of longitudinal survey is a cohort survey. In a cohort survey, the participants have a defining characteristic that the researcher is interested in studying. The same people don’t necessarily participate from year to year, but all participants must meet whatever categorical criteria fulfill the researcher’s primary interest. Common cohorts that researchers study include people of particular generations or people born around the same time period, graduating classes, people who began work in a given industry at the same time, or perhaps people who have some specific historical experience in common. An example of this sort of research can be seen in Lindert and colleagues (2020) [7] work on healthy aging in men . Their article is a secondary analysis of longitudinal data collected as part of the Veterans Affairs Normative Aging Study conducted in 1985, 1988, and 1991.

Strengths and weaknesses of longitudinal surveys
All three types of longitudinal surveys share the strength that they permit a researcher to make observations over time. Whether a major world event takes place or participants mature, researchers can effectively capture the subsequent potential changes in the phenomenon or behavior of interest. This is the key strength of longitudinal surveys—their ability to establish temporality needed for nomothetic causal explanations. Whether your project investigates changes in society, communities, or individuals, longitudinal designs improve on cross-sectional designs by providing data at multiple points in time that better establish causality.
Of course, all of that extra data comes at a high cost. If a panel survey takes place over ten years, the research team must keep track of every individual in the study for those ten years, ensuring they have current contact information for their sample the whole time. Consider this study which followed people convicted of driving under the influence of drugs or alcohol (Kleschinsky et al., 2009). [8] It took an average of 8.6 contacts for participants to complete follow-up surveys, and while this was a difficult-to-reach population, researchers engaging in longitudinal research must prepare for considerable time and expense in tracking participants. Keeping in touch with a participant for a prolonged period of time likely requires building participant motivation to stay in the study, maintaining contact at regular intervals, and providing monetary compensation. Panel studies are not the only costly longitudinal design. Trend studies need to recruit a new sample every time they collect a new wave of data at additional cost and time.
In my years as a research methods instructor, I have never seen a longitudinal survey design used in a student research project because students do not have enough time to complete them. Cross-sectional surveys are simply the most convenient and feasible option. Nevertheless, social work researchers with more time to complete their studies use longitudinal surveys to understand causal relationships that they cannot manipulate themselves. A researcher could not ethically experiment on participants by assigning a jail sentence or relapse, but longitudinal surveys allow us to systematically investigate such sensitive phenomena ethically. Indeed, because longitudinal surveys observe people in everyday life, outside of the artificial environment of the laboratory (as in experiments), the generalizability of longitudinal survey results to real-world situations may make them superior to experiments, in some cases.
Table 12.1 summarizes these three types of longitudinal surveys.
| Trend | Researcher examines changes in trends over time; the same people do not necessarily participate in the survey more than once. |
| Panel | Researcher surveys the exact same sample several times over a period of time. |
| Cohort | Researcher identifies a defining characteristic and then regularly surveys people who have that characteristic. |
Retrospective surveys: Good, but not the best of both worlds
Retrospective surveys try to strike a middle ground between the two types of surveys. They are similar to other longitudinal studies in that they deal with changes over time, but like a cross-sectional study, data are collected only once. In a retrospective survey, participants are asked to report events from the past. By having respondents report past behaviors, beliefs, or experiences, researchers are able to gather longitudinal-like data without actually incurring the time or expense of a longitudinal survey. Of course, this benefit must be weighed against the possibility that people’s recollections of their pasts may be faulty. Imagine that you are participating in a survey that asks you to respond to questions about your feelings on Valentine’s Day. As last Valentine’s Day can’t be more than 12 months ago, there is a good chance that you are able to provide a pretty accurate response of how you felt. Now let’s imagine that the researcher wants to know how last Valentine’s Day compares to previous Valentine’s Days, so the survey asks you to report on the preceding six Valentine’s Days. How likely is it that you will remember how you felt at each one? Will your responses be as accurate as they might have been if your data were collected via survey once a year rather reporting the past few years today? The main limitation with retrospective surveys are that they are not as reliable as cross-section or longitudinal surveys. That said, retrospective surveys are a feasible way to collect longitudinal data when the researcher only has access to the population once, and for this reason, they may be worth the drawback of greater risk of bias and error in the measurement process.
Because quantitative research seeks to build nomothetic causal explanations, it is important to determine the order in which things happen. When using survey design to investigate causal relationships between variables in a research question, longitudinal surveys are certainly preferable because they can track changes over time and therefore provide stronger evidence for cause-and-effect relationships. As we discussed, the time and cost required to administer a longitudinal survey can be prohibitive, and most survey research in the scholarly literature is cross-sectional because it is more feasible to collect data once. Well designed cross-sectional surveys provide can provide important evidence for a causal relationship, even if it is imperfect. Once you decide how many times you will collect data from your participants, the next step is to figure out how to get your questionnaire in front of participants.

Self-administered questionnaires
If you are planning to conduct a survey for your research project, chances are you have thought about how you might deliver your survey to participants. If you don’t have a clear picture yet, look back at your work from Chapter 11 on the sampling approach for your project. How are you planning to recruit participants from your sampling frame? If you are considering contacting potential participants via phone or email, perhaps you want to collect your data using a phone or email survey attached to your recruitment materials. If you are planning to collect data from students, colleagues, or other people you most commonly interact with in-person, maybe you want to consider a pen-and-paper survey to collect your data conveniently. As you review the different approaches to administering surveys below, consider how each one matches with your sampling approach and the contact information you have for study participants. Ensure that your sampling approach is feasible conduct before building your survey design from it. For example, if you are planning to administer an online survey, make sure you have email addresses to send your questionnaire or permission to post your survey to an online forum.
Surveys are a versatile research approach. Survey designs vary not only in terms of when they are administered but also in terms of how they are administered. One common way to collect data is in the form of self-administered questionnaires . Self-administered means that the research participant completes the questions independently, usually in writing. Paper questionnaires can be delivered to participants via mail or in person whenever you see your participants. Generally, student projects use in-person collection of paper questionnaires, as mail surveys require physical addresses, spending money, and waiting for the mail. It is common for academic researchers to administer surveys in large social science classes, so perhaps you have taken a survey that was given to you in-person during undergraduate classes. These professors were taking advantage of the same convenience sampling approach that student projects often do. If everyone in your sampling frame is in one room, going into that room and giving them a quick paper survey to fill out is a feasible and convenient way to collect data. Availability sampling may involve asking your sampling frame to complete your study during when they naturally meet—colleagues at a staff meeting, students in the student lounge, professors in a faculty meeting—and self-administered questionnaires are one way to take advantage of this natural grouping of your target population. Try to pick a time and situation when people have the downtime needed to complete your questionnaire, and you can maximize the likelihood that people will participate in your in-person survey. Of course, this convenience may come at the cost of privacy and confidentiality. If your survey addresses sensitive topics, participants may alter their responses because they are in close proximity to other participants while they complete the survey. Regardless of whether participants feel self-conscious or talk about their answers with one another, by potentially altering the participants’ honest response you may have introduced bias or error into your measurement of the variables in your research question.
Because student research projects often rely on availability sampling, collecting data using paper surveys from whoever in your sampling frame is convenient makes sense because the results will be of limited generalizability. But for researchers who aim to generalize (and students who want to publish their study!), self-administered surveys may be better distributed via the mail or electronically. While is very unusual for a student project to send a questionnaire via the mail, this method is used quite often in the scholarly literature and for good reason. Survey researchers who deliver their surveys via postal mail often provide some advance notice to respondents about the survey to get people thinking and preparing to complete it. They may also follow up with their sample a few weeks after their survey has been sent out. This can be done not only to remind those who have not yet completed the survey to please do so but also to thank those who have already returned the survey. Most survey researchers agree that this sort of follow-up is essential for improving mailed surveys’ return rates (Babbie, 2010). [6] Other helpful tools to increase response rate are to create an attractive and professional survey, offer monetary incentives, and provide a pre-addressed, stamped return envelope. These are also effective for other types of surveys.
While snail mail may not be feasible for student project, it is increasingly common for student projects and social science projects to use email and other modes of online delivery like social media to collect responses to a questionnaire. Researchers like online delivery for many reasons. It’s quicker than knocking on doors in a neighborhood for an in-person survey or waiting for mailed surveys to be returned. It’s cheap, too. There are many free tools like Google Forms and Survey Monkey (which includes a premium option). While you are affiliated with a university, you may have access to commercial research software like Redcap or Qualtrics which provide much more advanced tools for collecting survey data than free options. Online surveys can take advantage of the advantages of computer-mediated data collection by playing a video before asking a question, tracking how long participants take to answer each question, and making sure participants don’t fill out the survey more than once (to name a few examples. Moreover, survey data collected via online forms can be exported for analysis in spreadsheet software like Google Sheets or Microsoft Excel or statistics software like SPSS or JASP , a free and open-source alternative to SPSS. While the exported data still need to be checked before analysis, online distribution saves you the trouble of manually inputting every response a participant writes down on a paper survey into a computer to analyze.
The process of collecting data online depends on your sampling frame and approach to recruitment. If your project plans to reach out to people via email to ask them to participate in your study, you should attach your survey to your recruitment email. You already have their attention, and you may not get it again (even if you remind them). Think pragmatically. You will need access to the email addresses of people in your sampling frame. You may be able to piece together a list of email addresses based on public information (e.g., faculty email addresses are on their university webpage, practitioner emails are in marketing materials). In other cases, you may know of a pre-existing list of email addresses to which your target population subscribes (e.g., all undergraduate students in a social work program, all therapists at an agency), and you will need to gain the permission of the list’s administrator recruit using the email platform. Other projects will identify an online forum in which their target population congregates and recruit participants there. For example, your project might identify a Facebook group used by students in your social work program or practitioners in your local area to distribute your survey. Of course, you can post a survey to your personal social media account (or one you create for the survey), but depending on your question, you will need a detailed plan on how to reach participants with enough relevant knowledge about your topic to provide informed answers to your questionnaire.
Many of the suggestions that were provided earlier to improve the response rate of hard copy questionnaires also apply to online questionnaires, including the development of an attractive survey and sending reminder emails. One challenge not present in mail surveys is the spam filter or junk mail box. While people will at least glance at recruitment materials send via mail, email programs may automatically filter out recruitment emails so participants never see them at all. While the financial incentives that can be provided online differ from those that can be given in person or by mail, online survey researchers can still offer completion incentives to their respondents. Over the years, I’ve taken numerous online surveys. Often, they did not come with any incentive other than the joy of knowing that I’d helped a fellow social scientist do their job. However, some surveys have their perks. One survey offered a coupon code to use for $30 off any order at a major online retailer and another allowed the opportunity to be entered into a lottery with other study participants to win a larger gift, such as a $50 gift card or a tablet computer. Student projects should not pay participants unless they have grant funding to cover that cost, and there should be no expectations of any out-of-pocket costs for students to complete their research project.
One area in which online surveys are less suitable than mail or in-person surveys is when your target population includes individuals with limited, unreliable, or no access to the internet or individuals with limited computer skills. For these groups, an online survey is inaccessible. At the same time, online surveys offer the most feasible way to collect data anonymously. By posting recruitment materials to a Facebook group or list of practitioners at an agency, you can avoid collecting identifying information from people who participated in your study. For studies that address sensitive topics, online surveys also offer the opportunity to complete the survey privately (again, assuming participants have access to a phone or personal computer). If you have the person’s email address, physical address, or met them in-person, your participants are not anonymous, but if you need to collect data anonymously, online tools offer a feasible way to do so.
The best way to collect data using self-administered questionnaires depends on numerous factors. The strengths and weaknesses of in-person, mail, and electronic self-administered surveys are reviewed in Table 12.2. Ultimately, you must make the best decision based on its congruence with your sampling approach and what you can feasibly do. Decisions about survey design should be done with a deep appreciation for your study’s target population and how your design choices may impact their responses to your survey.
| : it’s easy if your participants congregate in an accessible location; but costly to go door-to-door to collect surveys | : it’s too expensive for unfunded projects but a cost-effective option for funded projects | : it’s free and easy to use online survey tools | |
| : it’s easy if your participants congregate in an accessible location; but time-consuming to go door-to-door to collect surveys | : it can take a while for mail to travel | : delivery is instantaneous | |
| : it can be harder to ignore someone in person | : it is easy to ignore junk mail, solicitations | : it’s easy to ignore junk mail; spam filter may block you | |
| : it is very difficult to provide anonymity and people may have to respond in a public place, rather than privately in a safe place | : it cannot provide true anonymity as other household members may see participants’ mail, but people can likely respond privately in a safe place | : can collect data anonymously and respond privately in a safe place | |
| : by going where your participants already gather, you increase your likelihood of getting responses | : it reaches those without internet, but misses those who change addresses often (e.g., college students) | : it misses those who change phone or emails often or don’t use the internet; but reaches online communities | |
| : paper questionnaires are not interactive | : paper questionnaires are not interactive | : electronic questionnaires can include multimedia elements, interactive questions and response options | |
| : researcher inputs data manually | : researcher inputs data manually | : survey software inputs data automatically |

Quantitative interviews: Researcher-administered questionnaires
There are some cases in which it is not feasible to provide a written questionnaire to participants, either on paper or digitally. In this case, the questionnaire can be administered verbally by the researcher to respondents. Rather than the participant reading questions independently on paper or digital screen, the researcher reads questions and answer choices aloud to participants and records their responses for analysis. Another word for this kind of questionnaire is an interview schedule . It’s called a schedule because each question and answer is posed in the exact same way each time.
Consistency is key in quantitative interviews . By presenting each question and answer option in exactly the same manner to each interviewee, the researcher minimizes the potential for the interviewer effect , which encompasses any possible changes in interviewee responses based on how or when the researcher presents question-and-answer options. Additionally, in-person surveys may be video recorded and you can typically take notes without distracting the interviewee due to the closed-ended nature of survey questions, making them helpful for identifying how participants respond to the survey or which questions might be confusing.
Quantitative interviews can take place over the phone or in-person. Phone surveys are often conducted by political polling firms to understand how the electorate feels about certain candidates or policies. In both cases, researchers verbally pose questions to participants. For many years, live-caller polls (a live human being calling participants in a phone survey) were the gold-standard in political polling. Indeed, phone surveys were excellent for drawing representative samples prior to mobile phones. Unlike landlines, cell phone numbers are portable across carriers, associated with individuals as opposed to households, and do not change their first three numbers when people move to a new geographical area. For this reason, many political pollsters have moved away from random-digit phone dialing and toward a mix of data collection strategies like texting-based surveys or online panels to recruit a representative sample and generalizable results for the target population (Silver, 2021). [9]
I guess I should admit that I often decline to participate in phone studies when I am called. In my defense, it’s usually just a customer service survey! My point is that it is easy and even socially acceptable to abruptly hang up on an unwanted caller asking you to participate in a survey, and given the high incidence of spam calls, many people do not pick up the phone for numbers they do not know. We will discuss response rates in greater detail at the end of the chapter. One of the benefits of phone surveys is that a person can complete them in their home or a safe place. At the same time, a distracted participant who is cooking dinner, tending to children, or driving may not provide accurate answers to your questions. Phone surveys make it difficult to control the environment in which a person answers your survey. When administering a phone survey, the researcher can record responses on a paper questionnaire or directly into a computer program. For large projects in which many interviews must be conducted by research staff, computer-assisted telephone interviewing (CATI) ensures that each question and answer option are presented the same way and input into the computer for analysis. For student projects, you can read from a digital or paper copy of your questionnaire and record participants responses into a spreadsheet program like Excel or Google Sheets.
Interview schedules must be administered in such a way that the researcher asks the same question the same way each time. While questions on self-administered questionnaires may create an impression based on the way they are presented, having a researcher pose the questions verbally introduces additional variables that might influence a respondent. Controlling one’s wording, tone of voice, and pacing can be difficult over the phone, but it is even more challenging in-person because the researcher must also control their non-verbal expressions and behaviors that may bias survey respondents. Even a slight shift in emphasis or wording may bias the respondent to answer differently. As we’ve mentioned earlier, consistency is key with quantitative data collection—and human beings are not necessarily known for their consistency. But what happens if a participant asks a question of the researcher? Unlike self-administered questionnaires, quantitative interviews allow the participant to speak directly with the researcher if they need more information about a question. While this can help participants respond accurately, it can also introduce inconsistencies between how the survey administered to each participant. Ideally, the researcher should draft sample responses researchers might provide to participants if they are confused on certain survey items. The strengths and weaknesses of phone and in-person quantitative interviews are summarized in Table 12.3 below.
| : it’s easy if your participants congregate in an accessible location; but costly to go door-to-door to collect surveys | : phone calls are free or low-cost | |
| quantitative interviews take a long time because each question must be read aloud to each participant | quantitative interviews take a long time because each question must be read aloud to each participant | |
| : it can be harder to ignore someone in person | : it is easy to ignore unwanted or unexpected calls | |
| : it is very difficult to provide anonymity and people will have to respond in a public place, rather than privately in a safe place | : it is difficult for the researcher to control the context in which the participant responds, which might be private or public, safe or unsafe | |
| : by going where your participants already gather, you increase your likelihood of getting responses | : it is easy to ignore unwanted or unexpected calls | |
| : interview schedules are kept simple because questions are read aloud | : interview schedules are kept simple because questions are read aloud | |
| : researcher inputs data manually | : researcher inputs data manually |
Students using survey design should settle on a delivery method that presents the most favorable tradeoff between strengths and challenges for their unique context. One key consideration is your sampling approach. If you already have the participant on the phone and they agree to be a part of your sample…you may as well ask them your survey questions right then if the participant can do so. These feasibility concerns make in-person quantitative interviews a poor fit for student projects. It is far easier and quicker to distribute paper surveys to a group of people it is to administer the survey verbally to each participant individually. Ultimately, you are the one who has to carry out your research design. Make sure you can actually follow your plan!
- Time is a factor in determining what type of survey a researcher administers; cross-sectional surveys are administered at one time, and longitudinal surveys are at multiple points in time.
- Retrospective surveys offer some of the benefits of longitudinal research while only collecting data once but may be less reliable.
- Self-administered questionnaires may be delivered in-person, online, or via mail.
- Interview schedules are used with in-person or phone surveys (a.k.a. quantitative interviews).
- Each way to administer surveys comes with benefits and drawbacks.
In this section, we assume that you are using a cross-sectional survey design. But how will you deliver your survey? Recall your sampling approach you developed in Chapter 10 . Consider the following questions when evaluating delivery methods for surveys.
- Can you attach your survey to your recruitment emails, calls, or other contacts with potential participants?
- What contact information (e.g., phone number, email address) do you need to deliver your survey?
- Do you need to maintain participant anonymity?
- Is there anything unique about your target population or sampling frame that may impact survey research?
Imagine you are a participant in your survey.
- Beginning with the first contact for recruitment into your study and ending with a completed survey, describe each step of the data collection process from the perspective of a person responding to your survey. You should be able to provide a pretty clear timeline of how your survey will proceed at this point, even if some of the details eventually change
12.3 Writing effective questions and questionnaires
- Describe some of the ways that survey questions might confuse respondents and how to word questions and responses clearly
- Create mutually exclusive, exhaustive, and balanced response options
- Define fence-sitting and floating
- Describe the considerations involved in constructing a well-designed questionnaire
- Discuss why pilot testing is important
In the previous section, we reviewed how researchers collect data using surveys. Guided by their sampling approach and research context, researchers should choose the survey approach that provides the most favorable tradeoffs in strengths and challenges. With this information in hand, researchers need to write their questionnaire and revise it before beginning data collection. Each method of delivery requires a questionnaire, but they vary a bit based on how they will be used by the researcher. Since phone surveys are read aloud, researchers will pay more attention to how the questionnaire sounds than how it looks. Online surveys can use advanced tools to require the completion of certain questions, present interactive questions and answers, and otherwise afford greater flexibility in how questionnaires are designed. As you read this section, consider how your method of delivery impacts the type of questionnaire you will design. Because most student projects use paper or online surveys, this section will detail how to construct self-administered questionnaires to minimize the potential for bias and error.

Start with operationalization
The first thing you need to do to write effective survey questions is identify what exactly you wish to know. As silly as it sounds to state what seems so completely obvious, we can’t stress enough how easy it is to forget to include important questions when designing a survey. Begin by looking at your research question and refreshing your memory of the operational definitions you developed for those variables from Chapter 11 . You should have a pretty firm grasp of your operational definitions before starting the process of questionnaire design. You may have taken those operational definitions from other researchers’ methods, found established scales and indices for your measures, or created your own questions and answer options.
STOP! Make sure you have a complete operational definition for the dependent and independent variables in your research question. A complete operational definition contains the variable being measured, the measure used, and how the researcher interprets the measure. Let’s make sure you have what you need from Chapter 11 to begin writing your questionnaire.
List all of the dependent and independent variables in your research question.
- It’s normal to have one dependent or independent variable. It’s also normal to have more than one of either.
- Make sure that your research question (and this list) contain all of the variables in your hypothesis. Your hypothesis should only include variables from you research question.
For each variable in your list:
- If you don’t have questions and answers finalized yet, write a first draft and revise it based on what you read in this section.
- If you are using a measure from another researcher, you should be able to write out all of the questions and answers associated with that measure. If you only have the name of a scale or a few questions, you need to access to the full text and some documentation on how to administer and interpret it before you can finish your questionnaire.
- For example, an interpretation might be “there are five 7-point Likert scale questions…point values are added across all five items for each participant…and scores below 10 indicate the participant has low self-esteem”
- Don’t introduce other variables into the mix here. All we are concerned with is how you will measure each variable by itself. The connection between variables is done using statistical tests, not operational definitions.
- Detail any validity or reliability issues uncovered by previous researchers using the same measures. If you have concerns about validity and reliability, note them, as well.
If you completed the exercise above and listed out all of the questions and answer choices you will use to measure the variables in your research question, you have already produced a pretty solid first draft of your questionnaire! Congrats! In essence, questionnaires are all of the self-report measures in your operational definitions for the independent, dependent, and control variables in your study arranged into one document and administered to participants. There are a few questions on a questionnaire (like name or ID#) that are not associated with the measurement of variables. These are the exception, and it’s useful to think of a questionnaire as a list of measures for variables. Of course, researchers often use more than one measure of a variable (i.e., triangulation ) so they can more confidently assert that their findings are true. A questionnaire should contain all of the measures researchers plan to collect about their variables by asking participants to self-report. As we will discuss in the final section of this chapter, triangulating across data sources (e.g., measuring variables using client files or student records) can avoid some of the common sources of bias in survey research.
Sticking close to your operational definitions is important because it helps you avoid an everything-but-the-kitchen-sink approach that includes every possible question that occurs to you. Doing so puts an unnecessary burden on your survey respondents. Remember that you have asked your participants to give you their time and attention and to take care in responding to your questions; show them your respect by only asking questions that you actually plan to use in your analysis. For each question in your questionnaire, ask yourself how this question measures a variable in your study. An operational definition should contain the questions, response options, and how the researcher will draw conclusions about the variable based on participants’ responses.
Writing questions
So, almost all of the questions on a questionnaire are measuring some variable. For many variables, researchers will create their own questions rather than using one from another researcher. This section will provide some tips on how to create good questions to accurately measure variables in your study. First, questions should be as clear and to the point as possible. This is not the time to show off your creative writing skills; a survey is a technical instrument and should be written in a way that is as direct and concise as possible. As I’ve mentioned earlier, your survey respondents have agreed to give their time and attention to your survey. The best way to show your appreciation for their time is to not waste it. Ensuring that your questions are clear and concise will go a long way toward showing your respondents the gratitude they deserve. Pilot testing the questionnaire with friends or colleagues can help identify these issues. This process is commonly called pretesting, but to avoid any confusion with pretesting in experimental design, we refer to it as pilot testing.
Related to the point about not wasting respondents’ time, make sure that every question you pose will be relevant to every person you ask to complete it. This means two things: first, that respondents have knowledge about whatever topic you are asking them about, and second, that respondents have experienced the events, behaviors, or feelings you are asking them to report. If you are asking participants for second-hand knowledge—asking clinicians about clients’ feelings, asking teachers about students’ feelings, and so forth—you may want to clarify that the variable you are asking about is the key informant’s perception of what is happening in the target population. A well-planned sampling approach ensures that participants are the most knowledgeable population to complete your survey.
If you decide that you do wish to include questions about matters with which only a portion of respondents will have had experience, make sure you know why you are doing so. For example, if you are asking about MSW student study patterns, and you decide to include a question on studying for the social work licensing exam, you may only have a small subset of participants who have begun studying for the graduate exam or took the bachelor’s-level exam. If you decide to include this question that speaks to a minority of participants’ experiences, think about why you are including it. Are you interested in how studying for class and studying for licensure differ? Are you trying to triangulate study skills measures? Researchers should carefully consider whether questions relevant to only a subset of participants is likely to produce enough valid responses for quantitative analysis.
Many times, questions that are relevant to a subsample of participants are conditional on an answer to a previous question. A participant might select that they rent their home, and as a result, you might ask whether they carry renter’s insurance. That question is not relevant to homeowners, so it would be wise not to ask them to respond to it. In that case, the question of whether someone rents or owns their home is a filter question , designed to identify some subset of survey respondents who are asked additional questions that are not relevant to the entire sample. Figure 12.1 presents an example of how to accomplish this on a paper survey by adding instructions to the participant that indicate what question to proceed to next based on their response to the first one. Using online survey tools, researchers can use filter questions to only present relevant questions to participants.

Researchers should eliminate questions that ask about things participants don’t know to minimize confusion. Assuming the question is relevant to the participant, other sources of confusion come from how the question is worded. The use of negative wording can be a source of potential confusion. Taking the question from Figure 12.1 about drinking as our example, what if we had instead asked, “Did you not abstain from drinking during your first semester of college?” This is a double negative, and it’s not clear how to answer the question accurately. It is a good idea to avoid negative phrasing, when possible. For example, “did you not drink alcohol during your first semester of college?” is less clear than “did you drink alcohol your first semester of college?”
You should also avoid using terms or phrases that may be regionally or culturally specific (unless you are absolutely certain all your respondents come from the region or culture whose terms you are using). When I first moved to southwest Virginia, I didn’t know what a holler was. Where I grew up in New Jersey, to holler means to yell. Even then, in New Jersey, we shouted and screamed, but we didn’t holler much. In southwest Virginia, my home at the time, a holler also means a small valley in between the mountains. If I used holler in that way on my survey, people who live near me may understand, but almost everyone else would be totally confused. A similar issue arises when you use jargon, or technical language, that people do not commonly know. For example, if you asked adolescents how they experience imaginary audience , they would find it difficult to link those words to the concepts from David Elkind’s theory. The words you use in your questions must be understandable to your participants. If you find yourself using jargon or slang, break it down into terms that are more universal and easier to understand.
Asking multiple questions as though they are a single question can also confuse survey respondents. There’s a specific term for this sort of question; it is called a double-barreled question . Figure 12.2 shows a double-barreled question. Do you see what makes the question double-barreled? How would someone respond if they felt their college classes were more demanding but also more boring than their high school classes? Or less demanding but more interesting? Because the question combines “demanding” and “interesting,” there is no way to respond yes to one criterion but no to the other.

Another thing to avoid when constructing survey questions is the problem of social desirability . We all want to look good, right? And we all probably know the politically correct response to a variety of questions whether we agree with the politically correct response or not. In survey research, social desirability refers to the idea that respondents will try to answer questions in a way that will present them in a favorable light. (You may recall we covered social desirability bias in Chapter 11 .)
Perhaps we decide that to understand the transition to college, we need to know whether respondents ever cheated on an exam in high school or college for our research project. We all know that cheating on exams is generally frowned upon (at least I hope we all know this). So, it may be difficult to get people to admit to cheating on a survey. But if you can guarantee respondents’ confidentiality, or even better, their anonymity, chances are much better that they will be honest about having engaged in this socially undesirable behavior. Another way to avoid problems of social desirability is to try to phrase difficult questions in the most benign way possible. Earl Babbie (2010) [10] offers a useful suggestion for helping you do this—simply imagine how you would feel responding to your survey questions. If you would be uncomfortable, chances are others would as well.
Try to step outside your role as researcher for a second, and imagine you were one of your participants. Evaluate the following:
- Is the question too general? Sometimes, questions that are too general may not accurately convey respondents’ perceptions. If you asked someone how they liked a certain book and provide a response scale ranging from “not at all” to “extremely well”, and if that person selected “extremely well,” what do they mean? Instead, ask more specific behavioral questions, such as “Will you recommend this book to others?” or “Do you plan to read other books by the same author?”
- Is the question too detailed? Avoid unnecessarily detailed questions that serve no specific research purpose. For instance, do you need the age of each child in a household or is just the number of children in the household acceptable? However, if unsure, it is better to err on the side of details than generality.
- Is the question presumptuous? Does your question make assumptions? For instance, if you ask, “what do you think the benefits of a tax cut would be?” you are presuming that the participant sees the tax cut as beneficial. But many people may not view tax cuts as beneficial. Some might see tax cuts as a precursor to less funding for public schools and fewer public services such as police, ambulance, and fire department. Avoid questions with built-in presumptions.
- Does the question ask the participant to imagine something? Is the question imaginary? A popular question on many television game shows is “if you won a million dollars on this show, how will you plan to spend it?” Most participants have never been faced with this large amount of money and have never thought about this scenario. In fact, most don’t even know that after taxes, the value of the million dollars will be greatly reduced. In addition, some game shows spread the amount over a 20-year period. Without understanding this “imaginary” situation, participants may not have the background information necessary to provide a meaningful response.
Finally, it is important to get feedback on your survey questions from as many people as possible, especially people who are like those in your sample. Now is not the time to be shy. Ask your friends for help, ask your mentors for feedback, ask your family to take a look at your survey as well. The more feedback you can get on your survey questions, the better the chances that you will come up with a set of questions that are understandable to a wide variety of people and, most importantly, to those in your sample.
In sum, in order to pose effective survey questions, researchers should do the following:
- Identify how each question measures an independent, dependent, or control variable in their study.
- Keep questions clear and succinct.
- Make sure respondents have relevant lived experience to provide informed answers to your questions.
- Use filter questions to avoid getting answers from uninformed participants.
- Avoid questions that are likely to confuse respondents—including those that use double negatives, use culturally specific terms or jargon, and pose more than one question at a time.
- Imagine how respondents would feel responding to questions.
- Get feedback, especially from people who resemble those in the researcher’s sample.
Let’s complete a first draft of your questions. In the previous exercise, you listed all of the questions and answers you will use to measure the variables in your research question.
- In the previous exercise, you wrote out the questions and answers for each measure of your independent and dependent variables. Evaluate each question using the criteria listed above on effective survey questions.
- Type out questions for your control variables and evaluate them, as well. Consider what response options you want to offer participants.
Now, let’s revise any questions that do not meet your standards!
- Use the BRUSO model in Table 12.2 for an illustration of how to address deficits in question wording. Keep in mind that you are writing a first draft in this exercise, and it will take a few drafts and revisions before your questions are ready to distribute to participants.
| “Are you now or have you ever been the possessor of a firearm?” | Have you ever possessed a firearm? | |
| “Who did you vote for in the last election?” | Note: Only include items that are relevant to your study. | |
| “Are you a gun person?” | Do you currently own a gun?” | |
| How much have you read about the new gun control measure and sales tax?” | “How much have you read about the new sales tax on firearm purchases?” | |
| “How much do you support the beneficial new gun control measure?” | “What is your view of the new gun control measure?” |

Writing response options
While posing clear and understandable questions in your survey is certainly important, so too is providing respondents with unambiguous response options. Response options are the answers that you provide to the people completing your questionnaire. Generally, respondents will be asked to choose a single (or best) response to each question you pose. We call questions in which the researcher provides all of the response options closed-ended questions . Keep in mind, closed-ended questions can also instruct respondents to choose multiple response options, rank response options against one another, or assign a percentage to each response option. But be cautious when experimenting with different response options! Accepting multiple responses to a single question may add complexity when it comes to quantitatively analyzing and interpreting your data.
Surveys need not be limited to closed-ended questions. Sometimes survey researchers include open-ended questions in their survey instruments as a way to gather additional details from respondents. An open-ended question does not include response options; instead, respondents are asked to reply to the question in their own way, using their own words. These questions are generally used to find out more about a survey participant’s experiences or feelings about whatever they are being asked to report in the survey. If, for example, a survey includes closed-ended questions asking respondents to report on their involvement in extracurricular activities during college, an open-ended question could ask respondents why they participated in those activities or what they gained from their participation. While responses to such questions may also be captured using a closed-ended format, allowing participants to share some of their responses in their own words can make the experience of completing the survey more satisfying to respondents and can also reveal new motivations or explanations that had not occurred to the researcher. This is particularly important for mixed-methods research. It is possible to analyze open-ended response options quantitatively using content analysis (i.e., counting how often a theme is represented in a transcript looking for statistical patterns). However, for most researchers, qualitative data analysis will be needed to analyze open-ended questions, and researchers need to think through how they will analyze any open-ended questions as part of their data analysis plan. We will address qualitative data analysis in greater detail in Chapter 19 .
To keep things simple, we encourage you to use only closed-ended response options in your study. While open-ended questions are not wrong, they are often a sign in our classrooms that students have not thought through all the way how to operationally define and measure their key variables. Open-ended questions cannot be operationally defined because you don’t know what responses you will get. Instead, you will need to analyze the qualitative data using one of the techniques we discuss in Chapter 19 to interpret your participants’ responses.
To write an effective response options for closed-ended questions, there are a couple of guidelines worth following. First, be sure that your response options are mutually exclusive . Look back at Figure 12.1, which contains questions about how often and how many drinks respondents consumed. Do you notice that there are no overlapping categories in the response options for these questions? This is another one of those points about question construction that seems fairly obvious but that can be easily overlooked. Response options should also be exhaustive . In other words, every possible response should be covered in the set of response options that you provide. For example, note that in question 10a in Figure 12.1, we have covered all possibilities—those who drank, say, an average of once per month can choose the first response option (“less than one time per week”) while those who drank multiple times a day each day of the week can choose the last response option (“7+”). All the possibilities in between these two extremes are covered by the middle three response options, and every respondent fits into one of the response options we provided.
Earlier in this section, we discussed double-barreled questions. Response options can also be double barreled, and this should be avoided. Figure 12.3 is an example of a question that uses double-barreled response options. Other tips about questions are also relevant to response options, including that participants should be knowledgeable enough to select or decline a response option as well as avoiding jargon and cultural idioms.

Even if you phrase questions and response options clearly, participants are influenced by how many response options are presented on the questionnaire. For Likert scales, five or seven response options generally allow about as much precision as respondents are capable of. However, numerical scales with more options can sometimes be appropriate. For dimensions such as attractiveness, pain, and likelihood, a 0-to-10 scale will be familiar to many respondents and easy for them to use. Regardless of the number of response options, the most extreme ones should generally be “balanced” around a neutral or modal midpoint. An example of an unbalanced rating scale measuring perceived likelihood might look like this:
Unlikely | Somewhat Likely | Likely | Very Likely | Extremely Likely
Because we have four rankings of likely and only one ranking of unlikely, the scale is unbalanced and most responses will be biased toward “likely” rather than “unlikely.” A balanced version might look like this:
Extremely Unlikely | Somewhat Unlikely | As Likely as Not | Somewhat Likely | Extremely Likely
In this example, the midpoint is halfway between likely and unlikely. Of course, a middle or neutral response option does not have to be included. Researchers sometimes choose to leave it out because they want to encourage respondents to think more deeply about their response and not simply choose the middle option by default. Fence-sitters are respondents who choose neutral response options, even if they have an opinion. Some people will be drawn to respond, “no opinion” even if they have an opinion, particularly if their true opinion is the not a socially desirable opinion. Floaters , on the other hand, are those that choose a substantive answer to a question when really, they don’t understand the question or don’t have an opinion.
As you can see, floating is the flip side of fence-sitting. Thus, the solution to one problem is often the cause of the other. How you decide which approach to take depends on the goals of your research. Sometimes researchers specifically want to learn something about people who claim to have no opinion. In this case, allowing for fence-sitting would be necessary. Other times researchers feel confident their respondents will all be familiar with every topic in their survey. In this case, perhaps it is okay to force respondents to choose one side or another (e.g., agree or disagree) without a middle option (e.g., neither agree nor disagree) or to not include an option like “don’t know enough to say” or “not applicable.” There is no always-correct solution to either problem. But in general, including middle option in a response set provides a more exhaustive set of response options than one that excludes one.
The most important check before your finalize your response options is to align them with your operational definitions. As we’ve discussed before, your operational definitions include your measures (questions and responses options) as well as how to interpret those measures in terms of the variable being measured. In particular, you should be able to interpret all response options to a question based on your operational definition of the variable it measures. If you wanted to measure the variable “social class,” you might ask one question about a participant’s annual income and another about family size. Your operational definition would need to provide clear instructions on how to interpret response options. Your operational definition is basically like this social class calculator from Pew Research , though they include a few more questions in their definition.
To drill down a bit more, as Pew specifies in the section titled “how the income calculator works,” the interval/ratio data respondents enter is interpreted using a formula combining a participant’s four responses to the questions posed by Pew categorizing their household into three categories—upper, middle, or lower class. So, the operational definition includes the four questions comprising the measure and the formula or interpretation which converts responses into the three final categories that we are familiar with: lower, middle, and upper class.
It is interesting to note that even though participants inis an ordinal level of measurement. Whereas, Pew asks four questions that use an interval or ratio level of measurement (depending on the question). This means that respondents provide numerical responses, rather than choosing categories like lower, middle, and upper class. It’s perfectly normal for operational definitions to change levels of measurement, and it’s also perfectly normal for the level of measurement to stay the same. The important thing is that each response option a participant can provide is accounted for by the operational definition. Throw any combination of family size, location, or income at the Pew calculator, and it will define you into one of those three social class categories.
Unlike Pew’s definition, the operational definitions in your study may not need their own webpage to define and describe. For many questions and answers, interpreting response options is easy. If you were measuring “income” instead of “social class,” you could simply operationalize the term by asking people to list their total household income before taxes are taken out. Higher values indicate higher income, and lower values indicate lower income. Easy. Regardless of whether your operational definitions are simple or more complex, every response option to every question on your survey (with a few exceptions) should be interpretable using an operational definition of a variable. Just like we want to avoid an everything-but-the-kitchen-sink approach to questions on our questionnaire, you want to make sure your final questionnaire only contains response options that you will use in your study.
One note of caution on interpretation (sorry for repeating this). We want to remind you again that an operational definition should not mention more than one variable. In our example above, your operational definition could not say “a family of three making under $50,000 is lower class; therefore, they are more likely to experience food insecurity.” That last clause about food insecurity may well be true, but it’s not a part of the operational definition for social class. Each variable (food insecurity and class) should have its own operational definition. If you are talking about how to interpret the relationship between two variables, you are talking about your data analysis plan . We will discuss how to create your data analysis plan beginning in Chapter 14 . For now, one consideration is that depending on the statistical test you use to test relationships between variables, you may need nominal, ordinal, or interval/ratio data. Your questions and response options should match the level of measurement you need with the requirements of the specific statistical tests in your data analysis plan. Once you finalize your data analysis plan, return to your questionnaire to match the level of measurement matches with the statistical test you’ve chosen.
In summary, to write effective response options researchers should do the following:
- Avoid wording that is likely to confuse respondents—including double negatives, use culturally specific terms or jargon, and double-barreled response options.
- Ensure response options are relevant to participants’ knowledge and experience so they can make an informed and accurate choice.
- Present mutually exclusive and exhaustive response options.
- Consider fence-sitters and floaters, and the use of neutral or “not applicable” response options.
- Define how response options are interpreted as part of an operational definition of a variable.
- Check level of measurement matches operational definitions and the statistical tests in the data analysis plan (once you develop one in the future)
Look back at the response options you drafted in the previous exercise. Make sure you have a first draft of response options for each closed-ended question on your questionnaire.
- Using the criteria above, evaluate the wording of the response options for each question on your questionnaire.
- Revise your questions and response options until you have a complete first draft.
- Do your first read-through and provide a dummy answer to each question. Make sure you can link each response option and each question to an operational definition.
- Look ahead to Chapter 14 and consider how each item on your questionnaire will inform your data analysis plan.
From this discussion, we hope it is clear why researchers using quantitative methods spell out all of their plans ahead of time. Ultimately, there should be a straight line from operational definition through measures on your questionnaire to the data analysis plan. If your questionnaire includes response options that are not aligned with operational definitions or not included in the data analysis plan, the responses you receive back from participants won’t fit with your conceptualization of the key variables in your study. If you do not fix these errors and proceed with collecting unstructured data, you will lose out on many of the benefits of survey research and face overwhelming challenges in answering your research question.

Designing questionnaires
Based on your work in the previous section, you should have a first draft of the questions and response options for the key variables in your study. Now, you’ll also need to think about how to present your written questions and response options to survey respondents. It’s time to write a final draft of your questionnaire and make it look nice. Designing questionnaires takes some thought. First, consider the route of administration for your survey. What we cover in this section will apply equally to paper and online surveys, but if you are planning to use online survey software, you should watch tutorial videos and explore the features of of the survey software you will use.
Informed consent & instructions
Writing effective items is only one part of constructing a survey. For one thing, every survey should have a written or spoken introduction that serves two basic functions (Peterson, 2000) . [11] One is to encourage respondents to participate in the survey. In many types of research, such encouragement is not necessary either because participants do not know they are in a study (as in naturalistic observation) or because they are part of a subject pool and have already shown their willingness to participate by signing up and showing up for the study. Survey research usually catches respondents by surprise when they answer their phone, go to their mailbox, or check their e-mail—and the researcher must make a good case for why they should agree to participate. Thus, the introduction should briefly explain the purpose of the survey and its importance, provide information about the sponsor of the survey (university-based surveys tend to generate higher response rates), acknowledge the importance of the respondent’s participation, and describe any incentives for participating.
The second function of the introduction is to establish informed consent . Remember that this involves describing to respondents everything that might affect their decision to participate. This includes the topics covered by the survey, the amount of time it is likely to take, the respondent’s option to withdraw at any time, confidentiality issues, and other ethical considerations we covered in Chapter 6 . Written consent forms are not always used in survey research (when the research is of minimal risk and completion of the survey instrument is often accepted by the IRB as evidence of consent to participate), so it is important that this part of the introduction be well documented and presented clearly and in its entirety to every respondent.
Organizing items to be easy and intuitive to follow
The introduction should be followed by the substantive questionnaire items. But first, it is important to present clear instructions for completing the questionnaire, including examples of how to use any unusual response scales. Remember that the introduction is the point at which respondents are usually most interested and least fatigued, so it is good practice to start with the most important items for purposes of the research and proceed to less important items. Items should also be grouped by topic or by type. For example, items using the same rating scale (e.g., a 5-point agreement scale) should be grouped together if possible to make things faster and easier for respondents. Demographic items are often presented last because they are least interesting to participants but also easy to answer in the event respondents have become tired or bored. Of course, any survey should end with an expression of appreciation to the respondent.
Questions are often organized thematically. If our survey were measuring social class, perhaps we’d have a few questions asking about employment, others focused on education, and still others on housing and community resources. Those may be the themes around which we organize our questions. Or perhaps it would make more sense to present any questions we had about parents’ income and then present a series of questions about estimated future income. Grouping by theme is one way to be deliberate about how you present your questions. Keep in mind that you are surveying people, and these people will be trying to follow the logic in your questionnaire. Jumping from topic to topic can give people a bit of whiplash and may make participants less likely to complete it.
Using a matrix is a nice way of streamlining response options for similar questions. A matrix is a question type that that lists a set of questions for which the answer categories are all the same. If you have a set of questions for which the response options are the same, it may make sense to create a matrix rather than posing each question and its response options individually. Not only will this save you some space in your survey but it will also help respondents progress through your survey more easily. A sample matrix can be seen in Figure 12.4.

Once you have grouped similar questions together, you’ll need to think about the order in which to present those question groups. Most survey researchers agree that it is best to begin a survey with questions that will want to make respondents continue (Babbie, 2010; Dillman, 2000; Neuman, 2003). [12] In other words, don’t bore respondents, but don’t scare them away either. There’s some disagreement over where on a survey to place demographic questions, such as those about a person’s age, gender, and race. On the one hand, placing them at the beginning of the questionnaire may lead respondents to think the survey is boring, unimportant, and not something they want to bother completing. On the other hand, if your survey deals with some very sensitive topic, such as child sexual abuse or criminal convictions, you don’t want to scare respondents away or shock them by beginning with your most intrusive questions.
Your participants are human. They will react emotionally to questionnaire items, and they will also try to uncover your research questions and hypotheses. In truth, the order in which you present questions on a survey is best determined by the unique characteristics of your research. When feasible, you should consult with key informants from your target population determine how best to order your questions. If it is not feasible to do so, think about the unique characteristics of your topic, your questions, and most importantly, your sample. Keeping in mind the characteristics and needs of the people you will ask to complete your survey should help guide you as you determine the most appropriate order in which to present your questions. None of your decisions will be perfect, and all studies have limitations.
Questionnaire length
You’ll also need to consider the time it will take respondents to complete your questionnaire. Surveys vary in length, from just a page or two to a dozen or more pages, which means they also vary in the time it takes to complete them. How long to make your survey depends on several factors. First, what is it that you wish to know? Wanting to understand how grades vary by gender and year in school certainly requires fewer questions than wanting to know how people’s experiences in college are shaped by demographic characteristics, college attended, housing situation, family background, college major, friendship networks, and extracurricular activities. Keep in mind that even if your research question requires a sizable number of questions be included in your questionnaire, do your best to keep the questionnaire as brief as possible. Any hint that you’ve thrown in a bunch of useless questions just for the sake of it will turn off respondents and may make them not want to complete your survey.
Second, and perhaps more important, how long are respondents likely to be willing to spend completing your questionnaire? If you are studying college students, asking them to use their very free time to complete your survey may mean they won’t want to spend more than a few minutes on it. But if you find ask them to complete your survey during down-time between classes and there is little work to be done, students may be willing to give you a bit more of their time. Think about places and times that your sampling frame naturally gathers and whether you would be able to either recruit participants or distribute a survey in that context. Estimate how long your participants would reasonably have to complete a survey presented to them during this time. The more you know about your population (such as what weeks have less work and more free time), the better you can target questionnaire length.
The time that survey researchers ask respondents to spend on questionnaires varies greatly. Some researchers advise that surveys should not take longer than about 15 minutes to complete (as cited in Babbie 2010), [13] whereas others suggest that up to 20 minutes is acceptable (Hopper, 2010). [14] As with question order, there is no clear-cut, always-correct answer about questionnaire length. The unique characteristics of your study and your sample should be considered to determine how long to make your questionnaire. For example, if you planned to distribute your questionnaire to students in between classes, you will need to make sure it is short enough to complete before the next class begins.
When designing a questionnaire, a researcher should consider:
- Weighing strengths and limitations of the method of delivery, including the advanced tools in online survey software or the simplicity of paper questionnaires.
- Grouping together items that ask about the same thing.
- Moving any questions about sensitive items to the end of the questionnaire, so as not to scare respondents off.
- Moving any questions that engage the respondent to answer the questionnaire at the beginning, so as not to bore them.
- Timing the length of the questionnaire with a reasonable length of time you can ask of your participants.
- Dedicating time to visual design and ensure the questionnaire looks professional.
Type out a final draft of your questionnaire in a word processor or online survey tool.
- Evaluate your questionnaire using the guidelines above, revise it, and get it ready to share with other student researchers.

Pilot testing and revising questionnaires
A good way to estimate the time it will take respondents to complete your questionnaire (and other potential challenges) is through pilot testing . Pilot testing allows you to get feedback on your questionnaire so you can improve it before you actually administer it. It can be quite expensive and time consuming if you wish to pilot test your questionnaire on a large sample of people who very much resemble the sample to whom you will eventually administer the finalized version of your questionnaire. But you can learn a lot and make great improvements to your questionnaire simply by pilot testing with a small number of people to whom you have easy access (perhaps you have a few friends who owe you a favor). By pilot testing your questionnaire, you can find out how understandable your questions are, get feedback on question wording and order, find out whether any of your questions are boring or offensive, and learn whether there are places where you should have included filter questions. You can also time pilot testers as they take your survey. This will give you a good idea about the estimate to provide respondents when you administer your survey and whether you have some wiggle room to add additional items or need to cut a few items.
Perhaps this goes without saying, but your questionnaire should also have an attractive design. A messy presentation style can confuse respondents or, at the very least, annoy them. Be brief, to the point, and as clear as possible. Avoid cramming too much into a single page. Make your font size readable (at least 12 point or larger, depending on the characteristics of your sample), leave a reasonable amount of space between items, and make sure all instructions are exceptionally clear. If you are using an online survey, ensure that participants can complete it via mobile, computer, and tablet devices. Think about books, documents, articles, or web pages that you have read yourself—which were relatively easy to read and easy on the eyes and why? Try to mimic those features in the presentation of your survey questions. While online survey tools automate much of visual design, word processors are designed for writing all kinds of documents and may need more manual adjustment as part of visual design.
Realistically, your questionnaire will continue to evolve as you develop your data analysis plan over the next few chapters. By now, you should have a complete draft of your questionnaire grounded in an underlying logic that ties together each question and response option to a variable in your study. Once your questionnaire is finalized, you will need to submit it for ethical approval from your professor or the IRB. If your study requires IRB approval, it may be worthwhile to submit your proposal before your questionnaire is completely done. Revisions to IRB protocols are common and it takes less time to review a few changes to questions and answers than it does to review the entire study, so give them the whole study as soon as you can. Once the IRB approves your questionnaire, you cannot change it without their okay.
- A questionnaire is comprised of self-report measures of variables in a research study.
- Make sure your survey questions will be relevant to all respondents and that you use filter questions when necessary.
- Effective survey questions and responses take careful construction by researchers, as participants may be confused or otherwise influenced by how items are phrased.
- The questionnaire should start with informed consent and instructions, flow logically from one topic to the next, engage but not shock participants, and thank participants at the end.
- Pilot testing can help identify any issues in a questionnaire before distributing it to participants, including language or length issues.
It’s a myth that researchers work alone! Get together with a few of your fellow students and swap questionnaires for pilot testing.
- Use the criteria in each section above (questions, response options, questionnaires) and provide your peers with the strengths and weaknesses of their questionnaires.
- See if you can guess their research question and hypothesis based on the questionnaire alone.
12.4 Bias and cultural considerations
- Identify the logic behind survey design as it relates to nomothetic causal explanations and quantitative methods.
- Discuss sources of bias and error in surveys.
- Apply criticisms of survey design to ensure more equitable research.
The logic of survey design
As you may have noticed with survey designs, everything about them is intentional—from the delivery method, to question wording, to what response options are offered. It’s helpful to spell out the underlying logic behind survey design and how well it meets the criteria for nomothetic causal explanations. Because we are trying to isolate the causal relationship between our dependent and independent variable, we must try to control for as many possible confounding factors as possible. Researchers using survey design do this in multiple ways:
- Using well-established, valid, and reliable measures of key variables, including triangulating variables using multiple measures
- Measuring control variables and including them in their statistical analysis
- Avoiding biased wording, presentation, or procedures that might influence the sample to respond differently
- Pilot testing questionnaires, preferably with people similar to the sample
In other words, survey researchers go through a lot of trouble to make sure they are not the ones causing the changes they observe in their study. Of course, every study falls a little short of this ideal bias-free design, and some studies fall far short of it. This section is all about how bias and error can inhibit the ability of survey results to meaningfully tell us about causal relationships in the real world.
Bias in questionnaires, questions, and response options
The use of surveys is based on methodological assumptions common to research in the postpositivist paradigm. Figure 12.5 presents a model the methodological assumptions behind survey design—what researchers assume is the cognitive processes that people engage in when responding to a survey item (Sudman, Bradburn, & Schwarz, 1996) . [15] Respondents must interpret the question, retrieve relevant information from memory, form a tentative judgment, convert the tentative judgment into one of the response options provided (e.g., a rating on a 1-to-7 scale), and finally edit their response as necessary.

Consider, for example, the following questionnaire item:
- How many alcoholic drinks do you consume in a typical day?
- a lot more than average
- somewhat more than average
- somewhat fewer than average
- a lot fewer than average
Although this item at first seems straightforward, it poses several difficulties for respondents. First, they must interpret the question. For example, they must decide whether “alcoholic drinks” include beer and wine (as opposed to just hard liquor) and whether a “typical day” is a typical weekday, typical weekend day, or both . Even though Chang and Krosnick (2003) [16] found that asking about “typical” behavior has been shown to be more valid than asking about “past” behavior, their study compared “typical week” to “past week” and may be different when considering typical weekdays or weekend days) .
Once respondents have interpreted the question, they must retrieve relevant information from memory to answer it. But what information should they retrieve, and how should they go about retrieving it? They might think vaguely about some recent occasions on which they drank alcohol, they might carefully try to recall and count the number of alcoholic drinks they consumed last week, or they might retrieve some existing beliefs that they have about themselves (e.g., “I am not much of a drinker”). Then they must use this information to arrive at a tentative judgment about how many alcoholic drinks they consume in a typical day. For example, this mental calculation might mean dividing the number of alcoholic drinks they consumed last week by seven to come up with an average number per day. Then they must format this tentative answer in terms of the response options actually provided. In this case, the options pose additional problems of interpretation. For example, what does “average” mean, and what would count as “somewhat more” than average? Finally, they must decide whether they want to report the response they have come up with or whether they want to edit it in some way. For example, if they believe that they drink a lot more than average, they might not want to report that for fear of looking bad in the eyes of the researcher, so instead, they may opt to select the “somewhat more than average” response option.
At first glance, this question is clearly worded and includes a set of mutually exclusive, exhaustive, and balanced response options. However, it is difficult to follow the logic of what is truly being asked. Again, this complexity can lead to unintended influences on respondents’ answers. Confounds like this are often referred to as context effects because they are not related to the content of the item but to the context in which the item appears (Schwarz & Strack, 1990) . [17] For example, there is an item-order effect when the order in which the items are presented affects people’s responses. One item can change how participants interpret a later item or change the information that they retrieve to respond to later items. For example, researcher Fritz Strack and his colleagues asked college students about both their general life satisfaction and their dating frequency (Strack, Martin, & Schwarz, 1988) . [18] When the life satisfaction item came first, the correlation between the two was only −.12, suggesting that the two variables are only weakly related. But when the dating frequency item came first, the correlation between the two was +.66, suggesting that those who date more have a strong tendency to be more satisfied with their lives. Reporting the dating frequency first made that information more accessible in memory so that they were more likely to base their life satisfaction rating on it.
The response options provided can also have unintended effects on people’s responses (Schwarz, 1999) . [19] For example, when people are asked how often they are “really irritated” and given response options ranging from “less than once a year” to “more than once a month,” they tend to think of major irritations and report being irritated infrequently. But when they are given response options ranging from “less than once a day” to “several times a month,” they tend to think of minor irritations and report being irritated frequently. People also tend to assume that middle response options represent what is normal or typical. So if they think of themselves as normal or typical, they tend to choose middle response options (i.e., fence-sitting). For example, people are likely to report watching more television when the response options are centered on a middle option of 4 hours than when centered on a middle option of 2 hours. To mitigate against order effects, rotate questions and response items when there is no natural order. Counterbalancing or randomizing the order of presentation of the questions in online surveys are good practices for survey questions and can reduce response order effects that show that among undecided voters, the first candidate listed in a ballot receives a 2.5% boost simply by virtue of being listed first! [20]
Other context effects that can confound the causal relationship under examination in a survey include social desirability bias, recall bias, and common method bias. As we discussed in Chapter 11 , s ocial desirability bias occurs when we create questions that lead respondents to answer in ways that don’t reflect their genuine thoughts or feelings to avoid being perceived negatively. With negative questions such as, “do you think that your project team is dysfunctional?”, “is there a lot of office politics in your workplace?”, or “have you ever illegally downloaded music files from the Internet?”, the researcher may not get truthful responses. This tendency among respondents to “spin the truth” in order to portray themselves in a socially desirable manner is called social desirability bias, which hurts the validity of responses obtained from survey research. There is practically no way of overcoming social desirability bias in a questionnaire survey outside of wording questions using nonjudgmental language. However, in a quantitative interview, a researcher may be able to spot inconsistent answers and ask probing questions or use personal observations to supplement respondents’ comments.
As you can see, participants’ responses to survey questions often depend on their motivation, memory, and ability to respond. Particularly when dealing with events that happened in the distant past, respondents may not adequately remember their own motivations or behaviors, or perhaps their memory of such events may have evolved with time and are no longer retrievable. This phenomenon is know as recall bias . For instance, if a respondent is asked to describe their utilization of computer technology one year ago, their response may not be accurate due to difficulties with recall. One possible way of overcoming the recall bias is by anchoring the respondent’s memory in specific events as they happened, rather than asking them to recall their perceptions and motivations from memory.
Cross-sectional and retrospective surveys are particularly vulnerable to recall bias as well as common method bias. Common method bias can occur when measuring both independent and dependent variables at the same time (like a cross-section survey) and using the same instrument (like a questionnaire). In such cases, the phenomenon under investigation may not be adequately separated from measurement artifacts. Standard statistical tests are available to test for common method bias, such as Harmon’s single-factor test (Podsakoff et al. 2003), [21] , Lindell and Whitney’s (2001) [22] market variable technique, and so forth. This bias can be potentially avoided if the independent and dependent variables are measured at different points in time, using a longitudinal survey design, or if these variables are measured using different data sources, such as medical or student records rather than self-report questionnaires.

Bias in recruitment and response to surveys
So far, we have discussed errors that researchers make when they design questionnaires that accidentally influence participants to respond one way or another. However, even well designed questionnaires can produce biased results when administered to survey respondents because of the biases in who actually responds to your survey.
Survey research is notorious for its low response rates. A response rate of 15-20% is typical in a mail survey, even after two or three reminders. If the majority of the targeted respondents fail to respond to a survey, then a legitimate concern is whether non-respondents are not responding due to a systematic reason, which may raise questions about the validity and generalizability of the study’s results, especially as this relates to the representativeness of the sample. This is known as non-response bias . For instance, dissatisfied customers tend to be more vocal about their experience than satisfied customers, and are therefore more likely to respond to satisfaction questionnaires. Hence, any respondent sample is likely to have a higher proportion of dissatisfied customers than the underlying population from which it is drawn. [23] In this instance, the results would not be generalizable beyond this one biased sample. Here are several strategies for addressing non-response bias:
- Advance notification: A short letter sent in advance to the targeted respondents soliciting their participation in an upcoming survey can prepare them and improve likelihood of response. The letter should state the purpose and importance of the study, mode of data collection (e.g., via a phone call, a survey form in the mail, etc.), and appreciation for their cooperation. A variation of this technique may request the respondent to return a postage-paid postcard indicating whether or not they are willing to participate in the study.
- Ensuring that content is relevant: If a survey examines issues of relevance or importance to respondents, then they are more likely to respond.
- Creating a respondent-friendly questionnaire: Shorter survey questionnaires tend to elicit higher response rates than longer questionnaires. Furthermore, questions that are clear, inoffensive, and easy to respond to tend to get higher response rates.
- Having the project endorsed: For organizational surveys, it helps to gain endorsement from a senior executive attesting to the importance of the study to the organization. Such endorsements can be in the form of a cover letter or a letter of introduction, which can improve the researcher’s credibility in the eyes of the respondents.
- Providing follow-up requests: Multiple follow-up requests may coax some non-respondents to respond, even if their responses are late.
- Ensuring that interviewers are properly trained: Response rates for interviews can be improved with skilled interviewers trained on how to request interviews, use computerized dialing techniques to identify potential respondents, and schedule callbacks for respondents who could not be reached.
- Providing incentives: Response rates, at least with certain populations, may increase with the use of incentives in the form of cash or gift cards, giveaways such as pens or stress balls, entry into a lottery, draw or contest, discount coupons, the promise of contribution to charity, and so forth.
- Providing non-monetary incentives: Organizations in particular are more prone to respond to non-monetary incentives than financial incentives. An example of such a non-monetary incentive sharing trainings and other resources based on the results of a project with a key stakeholder.
- Making participants fully aware of confidentiality and privacy: Finally, assurances that respondents’ private data or responses will not fall into the hands of any third party may help improve response rates.
Nonresponse bias impairs the ability of the researcher to generalize from the total number of respondents in the sample to the overall sampling frame. Of course, this assumes that the sampling frame is itself representative and generalizable to the larger target population. Sampling bias is present when the people in our sampling frame or the approach we use to sample them results in a sample that does not represent our population in some way. Telephone surveys conducted by calling a random sample of publicly available telephone numbers will systematically exclude people with unlisted telephone numbers, mobile phone numbers, and will include a disproportionate number of respondents who have land-line telephone service and stay home during much of the day, such as people who are unemployed, disabled, or of advanced age. Likewise, online surveys tend to include a disproportionate number of students and younger people who are more digitally connected, and systematically exclude people with limited or no access to computers or the Internet, such as the poor and the elderly. A different kind of sampling bias relates to generalizing from key informants to a target population, such as asking teachers (or parents) about the academic learning of their students (or children) or asking CEOs about operational details in their company. These sampling frames may provide a clearer picture of what key informants think and feel, rather than the target population.

Cultural bias
The acknowledgement that most research in social work and other adjacent fields is overwhelmingly based on so-called WEIRD (Western, educated, industrialized, rich and democratic) populations—a topic we discussed in Chapter 10 —has given way to intensified research funding, publication, and visibility of collaborative cross-cultural studies across the social sciences that expand the geographical range of study populations. Many of the so-called non-WEIRD communities who increasingly participate in research are Indigenous, from low- and middle-income countries in the global South, live in post-colonial contexts, and/or are marginalized within their political systems, revealing and reproducing power differentials between researchers and researched (Whiteford & Trotter, 2008). [24] Cross-cultural research has historically been rooted in racist, capitalist ideas and motivations (Gordon, 1991). [25] Scholars have long debated whether research aiming to standardize cross-cultural measurements and analysis is tacitly engaged and/or continues to be rooted in colonial and imperialist practices (Kline et al., 2018; Stearman, 1984). [26] Given this history, it is critical that scientists reflect upon these issues and be accountable to their participants and colleagues for their research practices. We argue that cross-cultural research be grounded in the recognition of the historical, political, sociological and cultural forces acting on the communities and individuals of focus. These perspectives are often contrasted with ‘science’; here we argue that they are necessary as a foundation for the study of human behavior.
We stress that our goal is not to review the literature on colonial or neo-colonial research practices, to provide a comprehensive primer on decolonizing approaches to field research, nor to identify or admonish past harms in these respects—harms to which many of the authors of this piece would readily admit. Furthermore, we acknowledge that we ourselves are writing from a place of privilege as researchers educated and trained in disciplines with colonial pasts. Our goal is simply to help students understand the broader issues in cross-cultural studies for appropriate consideration of diverse communities and culturally appropriate methodologies for student research projects.
Equivalence of measures across cultures
Data collection methods largely stemming from WEIRD intellectual traditions are being exported to a range of cultural contexts. This is often done with insufficient consideration of the translatability (e.g. equivalence or applicability) or implementation of such concepts and methods in different contexts, as already well documented (e.g., Hruschka et al., 2018). [27] For example, in a developmental psychology study conducted by Broesch and colleagues (2011), [28] the research team exported a task to examine the development and variability of self-recognition in children across cultures. Typically, this milestone is measured by surreptitiously placing a mark on a child’s forehead and allowing them to discover their reflective image and the mark in a mirror. While self-recognition in WEIRD contexts typically manifests in children by 18 months of age, the authors tested found that only 2 out of 82 children (aged 1–6 years) ‘passed’ the test by removing the mark using the reflected image. The authors’ interpretation of these results was that the test produced false negatives and instead measured implicit compliance to the local authority figure who placed the mark on the child. This raises the possibility that the mirror test may lack construct validity in cross-cultural contexts—in other words, that it may not measure the theoretical construct it was designed to measure.
As we discussed previously, survey researchers want to make sure everyone receives the same questionnaire, but how can we be sure everyone understands the questionnaire in the same way? Cultural equivalence means that a measure produces comparable data when employed in different cultural populations (Van de Vijver & Poortinga, 1992). [29] If concepts differ in meaning across cultures, cultural bias may better explain what is going on with your key variables better than your hypotheses. Cultural bias may result because of poor item translation, inappropriate content of items, and unstandardized procedures (Waltz et al., 2010). [30] Of particular importance is construct bias , or “when the construct measured is not identical across cultures or when behaviors that characterize the construct are not identical across cultures” (Meiring et al., 2005, p. 2) [31] Construct bias emerges when there is: a) disagreement about the appropriateness of content, b) inadequate sampling, c) underrepresentation of the construct, and d) incomplete overlap of the construct across cultures (Van de Vijver & Poortinga, 1992). [32]
Addressing cultural bias
To address these issues, we propose that careful scrutiny of (a) study site selection, (b) community involvement and (c) culturally appropriate research methods. Particularly for those initiating collaborative cross-cultural projects, we focus here on pragmatic and implementable steps. For student researchers, it is important to be aware of these issues and assess for them in the strengths and limitations of your own study, though the degree to which you can feasibly implement some of these measures will be impaired by a lack of resources.
Study site selection
Researchers are increasingly interested in cross-cultural research applicable outside of WEIRD contexts., but this has sometimes led to an uncritical and haphazard inclusion of ‘non-WEIRD’ populations in cross-cultural research without further regard for why specific populations should be included (Barrett, 2020). [33] One particularly egregious example is the grouping of all non-Western populations as a comparative sample to the cultural West (i.e. the ‘West versus rest’ approach) is often unwittingly adopted by researchers performing cross-cultural research (Henrich, 2010). [34] Other researcher errors include the exoticization of particular cultures or viewing non-Western cultures as a window into the past rather than cultures that have co-evolved over time.
Thus, some of the cultural biases in survey research emerge when researchers fail to identify a clear theoretical justification for inclusion of any subpopulation—WEIRD or not—based on knowledge of the relevant cultural and/or environmental context (see Tucker, 2017 [35] for a good example). For example, a researcher asking about satisfaction with daycare must acquire the relevant cultural and environmental knowledge about a daycare that caters exclusively to Orthodox Jewish families. Simply including this study site without doing appropriate background research and identifying a specific aspect of this cultural group that is of theoretical interest in your study (e.g., spirituality and parenthood) indicates a lack of rigor in research. It undercuts the validity and generalizability of your findings by introducing sources of cultural bias that are unexamined in your study.
Sampling decisions are also important as they involve unique ethical and social challenges. For example, foreign researchers (as sources of power, information and resources) represent both opportunities for and threats to community members. These relationships are often complicated by power differentials due to unequal access to wealth, education and historical legacies of colonization. As such, it is important that investigators are alert to the possible bias among individuals who initially interact with researchers, to the potential negative consequences for those excluded, and to the (often unspoken) power dynamics between the researcher and their study participants (as well as among and between study participants).
We suggest that a necessary first step is to carefully consult existing resources outlining best practices for ethical principles of research before engaging in cross-cultural research. Many of these resources have been developed over years of dialogue in various academic and professional societies (e.g. American Anthropological Association, International Association for Cross Cultural Psychology, International Union of Psychological Science). Furthermore, communities themselves are developing and launching research-based codes of ethics and providing carefully curated open-access materials such as those from the Indigenous Peoples’ Health Research Centre , often written in consultation with ethicists in low- to middle-income countries (see Schroeder et al., 2019 ). [36]
Community involvement
Too often researchers engage in ‘extractive’ research, whereby a researcher selects a study community and collects the necessary data to exclusively further their own scientific and/or professional goals without benefiting the community. This reflects a long history of colonialism in social science. Extractive methods lead to methodological flaws and alienate participants from the scientific process, poisoning the well of scientific knowledge on a macro level. Many researchers are associated with institutions tainted with colonial, racist and sexist histories, sentiments and in some instances perpetuating into the present. Much cross-cultural research is carried out in former or contemporary colonies, and in the colonial language. Explicit and implicit power differentials create ethical challenges that can be acknowledged by researchers and in the design of their study (see Schuller, 2010 [37] for an example in which the power and politics of various roles played by researchers).
An understanding of cultural norms may ensure that data collection and questionnaire design are culturally and linguistically relevant. This can be achieved by implementing several complementary strategies. A first step may be to collaborate with members of the study community to check the relevance of the instruments being used. Incorporating perspectives from the study community from the outset can reduce the likelihood of making scientific errors in measurement and inference (First Nations Information Governance Centre, 2014). [38]
An additional approach is to use mixed methods in data collection, such that each method ‘checks’ the data collected using the other methods. A recent paper by Fisher and Poortinga (2018) [39] provides suggestions for a rigorous methodological approach to conducting cross-cultural comparative psychology, underscoring the importance of using multiple methods with an eye towards a convergence of evidence. A mixed-method approach can incorporate a variety of qualitative methods over and on top of a quantitative survey including open-ended questions, focus groups, and interviews.
Research design and methods
It is critical that researchers translate the language, technological references and stimuli as well as examine the underlying cultural context of the original method for assumptions that rely upon WEIRD epistemologies (Hrushcka, 2020). [40] This extends to non-complex visual aids, attempting to ensure that even scales measure what the researcher is intending (see Purzycki and Lang, 2019 [41] for discussion on the use of a popular economic experiment in small-scale societies).
For more information on assessing cultural equivalence, consult this free training from RTI International, a well-regarded non-profit research firm, entitled “ The essential role of language in survey design ” and this free training from the Center for Capacity Building in Survey Methods and Statistics entitled “ Questionnaire design: For surveys in 3MC (multinational, multiregional, and multi cultural) contexts . These trainings guide researchers using survey design through the details of evaluating and writing survey questions using culturally sensitive language. Moreover, if you are planning to conduct cross-cultural research, you should consult this guide for assessing measurement equivalency and bias across cultures , as well.
- Bias can come from both how questionnaire items are presented to participants as well as how participants are recruited and respond to surveys.
- Cultural bias emerges from the differences in how people think and behave across cultures.
- Cross-cultural research requires a theoretically-informed sampling approach, evaluating measurement equivalency across cultures, and generalizing findings with caution.
Review your questionnaire and assess it for potential sources of bias.
- Include the results of pilot testing from the previous exercise.
- Make any changes to your questionnaire (or sampling approach) you think would reduce the potential for bias in your study.
Create a first draft of your limitations section by identifying sources of bias in your survey.
- Write a bulleted list or paragraph or the potential sources of bias in your study.
- Remember that all studies, especially student-led studies, have limitations. To the extent you can address these limitations now and feasibly make changes, do so. But keep in mind that your goal should be more to correctly describe the bias in your study than to collect bias-free results. Ultimately, your study needs to get done!
- Unless researchers change the order of questions as part of their methodology and ensuring accurate responses to questions ↵
- Not that there are any personal vendettas I'm aware of in academia...everyone gets along great here... ↵
- Blackstone, A. (2013). Harassment of older adults in the workplace. In P. Brownell & J. J. Kelly (eds.) Ageism and mistreatment of older workers . Springer ↵
- Smith, T. W. (2009). Trends in willingness to vote for a Black and woman for president, 1972–2008. GSS Social Change Report No. 55 . Chicago, IL: National Opinion Research Center ↵
- Enriquez , L. E., Rosales , W. E., Chavarria, K., Morales Hernandez, M., & Valadez, M. (2021). COVID on Campus: Assessing the Impact of the Pandemic on Undocumented College Students. AERA Open. https://doi.org/10.1177/23328584211033576 ↵
- Mortimer, J. T. (2003). Working and growing up in America . Cambridge, MA: Harvard University Press. ↵
- Lindert, J., Lee, L. O., Weisskopf, M. G., McKee, M., Sehner, S., & Spiro III, A. (2020). Threats to Belonging—Stressful Life Events and Mental Health Symptoms in Aging Men—A Longitudinal Cohort Study. Frontiers in psychiatry , 11 , 1148. ↵
- Kleschinsky, J. H., Bosworth, L. B., Nelson, S. E., Walsh, E. K., & Shaffer, H. J. (2009). Persistence pays off: follow-up methods for difficult-to-track longitudinal samples. Journal of studies on alcohol and drugs , 70 (5), 751-761. ↵
- Silver, N. (2021, March 25). The death of polling is greatly exaggerated. FiveThirtyEight . Retrieved from: https://fivethirtyeight.com/features/the-death-of-polling-is-greatly-exaggerated/ ↵
- Babbie, E. (2010). The practice of social research (12th ed.). Belmont, CA: Wadsworth. ↵
- Peterson, R. A. (2000). Constructing effective questionnaires . Thousand Oaks, CA: Sage. ↵
- Babbie, E. (2010). The practice of social research (12th ed.). Belmont, CA: Wadsworth; Dillman, D. A. (2000). Mail and Internet surveys: The tailored design method (2nd ed.). New York, NY: Wiley; Neuman, W. L. (2003). Social research methods: Qualitative and quantitative approaches (5th ed.). Boston, MA: Pearson. ↵
- Babbie, E. (2010). The practice of social research (12th ed.). Belmont, CA: Wadsworth. ↵
- Hopper, J. (2010). How long should a survey be? Retrieved from http://www.verstaresearch.com/blog/how-long-should-a-survey-be ↵
- Sudman, S., Bradburn, N. M., & Schwarz, N. (1996). Thinking about answers: The application of cognitive processes to survey methodology . San Francisco, CA: Jossey-Bass. ↵
- Chang, L., & Krosnick, J.A. (2003). Measuring the frequency of regular behaviors: Comparing the ‘typical week’ to the ‘past week’. Sociological Methodology, 33 , 55-80. ↵
- Schwarz, N., & Strack, F. (1990). Context effects in attitude surveys: Applying cognitive theory to social research. In W. Stroebe & M. Hewstone (Eds.), European review of social psychology (Vol. 2, pp. 31–50). Chichester, UK: Wiley. ↵
- Strack, F., Martin, L. L., & Schwarz, N. (1988). Priming and communication: The social determinants of information use in judgments of life satisfaction. European Journal of Social Psychology, 18 , 429–442. ↵
- Schwarz, N. (1999). Self-reports: How the questions shape the answers. American Psychologist, 54 , 93–105. ↵
- Miller, J.M. & Krosnick, J.A. (1998). The impact of candidate name order on election outcomes. Public Opinion Quarterly, 62 (3), 291-330. ↵
- Podsakoff, P. M., MacKenzie, S. B., Lee, J. Y., & Podsakoff, N. P. (2003). Common method biases in behavioral research: a critical review of the literature and recommended remedies. Journal of Applied Psychology, 88 (5), 879. ↵
- Lindell, M. K., & Whitney, D. J. (2001). Accounting for common method variance in cross-sectional research designs. Journal of Applied Psychology, 86 (1), 114. ↵
- This is why my ratemyprofessor.com score is so low. Or that's what I tell myself. ↵
- Whiteford, L. M., & Trotter II, R. T. (2008). Ethics for anthropological research and practice . Waveland Press. ↵
- Gordon, E. T. (1991). Anthropology and liberation. In F V Harrison (ed.) Decolonizing anthropology: Moving further toward an anthropology for liberation (pp. 149-167). Arlington, VA: American Anthropological Association. ↵
- Kline, M. A., Shamsudheen, R., & Broesch, T. (2018). Variation is the universal: Making cultural evolution work in developmental psychology. Philosophical Transactions of the Royal Society B: Biological Sciences , 373 (1743), 20170059. Stearman, A. M. (1984). The Yuquí connection: Another look at Sirionó deculturation. American Anthropologist , 86 (3), 630-650. ↵
- Hruschka, D. J., Munira, S., Jesmin, K., Hackman, J., & Tiokhin, L. (2018). Learning from failures of protocol in cross-cultural research. Proceedings of the National Academy of Sciences , 115 (45), 11428-11434. ↵
- Broesch, T., Callaghan, T., Henrich, J., Murphy, C., & Rochat, P. (2011). Cultural variations in children’s mirror self-recognition. Journal of Cross-Cultural Psychology , 42 (6), 1018-1029. ↵
- Van de Vijver, F. J., & Poortinga, Y. H. (1992). Testing in culturally heterogeneous populations: When are cultural loadings undesirable?. European Journal of Psychological Assessment . ↵
- Waltz, C. F., Strickland, O. L., & Lenz, E. R. (Eds.). (2010). Measurement in nursing and health research (4th ed.) . Springer. ↵
- Meiring, D., Van de Vijver, A. J. R., Rothmann, S., & Barrick, M. R. (2005). Construct, item and method bias of cognitive and personality tests in South Africa. SA Journal of Industrial Psychology , 31 (1), 1-8. ↵
- Van de Vijver, F. J., & Poortinga, Y. H. (1992). Testing in culturally heterogeneous populations: When are cultural loadings undesirable?. European Journal of Psychological Assessment . ↵
- Barrett, H. C. (2020). Deciding what to observe: Thoughts for a post-WEIRD generation. Evolution and Human Behavior , 41 (5), 445-453. ↵
- Henrich, J., Heine, S. J., & Norenzayan, A. (2010). Beyond WEIRD: Towards a broad-based behavioral science. Behavioral and Brain Sciences , 33 (2-3), 111. ↵
- Tucker, B. (2017). From risk and time preferences to cultural models of causality: on the challenges and possibilities of field experiments, with examples from rural Southwestern Madagascar. Impulsivity , 61-114. ↵
- Schroeder, D., Chatfield, K., Singh, M., Chennells, R., & Herissone-Kelly, P. (2019). Equitable research partnerships: a global code of conduct to counter ethics dumping . Springer Nature. ↵
- Schuller, M. (2010). From activist to applied anthropologist to anthropologist? On the politics of collaboration. Practicing Anthropology , 32 (1), 43-47. ↵
- First Nations Information Governance Centre. (2014). Ownership, control, access and possession (OCAP): The path to First Nations information governance. ↵
- Fischer, R., & Poortinga, Y. H. (2018). Addressing methodological challenges in culture-comparative research. Journal of Cross-Cultural Psychology , 49 (5), 691-712. ↵
- Hruschka, D. J. (2020). What we look with” is as important as “What we look at. Evolution and Human Behavior , 41 (5), 458-459. ↵
- Purzycki, B. G., & Lang, M. (2019). Identity fusion, outgroup relations, and sacrifice: a cross-cultural test. Cognition , 186 , 1-6. ↵
The use of questionnaires to gather data from multiple participants.
the group of people you successfully recruit from your sampling frame to participate in your study
A research instrument consisting of a set of questions (items) intended to capture responses from participants in a standardized manner
Refers to research that is designed specifically to answer the question of whether there is a causal relationship between two variables.
A measure of a participant's condition before they receive an intervention or treatment.
A measure of a participant's condition after an intervention or, if they are part of the control/comparison group, at the end of an experiment.
a participant answers questions about themselves
the entities that a researcher actually observes, measures, or collects in the course of trying to learn something about her unit of analysis (individuals, groups, or organizations)
entity that a researcher wants to say something about at the end of her study (individual, group, or organization)
whether you can practically and ethically complete the research project you propose
Someone who is especially knowledgeable about a topic being studied.
a person who completes a survey on behalf of another person
In measurement, conditions that are subtle and complex that we must use existing knowledge and intuition to define.
The ability of a measurement tool to measure a phenomenon the same way, time after time. Note: Reliability does not imply validity.
study publicly available information or data that has been collected by another person
When a researcher collects data only once from participants using a questionnaire
Researcher collects data from participants at multiple points over an extended period of time using a questionnaire.
A type of longitudinal survey where the researchers gather data at multiple times, but each time they ask different people from the group they are studying because their concern is capturing the sentiment of the group, not the individual people they survey.
A questionnaire that is distributed to participants (in person, by mail, virtually) to complete independently.
A questionnaire that is read to respondents
when a researcher administers a questionnaire verbally to participants
any possible changes in interviewee responses based on how or when the researcher presents question-and-answer options
Triangulation of data refers to the use of multiple types, measures or sources of data in a research project to increase the confidence that we have in our findings.
Testing out your research materials in advance on people who are not included as participants in your study.
items on a questionnaire designed to identify some subset of survey respondents who are asked additional questions that are not relevant to the entire sample
a question that asks more than one thing at a time, making it difficult to respond accurately
When a participant answers in a way that they believe is socially the most acceptable answer.
the answers researchers provide to participants to choose from when completing a questionnaire
questions in which the researcher provides all of the response options
Questions for which the researcher does not include response options, allowing for respondents to answer the question in their own words
respondents to a survey who choose neutral response options, even if they have an opinion
respondents to a survey who choose a substantive answer to a question when really, they don’t understand the question or don’t have an opinion
An ordered outline that includes your research question, a description of the data you are going to use to answer it, and the exact analyses, step-by-step, that you plan to run to answer your research question.
A process through which the researcher explains the research process, procedures, risks and benefits to a potential participant, usually through a written document, which the participant than signs, as evidence of their agreement to participate.
a type of survey question that lists a set of questions for which the response options are all the same in a grid layout
unintended influences on respondents’ answers because they are not related to the content of the item but to the context in which the item appears.
when the order in which the items are presented affects people’s responses
Social desirability bias occurs when we create questions that lead respondents to answer in ways that don't reflect their genuine thoughts or feelings to avoid being perceived negatively.
When respondents have difficult providing accurate answers to questions due to the passage of time.
Common method bias refers to the amount of spurious covariance shared between independent and dependent variables that are measured at the same point in time.
If the majority of the targeted respondents fail to respond to a survey, then a legitimate concern is whether non-respondents are not responding due to a systematic reason, which may raise questions about the validity of the study’s results, especially as this relates to the representativeness of the sample.
Sampling bias is present when our sampling process results in a sample that does not represent our population in some way.
the concept that scores obtained from a measure are similar when employed in different cultural populations
spurious covariance between your independent and dependent variables that is in fact caused by systematic error introduced by culturally insensitive or incompetent research practices
"when the construct measured is not identical across cultures or when behaviors that characterize the construct are not identical across cultures" (Meiring et al., 2005, p. 2)
Graduate research methods in social work Copyright © 2021 by Matthew DeCarlo, Cory Cummings, Kate Agnelli is licensed under a Creative Commons Attribution-NonCommercial-ShareAlike 4.0 International License , except where otherwise noted.
Share This Book

Want to create or adapt books like this? Learn more about how Pressbooks supports open publishing practices.
21 12. Survey design
Chapter outline.
- What is survey research? (15 minute read time)
- Conducting a survey (18 minute read time)
- Creating a questionnaire (16 minute read time)
- Strengths and challenges of survey research (11 minute read time)
Content warning: examples in this chapter contain references to racial inequity, mental health treatment/symptoms/diagnosis, sex work, burnout and compassion fatigue, involuntary hospitalization, terrorism, religious beliefs and attitudes, drug use, physical (chronic) pain, workplace experience and discrimination.
12.1 What is survey research?
Learning Objectives
Learners will be able to…
- Demonstrate an understanding of survey research as a type of research design
- Think about the potential uses of survey research in their student research project
Surveys are a type of design
Congratulations! Your knowledge of social work research project has evolved. You have learned new terminology and the processes needed to develop good questions and to select the best measurement tools to answer your questions. Now, we will the transition to a discussion on research design.
We are in Part 3: Using quantitative methods of this research text; therefore, the first designs we will discuss are those that focus on collecting data for quantitative analysis. The first design we will discuss is survey design. Note: It is important to remember that even though survey design is featured in the quantitative methods section of this text, survey design research may also be used to collect qualitative data or a combination of both qualitative and quantitative data. In about six chapters from now, the following section of the text, Part 4: Qualitative Methods, will provide a more detailed focus on collecting qualitative data.
So, what do we mean when we use the term “research design?” When we think of research designs, we are thinking about an overall strategy or approach used to conduct research projects. [1] This chapter discusses survey design which involves strategies for conducting research that utilize a set of questions (contained in a questionnaire) to gain specific information from participants about their opinions, perceptions, reactions, knowledge, beliefs, values, or behaviors.

Caution: It is important to preface this chapter with a statement about the distinction between a questionnaire and survey design. Most people use these definitions interchangeably; however, they are quite different. The term “survey” is used in research design and involves asking questions and collecting and using tools to analyze data. [2] Specifically, the term “survey” denotes the overall strategy or approach to answering questions. Conversely, the term questionnaire is the actual tool that collects data. So, in essence, researchers use a questionnaire to engage in survey research. This chapter will teach you how to employ a research approach that uses questionnaires to collect information.
The good news is that we have all been exposed to survey research. At the end of the semester when you complete your course evaluations, you are engaging in survey research. If you have ever completed any type of satisfaction questionnaire, you have completed survey research. In fact, every ten years, a random selection of individuals living in the United States are asked to participate in a large-scale survey research project that is conducted by the United States Census Bureau. So, survey research is widespread and familiar to many people, even those who do not have a formal understanding of research terminology.
This section further defines elements of survey research and provides an overview of the characteristics that distinguish survey research from other types of research. As you read this section, please think about your research project and how survey research might be used to help you answer your research question.

Survey research is frequently employed by social work researchers because we often seek to develop an understanding of how groups of people, communities, organizations, and population feel about a certain topic. Social workers might seek to gather survey data from:
- Neighborhood residents
- People who possess certain characteristics or experiences
- Family members or people affected by a particular condition or experience
- Staff at an agency
- Service recipients
- The general public
- People with specialized knowledge in a given area
- Members of an organization or group
As you think about your research topic, you will likely select one (or maybe two) of these viewpoints to survey as you collect your data. However, it can be helpful to think about how these various perspectives might contribute to research in your given area. As a thought activity, try to fill out as many examples as you can of who you might consider collecting survey data from for your topic.
For example, suppose I am interested in researching the topic of perceptions of racial inequity.
- Neighborhood residents: I could survey two different neighborhoods, one that is more racial diverse and one that is more racially similar (homogenous)
- People who possess certain characteristics or experiences: I could specifically survey people who are part of an interracial family
- Family members or people affected by a particular condition or experience: I could survey people who have a loved one that has been incarcerated
- Staff at an agency: I could survey staff from agencies that serve predominately communities of color, but where the agency staff makeup is predominately white
- Service recipients: I could survey service recipients from agencies that serve predominately communities of color, but where the agency staff makeup is predominately white
- The general public: I could survey people at a large local shopping mall
- People with specialized knowledge in a given area: I could survey state legislators
- Members of an organization or group: I could survey members of racial justice advocacy organizations
These are just a small sample of groups that could be surveyed. For each category, we could go in many different directions with many perspectives that can make valuable contributions to this topic. That is what makes research so exciting…the possibilities are limitless!
Characteristics of survey research
Quite simply, survey research is a type of research design that has two important characteristics. First, the variables of interest are measured using self-reports. These self-reports are gathered by questionnaires, either completed independently by a participant or administered by a member of a research team. Researchers ask their participants , the people who have opted to participate in the research, to report directly on their own thoughts, feelings, and behaviors. Second, often survey research is conducted to understand something about a larger population; remember, this is known as generalizing results. Consequently, considerable attention is paid to the type of sampling and the number of cases used. In general, researchers using a survey design have a preference for large randomly selected samples because they provide the most accurate estimates of what is true in the population.
In previous chapters, we learned about the purposes of research ( exploratory , descriptive , and explanatory ). Survey research can be used for all of these types of research; however, it may be a little challenging to use with exploratory research. Why? The purpose of exploratory research is to uncover experiences in which little is known. Therefore, you may lack the knowledge base needed to develop your questionnaire.
Survey research is best suited for studies that have individual people as the unit of analysis . However, other units of analysis, such as families, groups, organizations, or communities may also be used in survey research. If researchers use a family, group, organization, or community as the unit of analysis, they usually denote a specific person who is identified as a key informant or a “proxy” to complete the actual research tool. Researchers must be intentional with these choices, as they may introduce measurement error if the informant chosen does not have adequate knowledge or has a biased opinion about the phenomenon of interest.
For instance, many schools of social work are very interested in the school of social work rankings that are published annually by US News and World Report. For a full description of the methodology used in this process, please visit https://www.usnews.com/education/best-colleges/articles/how-us-news-calculated-the-rankings. Many students are not aware that these rankings are actually composite scores created by analyzing a variety of data sources. One type of data used in this process is known as peer review data, or data in which schools provide feedback on their perceptions of similar schools. A questionnaire is sent to several key informants at each school. Each key informant is asked to rank the other schools of social work on a variety of dimensions. These data are then collected and combined with other indicators to calculate the school rankings. However, what if an informant is unfamiliar with a school or has a personal bias against a school? This could significantly skew results. In summary, if you are not using individuals as the unit of analysis, it is important that you choose the right key informant who is knowledgeable about the topic of which you are asking, and who can provide an unbiased perspective.
Finally, most survey research is used to describe single variables (e.g., voter preferences, motivation, or social support) and to assess statistical relationships between variables (e.g., the relationship between income and health). For instance, Nesje (2016) used a survey design to understand the relationship between profession and personality traits. The author was interested in studying the relationship between two variables, personality (empathy and care) and selected profession (social work, nursing, or education). Specifically, Nesje sought to understand if a certain field of study had practitioners with higher levels of empathy and care than others. The author administered two tools, the Blau’s Career Commitment Scale and Orlinsky and Rønnestad’s Interpersonal Adjective Scale, to 1,765 students. Results failed to find a statistically significant difference between groups on the levels of empathy and care. [3]
The above example illustrates several characteristics of a survey research design. Please complete the following interactive exercise to see if you can identify the characteristics of survey research design that are found in this study.
History of survey research
Survey research has roots in English and American “social surveys” conducted around the turn of the 20th century by researchers and reformers who wanted to document the proliferation of social problems such as poverty (Converse, 1987) . [4] By the 1930s, the US government was conducting surveys to document economic and social conditions in the country. The need to draw conclusions about the entire population helped spur advances in sampling procedures. At about the same time, several researchers who had already made a name for themselves in market research studying consumer preferences for American businesses turned their attention to election polling. A watershed event was the presidential election of 1936 between Alf Landon and Franklin Roosevelt. A magazine called Literary Digest conducted a survey by sending ballots (which were also subscription requests) to millions of Americans. Based on this “straw poll,” the editors predicted that Landon would win in a landslide. At the same time, the new pollsters were using scientific methods with much smaller samples to predict just the opposite—that Roosevelt would win in a landslide. In fact, one of them, George Gallup, publicly criticized the methods of Literary Digest before the election and all but guaranteed that his prediction would be correct. And of course, it was. Interest in surveying around election times has led to several long-term projects, notably the Canadian Election Studies which has measured opinions of Canadian voters around federal elections since 1965. Anyone can access the data and read about the results of the experiments in these studies (see http://ces-eec.arts.ubc.ca/ )
From market research and election polling, survey research made its way into several academic fields, including political science, sociology, and public health—where it continues to be one of the primary approaches to collecting new data. Beginning in the 1930s, psychologists made important advances in questionnaire design, including techniques that are still used today, such as the Likert scale. We will discuss Likert scales later in this chapter. Survey research has a strong historical association with the social psychological studies of attitudes, stereotypes, and prejudice. Survey research has also been used by social workers to understand a variety of conditions and experiences.
In summary, survey research is a valuable research design, and one that may be used to study a variety of concepts. This flexibility of survey research allows it to be applied to many research projects, making it appealing for a variety of disciplines. Furthermore, its potential to gather information from a large number of people with a relatively low commitment of resources (compared to other methods) can also make it quite attractive to social science researchers.

Survey research in social work
The above section mentioned concern with the sample size and type of sampling as being important considerations for survey research. In general, many studies using survey research have the goal of generalizable findings from a sample to a population. That said, if you conduct a literature search for studies using survey research, you will find that most large survey research studies utilizing random sampling are conducted by psychologists or sponsored by large non-profit or government research organizations such as the Pew Research ( https://www.pewresearch.org/ ) Center or the United States Census Bureau ( https://www.census.gov/ ). For example, each year, the Pew Research Center randomly selects and interviews thousands of people in order to study a variety of social attitudes and beliefs. Additionally, every ten years, the U.S Census bureau implements a large-scale data collection process to understand population characteristics and changes. Both of these organizations seek to generalize sample results to the larger US population. Finally, since 1984 the Center for Disease Control and Prevention (CDC) ( https://www.cdc.gov/) has maintained the Behavioral Risk Factor Surveillance System, “the nation’s premier system of telephone surveys that collect state-level data about health risk behaviors, chronic health conditions, and use of preventive services” [5] . While often gathered by professionals in other disciplines, all of these sources of survey data can be very useful for social workers seeking to look at quantitative data across a variety of topics.
So, why are social work researchers less likely to utilize large probability sampling techniques? Due to the nature of the client systems with which we work, sometimes collecting large random samples may not be feasible. Remember that in order to utilize a probability sample, you need to have access to a considerable sampling frame . Many of the populations with which we work are “hidden” or harder to access. Thus, securing a list of all possible cases would be challenging, if not impossible. For example, think about a researcher wanting to study sex workers operating in a certain neighborhood. The researcher may have difficulty finding a list of all of the persons engaging in sex work in that neighborhood. The researcher could look at arrest records and seek to find all sex workers with an arrest record. However, having this list does not mean that the researcher would have access to sex workers. Next, sometimes social workers want to understand individual experiences so that they bring the perspectives of marginalized groups into the mainstream scholarly literature. These social workers may be less concerned with generalizing results and more concerned with “uncovering or discovering knowledge from oppressed groups”. For those social workers, a smaller-scale qualitative research project may be more feasible and allow the researcher to meet their goals.
As previously mentioned, social work practitioners are less likely to use large-scale probability samples. While they are less likely to implement these, there are situations where large-scale probability samples are used by social workers. For example, university-affiliated social work academics who have received federal grants may conduct multi-site projects. Additionally, licensing organizations such as the NASW may utilize questionnaires to collect information about members’ practice experiences. Furthermore, social work researchers are often part of interdisciplinary teams that may extend resources and access to larger sampling frames.
Social work student projects and survey design research
Within social work schools, students are usually required to demonstrate their proficiency in basic research by implementing an empirical study. Many students end up implementing a project that utilizes survey design, often selected due to convenience. In addition, sometimes agencies have existing questionnaires they want to be used for the student research project. Agencies may feel more comfortable with students using survey design research instead of other designs. For example, interviewing clients may be seen as part of students’ existing responsibilities; whereas implementing an experimental or quasi-experimental design may seem more time-consuming and labor-intensive for the agency. Further, my s tudents have found survey research projects to be interesting, intellectually rewarding, and feasible. Below is a list of past social work research projects that were conducted by second-year MSW students. Can you see how each of these studies involves students asking participants to provide information (orally or in writing) that is then analyzed?
Past Student Research Projects
- What is the level of interpersonal relationship satisfaction among those diagnosed with an eating disorder?
- Does age, gender and/or DSM 5 diagnoses indicate the level of mental health support that clients receive?
- For those seen in the XXX, Is there a difference in IPV injury patterns by gender?
- Does worker burn-out rate differ between departments within social service agencies?
- Is there a correlation between poor physical health and poor mental health functioning in college freshmen at XXX?
- Is there a relationship between burnout and compassion satisfaction among healthcare professionals who work in a mental health facility?
- Is there a difference in the levels of compassion fatigue and compassion satisfaction among the different types of direct service employees at the XXX agency?
- Is there a difference in the length of stay at XXX Hospital between individuals admitted voluntarily and those admitted involuntarily?
- What are the primary concerns that cause college students to present for services at their university’s counseling center?
- Does an individual’s level of stress influence treatment decisions?
Key Takeaways
- Survey research is common and used to gather a variety of information.
- Survey research is a design/approach, and a questionnaire is an actual tool used to collect data. While these words are often used interchangeably, they are different things.
- Two characteristics define survey research: participants being asked to provide information and a focus on sample size and sampling.
- Large random samples provide the opportunity to generalize results from your sample to the population from which it was drawn; however, this is often not possible for social work researchers.
- Successful questionnaire development takes time and requires feedback from multiple sources.
Think about your research project at this point.
- Why do you think this is the most appropriate way to gather data?
- Begin thinking about how you will access your population. What are some barriers you might experience to administering a survey?
- What made you decide not to use a survey? This is not to say you should use one!
- Are there related research questions to the one you chose that you could use a survey to answer?
12.2 Conducting a survey
- Define cross-sectional surveys, provide an example of a cross-sectional survey, and outline some of the drawbacks of cross-sectional research
- Describe the three types of longitudinal surveys
- Describe retrospective surveys and identify their strengths and weaknesses
- Discuss the benefits and drawbacks of the various methods of administering surveys
There is immense variety when it comes to surveys. This variety includes both how the survey is intended to reflect time and how the survey is administered or delivered to participants. In this section, we’ll look at variations across these two dimensions.
With respect to time, survey design is generally divided into two types: cross-sectional or longitudinal. Cross-sectional surveys are those that reflect responses that are given at just one point in time. These surveys offer researchers a snapshot in time and offer an idea about how things are for the respondents at the particular point in time that the survey is administered.
An example of a cross-sectional survey comes from Aniko Kezdy and colleagues’ study (Kezdy, Martos, Boland, & Horvath-Szabo, 2011) [1] of the association between religious attitudes, religious beliefs, and mental health among students in Hungary. These researchers administered a single, one-time-only, cross-sectional survey to a convenience sample of 403 high school and college students. The survey focused on how religious attitudes impact various aspects of one’s life and health. The researchers found from analysis of their cross-sectional data that anxiety and depression were highest among those who had both strong religious beliefs and some doubts about religion.
Yet another recent example of cross-sectional survey research can be seen in Bateman and colleagues’ study (Bateman, Pike, & Butler, 2011) [2] of how the perceived ‘publicness’ of social networking sites influences users’ self-disclosures. These researchers administered an online survey to undergraduate and graduate business students to understand perceptions and behaviors on this topic. They found that even though revealing information about oneself is viewed as key to realizing many of the benefits of social networking sites, respondents were less willing to disclose information about themselves as their perceptions of a social networking site’s publicness rose. That is, there was a negative relationship between perceived publicness of a social networking site and plans to self-disclose on the site.
One problem with cross-sectional surveys is that the events, opinions, behaviors, and other phenomena that such surveys are designed to assess don’t generally remain stagnant. They change over time and may be influenced by any number of things. Thus, generalizing from a cross-sectional survey about the way things are can be tricky; perhaps you can say something about the way things were in the moment that you administered your survey, but it is difficult to know whether things remained that way for long after you administered your survey. Think, for example, about how Americans might have responded if they received a survey asking for their opinions on terrorism on September 12, 2000. Now imagine how responses to the same set of questions might differ were they administered on September 12, 2001. The point is not that cross-sectional surveys are useless; they have many important uses. But researchers must remember what they have captured by administering a cross-sectional survey—that is, as previously noted, a snapshot of life as it was at the time that the survey was administered.
One way to overcome this sometimes-problematic aspect of cross-sectional surveys is to administer a longitudinal survey. Longitudinal surveys are those that enable a researcher to make observations over some extended period of time. There are several types of longitudinal surveys, including trend, panel, and cohort surveys. We’ll discuss all three types here, along with retrospective surveys. Retrospective surveys fall somewhere in between cross-sectional and longitudinal surveys.
The first type of longitudinal survey is called a trend survey . The main focus of a trend survey is, perhaps not surprisingly, trends. Researchers conducting trend surveys are interested in how people in a specific group change over time. Each time the researchers gather data, they ask different people from the group they are studying because their concern is capturing the sentiment of the group, not the individual people they survey. Let’s look at an example.
The Monitoring the Future Study ( http://www.monitoringthefuture.org/ ) is a trend study that described the substance use of high school children in the United States. It’s conducted annually by the National Institute on Drug Abuse (NIDA). Each year NIDA distributes surveys to children in high schools around the country to understand how substance use and abuse in that population changes over time. Perhaps surprisingly, fewer high school children reported using alcohol in the past month than at any point over the last 20 years. Recent data also reflected an increased use of e-cigarettes and the popularity of e-cigarettes with no nicotine over those with nicotine. The data points provide insight into targeting substance abuse prevention programs and resources. As you will note, this study is looking at general trends for this age group; it is not interested in tracking the changing attitudes or behaviors of specific students over time.
Unlike in a trend survey, in a panel survey the same people participate in the survey each time it is administered. As you might imagine, panel studies can be difficult and costly. Imagine trying to administer a survey to the same 100 people every year for, say, 5 years in a row. Keeping track of where people live, when they move, how to contact them and when they die, etc. takes resources that researchers often don’t have. When they do, however, the results can be quite powerful. The Youth Development Study (YDS), administered from the University of Minnesota, offers an excellent example of a panel study.
Since 1988, YDS researchers have administered an annual survey to the same 1,000 people. Study participants were in ninth grade when the study began, and they are now in their thirties. Several hundred papers, articles, and books have been written using data from the YDS. One of the major lessons learned from this panel study is that work has a largely positive impact on young people (Mortimer, 2003). [3] Contrary to popular beliefs about the impact of work on adolescents’ performance in school and transition to adulthood, work in fact increases confidence, enhances academic success, and prepares students for success in their future careers. Without this panel study, we may not be aware of the positive impact that working can have on young people. You can read more about the Youth Development Study at its website: https://cla.umn.edu/sociology/graduate/collaboration-opportunities/youth-development-study .
Another type of longitudinal survey is a cohort survey. In a cohort survey , the participants have a defining characteristic that the researcher is interested in studying. The same people don’t necessarily participate from year to year, but all participants must meet whatever categorical criteria fulfill the researcher’s primary interest. Common cohorts that may be of interest to researchers include people of particular generations or those who were born around the same time period, graduating classes, people who began work in a given industry at the same time, or perhaps people who have some specific historical experience in common.
An example of this sort of research can be seen in Christine Percheski’s work (2008) [4] on cohort differences in women’s employment. Percheski compared women’s employment rates across seven generational cohorts, from Progressives born between 1906 and 1915 to Generation Xers born between 1966 and 1975. She found, among other patterns, that professional women’s labor force participation had increased across all cohorts. She also found that professional women with young children from Generation X had higher labor force participation rates than similar women from previous generations, concluding that mothers do not appear to be opting out of the workforce as some journalists have speculated (Belkin, 2003). [5]
All three types of longitudinal surveys share the strength in that they permit a researcher to make observations over time. This means that if whatever behavior or other phenomenon the researcher is interested in changes, either because of some world event or because people age, the researcher will be able to capture those changes. Table 12.1 summarizes these three types of longitudinal surveys.
| Researcher examines changes in trends over time; the same people do not necessarily participate in the survey more than once. | |
| Researcher surveys the exact same sample several times over a period of time. | |
| Researcher identifies a defining characteristic and then regularly surveys people who have that characteristic. |
Finally, retrospective surveys are similar to other longitudinal studies in that they deal with changes over time, but like a cross-sectional study, they are administered only once. In a retrospective survey, participants are asked to report events from the past. By having respondents report past behaviors, beliefs, or experiences, researchers are able to gather longitudinal-like data without actually incurring the time or expense of a longitudinal survey. Of course, this benefit must be weighed against the highly likely possibility that people’s recollections of their pasts may be faulty, incomplete,or slightly modified by the passage of time. Imagine, for example, that you’re asked in a survey to respond to questions about where, how, and with whom you spent last Valentine’s Day. As last Valentine’s Day can’t have been more than 12 months ago, chances are good that you might be able to respond accurately to some survey questions about it. But now let’s say the researcher wants to know how last Valentine’s Day compares to previous Valentine’s Days, so she asks you to report on where, how, and with whom you spent the preceding six Valentine’s Days. How likely is it that you will remember? Will your responses be as accurate as they might have been had you been asked the question each year over the past 6 years, rather than asked to report on all years today?
In sum, when or with what frequency a survey is administered will determine whether your survey is cross-sectional or longitudinal. While longitudinal surveys are certainly preferable in terms of their ability to track changes over time, the time and cost required to administer a longitudinal survey can be prohibitive. Furthermore, by maintaining and accessing contact information for participants over long periods of time, we are increasing the opportunities for their privacy to be compromised. The issues of time described here are not necessarily unique to survey research. Other methods of data collection can be cross-sectional or longitudinal—these are larger matters of research design that really apply to all types of research. But we’ve placed our discussion of these terms here because they are most commonly used by survey researchers to describe the type of survey administered. Another aspect of survey design deals with how surveys are administered. We’ll examine that next.
Administration
Surveys vary not just in terms of the way they deal with time, but also in terms of how they are administered. One common way to administer surveys is through self-administered questionnaires . This means that a research participant is given a set of questions, in writing, to which they are asked to respond to autonomously. These questionnaires can be hard copy or virtual. We’ll consider both modes of delivery here.
Hard copy self-administered questionnaires may be delivered to participants in person or via snail mail. Perhaps you’ve take a survey that was given to you in person; on many college campuses, it is not uncommon for researchers to administer surveys in large social science classes (as you might recall from the chapter on sampling). If you are ever asked to complete a survey in a similar setting, it might be interesting to note how your perspective on the survey and its questions could be shaped by the new knowledge you’re gaining about survey research in this chapter.
Researchers may also deliver surveys in person by going door-to-door or in public spaces by either asking people to fill them out right away or making arrangements for the researcher to return to pick up completed surveys or having them dropped off or mailed (with a self-addressed stamped envelope provided) to a designated location. The advent of online survey tools and greater widespread internet access has made door-to-door and snail mail delivery of surveys much less common, although I still see an occasional survey researcher at my door, especially around election time. This mode of gathering data is apparently still used by political campaign workers, at least in some areas of the country.
While choosing snail mail to disseminate your survey may not be ideal (imagine how much less likely you’d probably be to return a survey that didn’t come with the researcher standing on your doorstep waiting to take it from you), sometimes it is the only available or the most practical option. As mentioned, though, this may not be the most ideal way of administering a survey because it can be difficult to convince people to take the time to complete and return your survey. Additionally, mail that is received and not recognized may be regarded with suspicion or ignored altogether. If you are choosing to mail out your survey by post, make sure you are very thoughtful about the materials, including the envelope. They should look professional, but also personalized whenever possible to help engage the participant quickly. Chances are you worked hard on your study – the last thing you want is the potential participant to receive your survey in the mail and chuck it in the waste bin without even opening it!
Often survey researchers who deliver their surveys via snail mail may provide some advance notice to respondents about the survey to get people thinking about and preparing to complete it. They may also follow up with their sample a few weeks after their survey has been sent out. This can be done not only to remind those who have not yet completed the survey to please do so but also to thank those who have already returned the survey. Most survey researchers agree that this sort of follow-up is essential for improving mailed surveys’ return rates (Babbie, 2010). [6] Other helpful tools to increase response rate are to create an attractive and professional survey, offer monetary incentives, and provide a pre-addressed, stamped return envelope.
Earlier, I mentioned online delivery as another way to administer a survey. This delivery mechanism is becoming increasingly common, no doubt because it is easy to use, relatively cheap, and may be more efficient than knocking on doors or waiting for mailed surveys to be returned. To deliver a survey online, the most frequent method employed by researchers is to use an online survey management service or application. These might be paid subscription services, like SurveyMonkey ( https://www.surveymonkey.com ) or Qualtrics ( https://www.qualtrics.com ), or free applications, like Google Forms. With any of these options you will design your survey online and then be provided a link to send out to your potential participants either via email or by posting the link in a virtually accessible space, like a forum, group, or webpage. Wherever you choose to share the link, you will need to consider how you will gain permission to do so, which may mean getting permission to use a distribution list of emails or gaining permission from a group forum administer to post a link in the forum for members to access.
Many of the suggestions provided for improving the response rate on a hard copy questionnaire apply to online questionnaires as well. One difference of course is that the sort of incentives one can provide in an online format differ from those that can be given in person or sent through the mail. But this doesn’t mean that online survey researchers cannot offer completion incentives to their respondents. I’ve taken a number of online surveys; many of these did not come with an incentive other than the joy of knowing that I’d helped a fellow social scientist do their job. However, for participating in one survey, I was given a coupon code to use for $30 off any order at a major online retailer. I’ve taken other online surveys where on completion I could provide my name and contact information if I wished to be entered into a lottery together with other study participants to win a larger gift, such as a $50 gift card or an iPad.
Online surveys, however, may not be accessible to individuals with limited, unreliable, or no access to the internet or less skill at using a computer. If those issues are common in your target population, online surveys may not work as well for your research study. While online surveys may be faster and cheaper than mailed surveys, mailed surveys are more likely to reach your entire sample but also more likely to be lost and not returned. The choice of which delivery mechanism is best depends on a number of factors, including your resources, the resources of your study participants, and the time you have available to distribute surveys and wait for responses. Understanding the characteristics of your study’s population is key to identifying the appropriate mechanism for delivering your survey.
Sometimes surveys are administered by having a researcher pose questions verbally to respondents, rather than having respondents read the questions on their own. Researchers using phone or in-person surveys use an interview schedule which contains the list of questions and answer options that the researcher will read to respondents. Consistency in the way that questions and answer options are presented is very important with an interview schedule. The aim is to pose every question-and-answer option in the same way to every respondent. This is done to minimize interviewer effect, or possible changes in the way an interviewee responds based on how or when questions and answer options are presented by the interviewer. In-person surveys may be recorded, but because questions tend to be closed ended, taking notes during the interview is less disruptive than it can be during a qualitative interview.
Interview schedules are used in phone or in-person surveys and are also called quantitative interviews. Phone surveys are often conducted by political polling firms to understand how the electorate feels about certain candidates or policies. In both cases, researchers pose questions verbally to participants. As someone who has poor research karma, I often decline to participate in phone studies when I am called. It is easy, socially acceptable even, to hang up abruptly on an unwanted caller. Additionally, a distracted participant who is cooking dinner, tending to troublesome children, or driving may not provide accurate answers to your questions. Phone surveys make it difficult to control the environment in which a person answers your survey. Another challenge comes from the increasing number of people who only have cell phones and do not use landlines (Pew Research, n.d.). [7] Unlike landlines, cell phone numbers are portable across carriers, associated with individuals, not households, and do not change their first three numbers when people move to a new geographical area. Computer-assisted telephone interviewing (CATI) programs have also been developed to assist quantitative survey researchers. These programs allow an interviewer to enter responses directly into a computer as they are provided, thus saving hours of time that would otherwise have to be spent entering data into an analysis program by hand.
Quantitative interviews must also be administered in such a way that the researcher asks the same question the same way each time. While questions on hard copy questionnaires may create an impression based on the way they are presented, having a person administer questions introduces a slew of additional variables that might influence a respondent. Even a slight shift in emphasis on a word may bias the respondent to answer differently. As I’ve mentioned earlier, consistency is key with quantitative data collection—and human beings are not necessarily known for their consistency. On the positive side, quantitative interviews can help reduce a respondent’s confusion. If a respondent is unsure about the meaning of a question or answer option on a self-administered questionnaire, they probably won’t have the opportunity to get clarification from the researcher. An interview, on the other hand, gives the researcher an opportunity to clarify or explain any items that may be confusing. If a participant asks for clarification, the researcher often uses pre-determined responses to make sure each quantitative interview is exactly the same as the others.
In-person surveys are conducted in the same way as phone surveys but must also account for non-verbal expressions and behaviors. In-person surveys do carry one distinct benefit—they are more difficult to say “no” to. Because the participant is already in the room and sitting across from the researcher, they are less likely to decline than if they clicked “delete” for an emailed online survey or pressed “hang up” during a phone survey. In-person surveys are also much more time consuming and expensive than mailing questionnaires. Thus, quantitative researchers may opt for self-administered questionnaires over in-person surveys on the grounds that they will be able to reach a large sample at a much lower cost than were they to interact personally with each and every respondent.
- Time is a factor in determining what type of survey a researcher administers; cross-sectional surveys are administered at one time, and longitudinal surveys are administered over time.
- Retrospective surveys offer some of the benefits of longitudinal research but also come with their own drawbacks.
- Self-administered questionnaires may be delivered in hard copy form to participants in person or via snail mail or online.
- Interview schedules are used with in-person or phone surveys.
- Each method of survey administration comes with benefits and drawbacks.
Think about the population you want to research.
- Which type of survey (i.e., in-person, telephone, web-based, by mail) do you think would most effectively reach your population? Why?
- Are there elements of your population you could miss by choosing one of these ways to administer your survey? How might this affect your results?
12.3 Writing a questionnaire
- Define different formats of questions
- Describe the principles of a good survey question
- Discuss the importance of pilot testing questions
- Understand principles of question development
- Evaluate questionnaire and interview questions

How are questionnaires developed? Developing an effective questionnaire takes a long time and is both a science and art. It is a science because the questionnaire should be developed based on accepted principles of questionnaire development that have evolved over time and practice. For instance, you must be attentive to issues of conceptual development, as well as reliability and validity. On the other hand, questionnaire development is also an art because it must take into account things such as color, font, use of white-space, etc. that will make a written questionnaire aesthetically pleasing. Researchers who develop questionnaires rely on colleagues and pilot testing to refine their measurement tools.
When implementing a survey, conduct an initial literature search to determine if there are existing questionnaires or interview questions you may use for your study. If not, you must create your own tool or tools, which may be a challenging process. You must have a strong understanding of what you want to ask, why you want to ask it, and how you want to ask. You need to be able to understand the potential barriers to your project and take these into account as you design your instrument(s). As discussed above, surveys are often self-administered. This means they must stand on their own so that they can be correctly understood and interpreted by your research participants. While this may seem like an easy task, you would be surprised how quickly things get misinterpreted!
How to ask the right questions
How are items for questionnaires and interviews developed? Questions should be developed based on existing principles concerning item development. Remember that a questionnaire is developed to measure some variable or concept. We are often going to develop a series of questions that will help us to gather data about various aspects of that variable. These questions should be grounded in the existing literature on your topic and should comprehensively assess the variable you are seeking to understand. For instance, if I develop a questionnaire about depression, but I don’t ask any questions about loss of interest in doing things, it would be a major gap in the information I am collecting about this variable. A good literature search will help me to identify the various areas that I will need to ask about in my questionnaire so that I can get the most complete picture of depression from participants. Questionnaire items must take into account idiosyncrasies regarding language, meaning that we need to anticipate the variety of ways that people might read and process the meaning of a question and its responses. Continuing on with the depression questionnaire example, we might ask a question about whether people feel blue much of the time. While it might be evident to you or I that the phrase “feeling blue” means experiencing low mood or sadness, that might not be interpreted the same by everyone, especially across cultural groups. Remember, being attentive to the way in which you ask questions is critical.
The next few sections will discuss the different characteristics of questionnaires and interviews and provide guidance on writing effective questions. Please note that this section discusses “guidelines.” There may be times when these guidelines are not relevant. It is up to you as the researcher to read each guideline and determine if your study requires exceptions to them.
Guidelines for creating good questions
Crafting good questions is hard and requires thoughtful attention, feedback and revision. Below are some resources that will aid you in these tasks.
Participants in survey research are very sensitive to the types of questions asked. Poorly framed or ambiguous questions will likely result in meaningless responses with little value. Dillman (1978) provides several “rules” or guidelines for creating good questions:
Every question should be carefully scrutinized for the following issues:
- Is the question clear and understandable? Questions should use very simple language, preferably in the active voice and without complicated words or jargon that may not be understood by a typical participant. All questions in the questionnaire should be worded in a similar manner to make it easy for respondents to read and understand them. The only exception is if your questionnaire is targeted at a specialized group of respondents, such as doctors, lawyers, and researchers, who use such jargon in their everyday work environment.
- Is the question worded in a negative manner? Negatively worded questions, such as “Should your local government not raise taxes?” tend to confuse participants and lead to inaccurate responses. Such questions should be avoided, and in all cases, avoid double-negatives.
- Is the question ambiguous? Questions should not use words or expressions that may be interpreted differently by different participants (e.g., words like “any” or “just”). For instance, if you ask a respondent, what is your annual income, it is unclear whether you referring to salary/wages, or also dividend, rental, and other income, whether you referring to personal income, family income (including spouse’s wages), or personal and business income? Different interpretations will lead to incomparable responses that cannot be interpreted correctly.
- Does the question have biased or value-laden words? Bias refers to any property of a question that encourages participants to answer in a certain way. As social workers, we understand how we must be intentional with language. For instance, Kenneth Rasinky (1989) examined several studies on people’s attitudes toward government spending and observed that respondents tend to indicate stronger support for “assistance to the poor” and less for “welfare,” even though both terms had the same meaning. Remember the difference in public perception between “Obamacare” and the “Affordable Care Act?” Biased language or tone tends to skew observed responses. In summary, qu estions should be carefully evaluated to avoid biased language.
- Is the question double-barreled? Double-barreled questions are those that can have multiple answers. For example, are you satisfied with your professor’s grading style and lecturing? In this example, how should a respondent answer if they are satisfied with the grading style but not the lecturing and vice versa? It is always advisable to separate double-barreled questions into separate questions: (1) are you satisfied with your professor’s grading? and (2) are you satisfied with your professor’s lecturing? Another example: does your family favor public television? Some people may favor public television for themselves, but favor certain cable television programs such as Sesame Street for their children.
- Is the question too general? Sometimes, questions that are too general may not accurately convey respondents’ perceptions. If you asked someone how they liked a certain book and provide a response scale ranging from “not at all” to “extremely well”, and if that person selected “extremely well,” what do they mean? Instead, ask more specific behavioral questions, such as “Will you recommend this book to others?” or “Do you plan to read other books by the same author?”
- Is the question too detailed? Avoid unnecessarily detailed questions that serve no specific research purpose. For instance, do you need the age of each child in a household or is just the number of children in the household acceptable? However, if unsure, it is better to err on the side of details than generality.
- Is the question presumptuous? Does your question make assumptions? For instance, if you ask, “what do you think the benefits of a tax cut would be?” you are presuming that the participant sees the tax cut as beneficial. But many people may not view tax cuts as beneficial. Some might see tax cuts as a precursor to less funding for public schools and fewer public services such as police, ambulance, and fire department. Avoid questions with built-in presumptions.
- Does the question ask the participant to imagine something? Is the question imaginary? A popular question on many television game shows is “if you won a million dollars on this show, how will you plan to spend it?” Most participants have never been faced with this large amount of money and have never thought about this scenario. In fact, most don’t even know that after taxes, the value of the million dollars will be greatly reduced. In addition, some game shows spread the amount over a 20-year period. Without understanding this “imaginary” situation, participants may not have the background information necessary to provide a meaningful response.
Another way to examine questions is to use the BRUSO model (Peterson, 2000) . [6] Note: Here this model is focused on questionnaires; however, it is also relevant for interview questions. An acronym, BRUSO stands for “brief,” “relevant,” “unambiguous,” “specific,” and “objective.” Effective questionnaire items are brief and to the point. They avoid long, overly technical, or unnecessary words. This brevity makes it easier for respondents to understand and faster for them to complete. Effective questionnaire items are also relevant to the research question. If a respondent’s sexual orientation, marital status, or income is not relevant, then items requesting information on them should probably not be included. Again, this makes the questionnaire faster to complete, but it also avoids annoying respondents with what they will rightly perceive as irrelevant or even “nosy” questions. Effective questionnaire items are also unambiguous ; they can be interpreted in only one way. Part of the problem with the alcohol item presented earlier in this section is that different respondents might have different ideas about what constitutes “an alcoholic drink” or “a typical day.” Effective questionnaire items are also specific so that it is clear to respondents what their response should be about and clear to researchers what it is about. A common problem here is closed-ended items that are “double-barreled.” They ask about two conceptually distinct issues but allow only one response. For example, “Please rate the extent to which you have been feeling anxious and depressed.” This item should probably be split into two separate items—one about anxiety and one about depression. Finally, effective questionnaire items are objective in the sense that they do not reveal the researcher’s own opinions or lead participants to answer in a particular way.
| “Are you now or have you ever been the possessor of a firearm?” | Have you ever possessed a firearm? | |
| “Who did you vote for in the last election?” | Note: Only include items that are relevant to your study. | |
| “Are you a gun person?” | Do you currently own a gun?” | |
| How much have you read about the new gun control measure and sales tax?” | “How much have you read about the new sales tax on firearm purchases?” | |
| “How much do you support the beneficial new gun control measure?” | “What is your view of the new gun control measure?” |
Response formats
Questions may be found on questionnaires and in interview guides in a variety of formats. When developing questions, it is important to think about the type of data you will collect and how useful it will be to your project. Remember our discussion on levels of measurement ? When you think about the format of your questions, it is also important to think about the level of measurement. Are you concerned with yes/no answers? Dichotomous response questions would work well for you. Do you have items where you really want participants to explain feelings or experiences? Perhaps open-ended items are best. Is computing an overall score important? You might want to consider using interval-ratio response items or continuous response questions.
Below is a list of some of the different question formats. Remember, questions may be more than one type of format. For instance, you may have a filter question that is a dichotomous response item. As you look at this list, think about the questions that you have been asked in questionnaires or interviews. Which were the most common?
Question Formats
Based on Level of Measurement
- Nominal response question -Participants are presented with more than two un-ordered options, such as: What is your social work track ( Children and Families, Mental Health, Medical Social Work, International Social Work, Planning and Administration)?
- Ordinal response question- Participants have more than two ordered options, such as: what is your highest level of social work education (AS, BSW, MSW, PhD)?
- Interval response question -Participants are presented with an opportunity to indicate a numerical response in which the answer cannot be zero or none. For example, “how old are you?” This type of format can also include answers from a semantic differential scale or Guttman scale. Each of these scale types was discussed in the previous chapter.
- Continuous or ratio response question -Participants enter a continuous (ratio-scaled) value with a meaningful zero point, such as their age or tenure in a firm. These responses generally tend to be of the fill-in-the-blanks type.
Other Types of Questions
- Dichotomous response question -Participants are asked to select one of two possible choices, such as true/false, yes/no, or agree/disagree. An example of such a question is: Do you think those who receive public assistance should be drug tested (Yes or No)?
- Filter or Screening Questions– Questions that screen out/identify a certain type of respondent. For instance, let’s pretend that you want to survey your research class to determine how those with a letter of accommodation (for a disability) are navigating their field placement. One of the first questions is a filter question that asks students if they have a letter of accommodation. In other words, everyone receives the tool but you have a way to “screen in” those who can answer your research question.
- Close-ended questions– Question type where participants are asked to choose their response from a list of existing responses. For instance, how many semesters of research should MSW students take: one, two, or three?
- Open-ended question– Question type in which participants are asked to provide a detailed answer to a question. For example, “How do you feel about the new medication-assisted recovery center?”
- Matrix question– Matrix questions are used to gather data across a number of variables that all have the same response categories. For examples, I might be interested in knowing “How likely you are to agree with the following statements: I prefer to study in the morning, I prefer to study with music playing, I prefer to study alone, I prefer to study in my room, I prefer to study in a coffee shop”. These are all separate questions, but the responses categories for all of these will be “Strongly Agree, Agree, Neither Agree nor Disagree, Disagree, Strongly Disagree”. When I set this question up I will develop a table or matrix, where the questions form the rows and the responses categories are the columns.
For visual examples, please see this book chapter on types of survey questions which includes some helpful diagrams.
A note about closed-ended questions
Closed-ended questions are used when researchers have a good idea of the different responses participants might make. They are more quantitative in nature, so they are also used when researchers are interested in a well-defined variable or construct such as participants’ level of agreement with some statement, perceptions of risk, or frequency of a particular behavior. Closed-ended items are more difficult to write because they must include an appropriate set of response options. However, they are relatively quick and easy for participants to complete. They are also much easier for researchers to analyze because the responses can be easily converted to numbers and entered into a spreadsheet. For these reasons, closed-ended items are much more common.
For closed-ended items, it is also important to create an appropriate response scale. For categorical variables, the categories presented should generally be mutually exclusive and exhaustive. Mutually exclusive categories do not overlap. For a religion item, for example, the categories of Christian and Catholic are not mutually exclusive but Protestant and Catholic are mutually exclusive. Exhaustive categories cover all possible responses. Although Protestant and Catholic are mutually exclusive, they are not exhaustive because there are many other religious categories that a respondent might select: Jewish , Hindu , Buddhist , and so on. In many cases, it is not feasible to include every possible category, in which case an Other category, with a space for the respondent to fill in a more specific response, is a good solution. If respondents could belong to more than one category (e.g., race), they should be instructed to choose all categories that apply. However, note that when you allow a participant to select more than one category, you need to realize that it may make analyzing your data more complicated.
For rating scales, five or seven response options generally allow about as much precision as respondents are capable of. However, numerical scales with more options can sometimes be appropriate. For dimensions such as attractiveness, pain, and likelihood, a 0-to-10 scale will be familiar to many respondents and easy for them to use. Regardless of the number of response options, the most extreme ones should generally be “balanced” around a neutral or modal midpoint.
Putting your questions together
An additional consideration is the “flow” of questions. Imagine being a participant in an interview. In the first scenario, the interviewer begins by asking you to answer questions that are very sensitive. Now imagine another scenario, one in which the interviewer begins with less intrusive questions. Which scenario sounds more appealing? In the first scenario, you might feel caught off guard and uncomfortable. In the second situation, you have time to develop rapport before moving into more sensitive questions. The order in which you structure your questions matters. Generally, questions should flow from the least sensitive to the most sensitive and from the general to the specific. A few other considerations are identified in the box below.
General Rules for Question Sequencing And Other Important Considerations
- Start with easy non-threatening questions that can be easily recalled. Good options are demographics (age, gender, education level) for individual-level surveys and ‘firmographics’ (employee count, annual revenues, industry) for firm-level surveys.
- Never start with an open-ended question.
- If following a historical sequence of events, follow a chronological order from earliest to latest.
- Ask about one topic at a time. When switching topics, use a transition, such as “The next section examines your opinions about …”
- Use filter or contingency questions as needed, such as: “If you answered “yes” to question 5, please proceed to Section 2. If you answered “no” go to Section 3.”
Also…
- People’s time is valuable. Be respectful of their time. Keep your questionnaire as short as possible and limit it to what is absolutely necessary. Participants do not like spending more than 10-15 minutes on any questionnaire, no matter how important or interesting the topic. Longer surveys tend to dramatically lower response rates.
- Always assure participants about the confidentiality of their responses, and how you will use their data (e.g., for academic research) and how the results will be reported (usually, in the aggregate). Your informed consent should be clear about these.
- For organizational questionnaires, assure participants that you will send a copy of the final results to the organization (and follow through!).
- Thank respondents for their participation in your study.
- Finally, and perhaps most importantly, pretest your questionnaire, by at least using a convenience sample, before administering it to your participants. Such pretesting may uncover ambiguity, lack of clarity, or biases in question-wording, which should be eliminated before administering to the intended sample. As a student, you might pretest with classmates, friends, other people at your field agency, etc.
- Evaluating questions to be used in a questionnaire or interview is critical to the research project. There are many ways to examine your questions.
- There are different types of question formats. The researcher must select the type of question that is consistent with the type of data that they need to collect.
- Draft a few potential questions you might include on a questionnaire as part of a survey for your topic.
12.4 Strengths and challenges of survey research
- Understand the benefits of surveys as a raw data collection method
- Understand the drawbacks of surveys as a raw data collection method
Strengths of survey methods
Researchers employing survey methods to collect data enjoy a number of benefits. First, surveys are an excellent way to gather lots of information from many people. In a study of older people’s experiences in the workplace, researchers were able to mail a written questionnaire to around 500 people who lived throughout the state of Maine at a cost of just over $1,000. This cost included printing copies of a seven-page survey, printing a cover letter, addressing and stuffing envelopes, mailing the survey, and buying return postage for the survey. I realize that $1,000 is nothing to sneeze at, but just imagine what it might have cost to visit each of those people individually to interview them in person. You would have to dedicate a few weeks of your life at least, drive around the state, and pay for meals and lodging to interview each person individually. We could double, triple, or even quadruple our costs pretty quickly by opting for an in-person method of data collection over a mailed survey. Thus, surveys are relatively cost-effective.
Related to the benefit of cost-effectiveness is a survey’s potential for generalizability. Because surveys allow researchers to collect data from very large samples for a relatively low cost, survey methods lend themselves to probability sampling techniques, which we discussed in Chapter 10. Of all the data collection methods described in this textbook, survey research is probably the best method to use when one hopes to gain a representative picture of the attitudes and characteristics of a large group.
Survey research also tends to be a reliable method of inquiry. This is because surveys are standardized in that the same questions, phrased in exactly the same way, as they are posed to participants. Other methods, such as qualitative interviewing, which we’ll learn about in Chapter 18, do not offer the same consistency that a quantitative survey offers. This is not to say that all surveys are always reliable. A poorly phrased question can cause respondents to interpret its meaning differently, which can reduce that question’s reliability. Assuming well-constructed questions and survey design, one strength of this methodology is its potential to produce reliable results.
The versatility of survey research is also an asset. Surveys are used by all kinds of people in all kinds of professions. The versatility offered by survey research means that understanding how to construct and administer surveys is a useful skill to have for all kinds of jobs. Lawyers might use surveys in their efforts to select juries, social service and other organizations (e.g., churches, clubs, fundraising groups, activist groups) use them to evaluate the effectiveness of their efforts, businesses use them to learn how to market their products, governments use them to understand community opinions and needs, and politicians and media outlets use surveys to understand their constituencies.
In sum, the following are benefits of survey research:
- Cost-effectiveness
- Generalizability
- Reliability
- Versatility
Weaknesses of survey methods
As with all methods of data collection, survey research also comes with a few drawbacks. First, while one might argue that surveys are flexible in the sense that we can ask any number of questions on any number of topics in them, the fact is that the survey researcher is generally stuck with a single instrument for collecting data: the questionnaire. Surveys are in many ways rather inflexible. Let’s say you mail a survey out to 1,000 people and then discover, as responses start coming in, that your phrasing on a particular question seems to be confusing a number of respondents. At this stage, it’s too late for a do-over or to change the question for the respondents who haven’t yet returned their surveys. When conducting in-depth interviews, on the other hand, a researcher can provide respondents further explanation if they’re confused by a question and can tweak their questions as they learn more about how respondents seem to understand them.
Depth can also be a problem with surveys. Survey questions are standardized; thus, it can be difficult to ask anything other than very general questions that a broad range of people will understand. Because of this, survey results may not be as valid as results obtained using methods of data collection that allow a researcher to more comprehensively examine whatever topic is being studied. Let’s say, for example, that you want to learn something about voters’ willingness to elect an African American president, as in our opening example in this chapter. General Social Survey respondents were asked, “If your party nominated an African American for president, would you vote for him if he were qualified for the job?” Respondents were then asked to respond either yes or no to the question. But what if someone’s opinion was more complex than could be answered with a simple yes or no? What if, for example, a person was willing to vote for an African American woman but not an African American man? [1]
In sum, potential drawbacks to survey research include the following:
- Inflexibility
- Lack of depth
Potential for bias
If you choose to use a survey design in your research project, you will have to weigh the pros and cons of that approach and make sure that it is appropriate to your research question. In addition, as you implement your survey, you should be aware of some potential issues that may arise in the data that result from conducting survey research.
Non-Response Bias
Survey research is generally notorious for its low response rates. A response rate of 15-20% is typical in a mail survey, even after two or three reminders. If the majority of the targeted respondents fail to respond to a survey, then a legitimate concern is whether non-respondents are not responding due to a systematic reason, which may raise questions about the validity of the study’s results, especially as this relates to the representativeness of the sample. This is known as non-response bias . For instance, dissatisfied customers tend to be more vocal about their experience than satisfied customers, and are therefore more likely to respond to satisfaction questionnaires. Hence, any respondent sample is likely to have a higher proportion of dissatisfied customers than the underlying population from which it is drawn. In this instance, not only will the results lack generalizability, but the observed outcomes may also be an artifact of the biased sample. Several strategies that can be employed to improve response rates are discussed in the box below.
Strategies to Improve Response Rate
- Advance notification : A short letter sent in advance to the targeted respondents soliciting their participation in an upcoming survey can prepare them and improve likelihood of response. The letter should state the purpose and importance of the study, mode of data collection (e.g., via a phone call, a survey form in the mail, etc.), and appreciation for their cooperation. A variation of this technique may request the respondent to return a postage-paid postcard indicating whether or not they are willing to participate in the study.
- Ensuring that content is relevant : If a survey examines issues of relevance or importance to respondents, then they are more likely to respond.
- Creating a respondent-friendly questionnaire : Shorter survey questionnaires tend to elicit higher response rates than longer questionnaires. Furthermore, questions that are clear, inoffensive, and easy to respond to tend to get higher response rates.
- Having the project endorsed : For organizational surveys, it helps to gain endorsement from a senior executive attesting to the importance of the study to the organization. Such endorsements can be in the form of a cover letter or a letter of introduction, which can improve the researcher’s credibility in the eyes of the respondents.
- Providing follow-up requests : Multiple follow-up requests may coax some non-respondents to respond, even if their responses are late.
- Ensuring that interviewers are properly trained : Response rates for interviews can be improved with skilled interviewers trained on how to request interviews, use computerized dialing techniques to identify potential respondents, and schedule callbacks for respondents who could not be reached.
- Providing incentives : Response rates, at least with certain populations, may increase with the use of incentives in the form of cash or gift cards, giveaways such as pens or stress balls, entry into a lottery, draw or contest, discount coupons, the promise of contribution to charity, and so forth.
- Providing non-monetary incentives : Businesses in particular are more prone to respond to non-monetary incentives than financial incentives. An example of such a non-monetary incentive is a benchmarking report comparing the business’s individual response against the aggregate of all responses to a survey.
- Making participants fully aware of confidentiality and privacy : Finally, assurances that respondents’ private data or responses will not fall into the hands of any third party may help improve response rates.
Sampling bias
Sampling bias is present when our sampling process results in a sample that does not represent our population in some way. Telephone surveys conducted by calling a random sample of publicly available telephone numbers will systematically exclude people with unlisted telephone numbers, mobile phone numbers, and will include a disproportionate number of respondents who have land-line telephone service with listed phone numbers and people who stay home during much of the day, such as the unemployed, the disabled, and the elderly. Likewise, online surveys tend to include a disproportionate number of students and younger people who are constantly on the Internet, and systematically exclude people with limited or no access to computers or the Internet, such as the poor and the elderly. Similarly, questionnaire surveys tend to exclude children and people who are unable to read, understand, or meaningfully respond to the questionnaire. A different kind of sampling bias relates to sampling the incorrect or incomplete population, such as asking teachers (or parents) about the academic learning of their students (or children) or asking CEOs about operational details in their company. Such biases make the respondent sample unrepresentative of the intended population and can hurt generalizability claims about inferences drawn from the biased sample.
Social desirability bias
Social desirability bias occurs when we create questions that lead respondents to answer in ways that don’t reflect their genuine thoughts or feelings to avoid being perceived negatively. With negative questions such as, “do you think that your project team is dysfunctional?”, “is there a lot of office politics in your workplace?”, or “have you ever illegally downloaded music files from the Internet?”, the researcher may not get truthful responses. This tendency among respondents to “spin the truth” in order to portray themselves in a socially desirable manner is called social desirability bias, which hurts the validity of responses obtained from survey research. There is practically no way of overcoming social desirability bias in a questionnaire survey outsides of designing questions that minimize the opportunity for social desirability bias to arise. However, in an interview setting, an astute interviewer may be able to spot inconsistent answers and ask probing questions or use personal observations to supplement respondents’ comments.
Recall bias
Responses to survey questions often depend on subjects’ motivation, memory, and ability to respond. Particularly when dealing with events that happened in the distant past, respondents may not adequately remember their own motivations or behaviors, or perhaps their memory of such events may have evolved with time and are no longer retrievable. This phenomenon is know as recall bias . For instance, if a respondent is asked to describe their utilization of computer technology one year ago, their response may not be accurate due to difficulties with recall. One possible way of overcoming the recall bias is by anchoring the respondent’s memory in specific events as they happened, rather than asking them to recall their perceptions and motivations from memory.
Common method bias
Common method bias refers to the amount of spurious covariance shared between independent and dependent variables that are measured at the same point in time, such as in a cross-sectional survey, and using the same instrument, such as a questionnaire. In such cases, the phenomenon under investigation may not be adequately separated from measurement artifacts. Standard statistical tests are available to test for common method bias, such as Harmon’s single-factor test (Podsakoff et al. 2003) [7] , Lindell and Whitney’s (2001) [8] market variable technique, and so forth. This bias can be potentially avoided if the independent and dependent variables are measured at different points in time, using a longitudinal survey design, or if these variables are measured using different methods, such as computerized recording of dependent variable versus questionnaire-based self-rating of independent variables.
Social Science Research: Principles, Methods, and Practices. Authored by: Anol Bhattacherjee. Provided by: University of South Florida. Located at: http://scholarcommons.usf.edu/oa_textbooks/3/. License: CC BY-NC-SA: Attribution-NonCommercial-ShareAlike
- Survey research has several strengths, including being versatile, cost-effective, and familiar to participants.
- Survey research may be used to examine a variety of variables as well as comparing the relationship(s) between variables.
- Limitations of survey research include several types of bias (non-response bias, sampling bias, social desirability bias, recall bias, and common method bias).
- There are strategies to help reduce bias.
- After what you learned in this section, what might be some potential sources of bias in survey results on your topic? How might you minimize those?
- Engel, R. & Schutt. (2013). The practice of research in social work (3rd. ed.) . Thousand Oaks, CA: SAGE. ↵
- Merriam-Webster. (n.d.). Survey. In Merriam-Webster.com dictionary . Retrieved from https://www.merriam-webster.com/dictionary/survey ↵
- Nesje, K. (2016). Personality and professional commitment of students in nursing, social work, and teaching: A comparative survey. International Journal of Nursing Studies, 53 , 173-181. ↵
- Converse, J. M. (1987). Survey research in the United States: Roots and emergence, 1890–1960. Berkeley, CA: University of California Press. ↵
- Center for Disease Control and Prevention, CDC. (n.d.). Behavioral risk factor surveillance system. cdc.gov, https://www.cdc.gov/chronicdisease/resources/publications/factsheets/brfss.htm ↵
- Peterson, R. A. (2000). Constructing effective questionnaires. Thousand Oaks, CA: Sage ↵
- Podsakoff, P. M., MacKenzie, S. B., Lee, J. Y., & Podsakoff, N. P. (2003). Common method biases in behavioral research: a critical review of the literature and recommended remedies. Journal of Applied Psychology, 88 (5), 879. ↵
- Lindell, M. K., & Whitney, D. J. (2001). Accounting for common method variance in cross-sectional research designs. Journal of Applied Psychology, 86 (1), 114. ↵
The actual tool that collects data in survey research.
Those who are asked to contribute data in a research study; sometimes called respondents or subjects.
(as in generalization) to make claims about a large population based on a smaller sample of people or items
conducted during the early stages of a project, usually when a researcher wants to test the feasibility of conducting a more extensive study or if the topic has not been studied in the past
research that describes or defines a particular phenomenon
explains why particular phenomena work in the way that they do; answers “why” questions
entity that a researcher wants to say something about at the end of her study (individual, group, or organization)
Findings form a research study that apply to larger group of people (beyond the sample). Producing generalizable findings requires starting with a representative sample.
the list of people from which a researcher will draw her sample
Research that involves the use of data that represents human expression through words, pictures, movies, performance and other artifacts.
Research that collects data at one point in time.
Questionnaires that are distributed to participants (in person, by mail, virtually) and they are asked to complete them independently.
A detailed document that is used when a survey is read to a respondent that contains a list of questions and answer options that the researcher will read to respondents.
Biases are conscious or subconscious preferences that lead us to favor some things over others.
Testing out your research materials in advance on people who are not included as participants in your study.
An acronym, BRUSO for writing questions in survey research. The letters stand for: “brief,” “relevant,” “unambiguous,” “specific,” and “objective.”
Level of measurement that follows nominal level. Has mutually exclusive categories and a hierarchy (order).
A higher level of measurement. Denoted by having mutually exclusive categories, a hierarchy (order), and equal spacing between values. This last item means that values may be added, subtracted, divided, and multiplied.
The highest level of measurement. Denoted by mutually exclusive categories, a hierarchy (order), values can be added, subtracted, multiplied, and divided, and the presence of an absolute zero.
Mutually exclusive categories are options for closed ended questions that do not overlap.
The ability of a measurement tool to measure a phenomenon the same way, time after time. Note: Reliability does not imply validity.
Sampling bias is present when our sampling process results in a sample that does not represent our population in some way.
Social desirability bias occurs when we create questions that lead respondents to answer in ways that don't reflect their genuine thoughts or feelings to avoid being perceived negatively.
When respondents have difficult providing accurate answers to questions due to the passage of time.
Common method bias refers to the amount of spurious covariance shared between independent and dependent variables that are measured at the same point in time.
Graduate research methods in social work Copyright © 2020 by Matthew DeCarlo, Cory Cummings, Kate Agnelli is licensed under a Creative Commons Attribution-NonCommercial-ShareAlike 4.0 International License , except where otherwise noted.
Share This Book
- Subject List
- Take a Tour
- For Authors
- Subscriber Services
- Publications
- African American Studies
- African Studies
- American Literature
- Anthropology
- Architecture Planning and Preservation
- Art History
- Atlantic History
- Biblical Studies
- British and Irish Literature
- Childhood Studies
- Chinese Studies
- Cinema and Media Studies
- Communication
- Criminology
- Environmental Science
- Evolutionary Biology
- International Law
- International Relations
- Islamic Studies
- Jewish Studies
- Latin American Studies
- Latino Studies
- Linguistics
- Literary and Critical Theory
- Medieval Studies
- Military History
- Political Science
- Public Health
- Renaissance and Reformation
Social Work
- Urban Studies
- Victorian Literature
- Browse All Subjects
How to Subscribe
- Free Trials
In This Article Expand or collapse the "in this article" section Survey Research
Introduction.
- Cross-Cultural Research
- Self-Administered Paper/Pencil
- Interviewer-Administered Paper/Pencil
- Computer-Assisted
- Online or Electronic
Related Articles Expand or collapse the "related articles" section about
About related articles close popup.
Lorem Ipsum Sit Dolor Amet
Vestibulum ante ipsum primis in faucibus orci luctus et ultrices posuere cubilia Curae; Aliquam ligula odio, euismod ut aliquam et, vestibulum nec risus. Nulla viverra, arcu et iaculis consequat, justo diam ornare tellus, semper ultrices tellus nunc eu tellus.
- Assessing the Mental Health Needs of Older People
- Community-Needs Assessment
- Cultural Competence and Ethnic Sensitive Practice
- Evidence-based Social Work Practice
- Evidence-based Social Work Practice: Finding Evidence
- Experimental and Quasi-Experimental Designs
- Impact of Emerging Technology in Social Work Practice
- Interviewing
- Measurement, Scales, and Indices
- Psychometrics
- Qualitative Research
- Research Ethics
- Social Intervention Research
- Social Work Research Methods
Other Subject Areas
Forthcoming articles expand or collapse the "forthcoming articles" section.
- Abolitionist Perspectives in Social Work
- Randomized Controlled Trials in Social Work
- Social Work Practice with Transgender and Gender Expansive Youth
- Find more forthcoming articles...
- Export Citations
- Share This Facebook LinkedIn Twitter
Survey Research by Jorge Delva , Debora S. Tauiliili LAST REVIEWED: 30 July 2014 LAST MODIFIED: 30 July 2014 DOI: 10.1093/obo/9780195389678-0182
In its simplest term, a survey refers to the administration of questions to obtain information about people’s behaviors, attitudes, and beliefs about a topic. A survey may include a single question by asking, for example, if respondents approve of child spanking, or if they ever smoked cigarettes; or a survey may consist of a battery (a compilation) of questions to assess, measure, or determine, for example, whether the respondent has ever experienced depressive symptoms. When more than one question is asked, the set of questions is often referred to as an instrument or questionnaire. Questionnaires may include stand-alone questions and multiple questions about the same topic and constructs. Examples of stand-alone questions include asking someone to disclose his or her age or to describe his or her attitude toward abortion. Questionnaires may also include a measure, (a set of related questions that, when combined, may better assess the intended construct). Thousands of measures exist, and most can be found on the Internet. A survey can be administered once or repeatedly, to a handful of individuals or to hundreds of thousands, and it can be administered by mail, in person, by phone, email, Internet, or through mobile devices. A considerable amount of survey research in social work, and in several social science disciplines and allied fields (e.g., education and public health) is devoted to measuring a construct with a high degree of validity and reliability. Validity refers to ensuring that the question(s) do measure the construct they are purported to measure, and reliability refers to measuring the construct consistently. The authors’ experience is that most education about survey research in social work and the social sciences and allied disciplines focuses on measurement issues; there is less concern with best practices to draw samples that are representative of the larger population. The analytic methods that are needed to properly analyze these data also tend to be neglected. To address these gaps, in this annotated bibliography we review books, manuscripts, reports, and Internet sites on the administration and analyses of surveys that rely on samples drawn to be generalizable to the larger population. From time to time, we also provide examples of surveys conducted with samples that were not drawn to be representative of the larger populations to illustrate some aspect of survey research, data collection, or analytic methods, with some of the most nascent approaches such as those studies using real-time data capture and social media.
Healey 2002 , Henry 1990 , Kalton 1983 , and Rubin and Babbie 2014 provide excellent introductions to the various survey sampling and survey (or questionnaire) administration methods that survey researchers can use without relying on advanced statistical terms. Stone, et al. 2007 and Thyer 2010 include chapters on various sampling methods, but Lavrakas 2008 provides the most comprehensive coverage of survey methods and analytic approaches.
Healey, J. F. 2002. Statistics: A tool for social research . 2d ed. Belmont, CA: Wadsworth/Thomson Learning.
This book has a chapter that provides a clear introductory description of the concepts of sampling and sampling distribution for those interested in conducting survey research by drawing samples that can be representative of the general population.
Henry, G. T. 1990. Practical sampling . Newbury Park, CA: SAGE.
This book provides an easy-to-read description of various sampling strategies that can help the survey researcher draw representative samples, leading to the most precise estimate. It includes numerous examples of various sampling strategies. This book does not require advanced knowledge of statistics for the reader to get a general overview of representative samples.
Kalton, G. 1983. Introduction to survey sampling . Newbury, CA: SAGE.
This book also provides an easy-to-read description of various sampling strategies (proportionate and disproportionate stratification, cluster and multistage sampling, probability proportional to size sampling, sampling frames) as well as a description of nonresponse, sample size calculations, and survey analysis. This book will be of interest to those who desire to have a general knowledge of the ways survey research may be conducted with sampling methods that can generalize the findings of the survey to the larger population.
Lavrakas, P. J. ed. 2008. Encyclopedia of survey research methods . Thousand Oaks, CA: SAGE.
This encyclopedia, over one thousand pages with over 320 contributors, provides what is perhaps the most comprehensive and detailed coverage of survey research methods, covering a considerably wide range of methodological and statistical topics. Available online by subscription.
Rubin, A., and E. R. Babbie. 2014. Research methods for social work . Belmont, CA: Brooks/Cole.
This book includes chapters, with an excellent introduction to sampling methods with easy-to-follow examples. A chapter called “Survey Research” essentially refers to survey (or questionnaire) administration methods (interviews, self-administered Internet, telephone).
Stone, A. A., S. Shiffman, A. A. Atienza, and L. Nebeling, eds. 2007. The science of real-time data capture . New York: Oxford Univ. Press.
This edited book provides a comprehensive discussion and review of real-time data capture methods, focusing on one that is called ecological momentary assessment (EMA). This is an excellent book for anyone interested in detailed methodological and some statistical considerations of EMA.
Thyer, B. 2010. The handbook of social work research methods . 2d ed. Thousand Oaks, CA: SAGE.
This edited book includes a chapter, “Probability and Sampling” (pp. 37–50), that provides a clear description of the concept of probability and different types of sampling procedures (random, stratified, systematic), with easy-to-understand examples. Those with introductory knowledge of statistics will be able to more easily understand the basic statistical concepts that are included as part of the examples. However, those without statistical knowledge will still be able to gain an understanding of different sampling procedures.
back to top
Users without a subscription are not able to see the full content on this page. Please subscribe or login .
Oxford Bibliographies Online is available by subscription and perpetual access to institutions. For more information or to contact an Oxford Sales Representative click here .
- About Social Work »
- Meet the Editorial Board »
- Adolescent Depression
- Adolescent Pregnancy
- Adolescents
- Adoption Home Study Assessments
- Adult Protective Services in the United States
- African Americans
- Aging out of foster care
- Aging, Physical Health and
- Alcohol and Drug Abuse Problems
- Alcohol and Drug Problems, Prevention of Adolescent and Yo...
- Alcohol Problems: Practice Interventions
- Alcohol Use Disorder
- Alzheimer's Disease and Other Dementias
- Anti-Oppressive Practice
- Asian Americans
- Asian-American Youth
- Autism Spectrum Disorders
- Baccalaureate Social Workers
- Behavioral Health
- Behavioral Social Work Practice
- Bereavement Practice
- Bisexuality
- Brief Therapies in Social Work: Task-Centered Model and So...
- Bullying and Social Work Intervention
- Canadian Social Welfare, History of
- Case Management in Mental Health in the United States
- Central American Migration to the United States
- Child Maltreatment Prevention
- Child Neglect and Emotional Maltreatment
- Child Poverty
- Child Sexual Abuse
- Child Welfare
- Child Welfare and Child Protection in Europe, History of
- Child Welfare and Parents with Intellectual and/or Develop...
- Child Welfare Effectiveness
- Child Welfare, Immigration and
- Child Welfare Practice with LGBTQ Youth and Families
- Children of Incarcerated Parents
- Christianity and Social Work
- Chronic Illness
- Clinical Social Work Practice with Adult Lesbians
- Clinical Social Work Practice with Males
- Cognitive Behavior Therapies with Diverse and Stressed Pop...
- Cognitive Processing Therapy
- Cognitive-Behavioral Therapy
- Community Development
- Community Policing
- Community-Based Participatory Research
- Comparative Social Work
- Computational Social Welfare: Applying Data Science in Soc...
- Conflict Resolution
- Council on Social Work Education
- Counseling Female Offenders
- Criminal Justice
- Crisis Interventions
- Culture, Ethnicity, Substance Use, and Substance Use Disor...
- Dementia Care
- Dementia Care, Ethical Aspects of
- Depression and Cancer
- Development and Infancy (Birth to Age Three)
- Differential Response in Child Welfare
- Digital Storytelling for Social Work Interventions
- Direct Practice in Social Work
- Disabilities
- Disability and Disability Culture
- Domestic Violence Among Immigrants
- Early Pregnancy and Parenthood Among Child Welfare–Involve...
- Eating Disorders
- Ecological Framework
- Economic Evaluation
- Elder Mistreatment
- End-of-Life Decisions
- Epigenetics for Social Workers
- Ethical Issues in Social Work and Technology
- Ethics and Values in Social Work
- European Institutions and Social Work
- European Union, Justice and Home Affairs in the
- Evidence-based Social Work Practice: Issues, Controversies...
- Families with Gay, Lesbian, or Bisexual Parents
- Family Caregiving
- Family Group Conferencing
- Family Policy
- Family Services
- Family Therapy
- Family Violence
- Fathering Among Families Served By Child Welfare
- Fetal Alcohol Spectrum Disorders
- Field Education
- Financial Literacy and Social Work
- Financing Health-Care Delivery in the United States
- Forensic Social Work
- Foster Care
- Foster care and siblings
- Gender, Violence, and Trauma in Immigration Detention in t...
- Generalist Practice and Advanced Generalist Practice
- Grounded Theory
- Group Work across Populations, Challenges, and Settings
- Group Work, Research, Best Practices, and Evidence-based
- Harm Reduction
- Health Care Reform
- Health Disparities
- Health Social Work
- History of Social Work and Social Welfare, 1900–1950
- History of Social Work and Social Welfare, 1950-1980
- History of Social Work and Social Welfare, pre-1900
- History of Social Work from 1980-2014
- History of Social Work in China
- History of Social Work in Northern Ireland
- History of Social Work in the Republic of Ireland
- History of Social Work in the United Kingdom
- HIV/AIDS and Children
- HIV/AIDS Prevention with Adolescents
- Homelessness
- Homelessness: Ending Homelessness as a Grand Challenge
- Homelessness Outside the United States
- Human Needs
- Human Trafficking, Victims of
- Immigrant Integration in the United States
- Immigrant Policy in the United States
- Immigrants and Refugees
- Immigrants and Refugees: Evidence-based Social Work Practi...
- Immigration and Health Disparities
- Immigration and Intimate Partner Violence
- Immigration and Poverty
- Immigration and Spirituality
- Immigration and Substance Use
- Immigration and Trauma
- Impaired Professionals
- Implementation Science and Practice
- Indigenous Peoples
- Individual Placement and Support (IPS) Supported Employmen...
- In-home Child Welfare Services
- Intergenerational Transmission of Maltreatment
- International Human Trafficking
- International Social Welfare
- International Social Work
- International Social Work and Education
- International Social Work and Social Welfare in Southern A...
- Internet and Video Game Addiction
- Interpersonal Psychotherapy
- Intervention with Traumatized Populations
- Intimate-Partner Violence
- Juvenile Justice
- Kinship Care
- Korean Americans
- Latinos and Latinas
- Law, Social Work and the
- LGBTQ Populations and Social Work
- Mainland European Social Work, History of
- Major Depressive Disorder
- Management and Administration in Social Work
- Maternal Mental Health
- Medical Illness
- Men: Health and Mental Health Care
- Mental Health
- Mental Health Diagnosis and the Addictive Substance Disord...
- Mental Health Needs of Older People, Assessing the
- Mental Health Services from 1990 to 2023
- Mental Illness: Children
- Mental Illness: Elders
- Meta-analysis
- Microskills
- Middle East and North Africa, International Social Work an...
- Military Social Work
- Mixed Methods Research
- Moral distress and injury in social work
- Motivational Interviewing
- Multiculturalism
- Native Americans
- Native Hawaiians and Pacific Islanders
- Neighborhood Social Cohesion
- Neuroscience and Social Work
- Nicotine Dependence
- Occupational Social Work
- Organizational Development and Change
- Pain Management
- Palliative Care
- Palliative Care: Evolution and Scope of Practice
- Pandemics and Social Work
- Parent Training
- Personalization
- Person-in-Environment
- Philosophy of Science and Social Work
- Physical Disabilities
- Podcasts and Social Work
- Police Social Work
- Political Social Work in the United States
- Positive Youth Development
- Postmodernism and Social Work
- Postsecondary Education Experiences and Attainment Among Y...
- Post-Traumatic Stress Disorder (PTSD)
- Practice Interventions and Aging
- Practice Interventions with Adolescents
- Practice Research
- Primary Prevention in the 21st Century
- Productive Engagement of Older Adults
- Profession, Social Work
- Program Development and Grant Writing
- Promoting Smart Decarceration as a Grand Challenge
- Psychiatric Rehabilitation
- Psychoanalysis and Psychodynamic Theory
- Psychoeducation
- Psychopathology and Social Work Practice
- Psychopharmacology and Social Work Practice
- Psychosocial Framework
- Psychosocial Intervention with Women
- Psychotherapy and Social Work
- Race and Racism
- Readmission Policies in Europe
- Redefining Police Interactions with People Experiencing Me...
- Refugee Children, Unaccompanied Immigrant and
- Rehabilitation
- Religiously Affiliated Agencies
- Reproductive Health
- Restorative Justice
- Risk Assessment in Child Protection Services
- Risk Management in Social Work
- Rural Social Work in China
- Rural Social Work Practice
- School Social Work
- School Violence
- School-Based Delinquency Prevention
- Services and Programs for Pregnant and Parenting Youth
- Severe and Persistent Mental Illness: Adults
- Sexual and Gender Minority Immigrants, Refugees, and Asylu...
- Sexual Assault
- Single-System Research Designs
- Social and Economic Impact of US Immigration Policies on U...
- Social Development
- Social Insurance and Social Justice
- Social Justice and Social Work
- Social Movements
- Social Planning
- Social Policy
- Social Policy in Denmark
- Social Security in the United States (OASDHI)
- Social Work and Islam
- Social Work and Social Welfare in East, West, and Central ...
- Social Work and Social Welfare in Europe
- Social Work Education and Research
- Social Work Leadership
- Social Work Luminaries: Luminaries Contributing to the Cla...
- Social Work Luminaries: Luminaries contributing to the fou...
- Social Work Luminaries: Luminaries Who Contributed to Soci...
- Social Work Practice, Rare and Orphan Diseases and
- Social Work Regulation
- Social Work with Interpreters
- Solution-Focused Therapy
- Strategic Planning
- Strengths Perspective
- Strengths-Based Models in Social Work
- Supplemental Security Income
- Survey Research
- Sustainability: Creating Social Responses to a Changing En...
- Syrian Refugees in Turkey
- Systematic Review Methods
- Task-Centered Practice
- Technology Adoption in Social Work Education
- Technology for Social Work Interventions
- Technology, Human Relationships, and Human Interaction
- Technology in Social Work
- Terminal Illness
- The Impact of Systemic Racism on Latinxs’ Experiences with...
- Transdisciplinary Science
- Translational Science and Social Work
- Transnational Perspectives in Social Work
- Transtheoretical Model of Change
- Trauma-Informed Care
- Triangulation
- Tribal child welfare practice in the United States
- United States, History of Social Welfare in the
- Universal Basic Income
- Veteran Services
- Vicarious Trauma and Resilience in Social Work Practice wi...
- Vicarious Trauma Redefining PTSD
- Victim Services
- Virtual Reality and Social Work
- Welfare State Reform in France
- Welfare State Theory
- Women and Macro Social Work Practice
- Women's Health Care
- Work and Family in the German Welfare State
- Workforce Development of Social Workers Pre- and Post-Empl...
- Working with Non-Voluntary and Mandated Clients
- Young and Adolescent Lesbians
- Youth at Risk
- Youth Services
- Privacy Policy
- Cookie Policy
- Legal Notice
- Accessibility
Powered by:
- [81.177.182.159]
- 81.177.182.159

An official website of the United States government
The .gov means it’s official. Federal government websites often end in .gov or .mil. Before sharing sensitive information, make sure you’re on a federal government site.
The site is secure. The https:// ensures that you are connecting to the official website and that any information you provide is encrypted and transmitted securely.
- Publications
- Account settings
Preview improvements coming to the PMC website in October 2024. Learn More or Try it out now .
- Advanced Search
- Journal List
- J Adv Pract Oncol
- v.6(2); Mar-Apr 2015
Understanding and Evaluating Survey Research
A variety of methodologic approaches exist for individuals interested in conducting research. Selection of a research approach depends on a number of factors, including the purpose of the research, the type of research questions to be answered, and the availability of resources. The purpose of this article is to describe survey research as one approach to the conduct of research so that the reader can critically evaluate the appropriateness of the conclusions from studies employing survey research.
SURVEY RESEARCH
Survey research is defined as "the collection of information from a sample of individuals through their responses to questions" ( Check & Schutt, 2012, p. 160 ). This type of research allows for a variety of methods to recruit participants, collect data, and utilize various methods of instrumentation. Survey research can use quantitative research strategies (e.g., using questionnaires with numerically rated items), qualitative research strategies (e.g., using open-ended questions), or both strategies (i.e., mixed methods). As it is often used to describe and explore human behavior, surveys are therefore frequently used in social and psychological research ( Singleton & Straits, 2009 ).
Information has been obtained from individuals and groups through the use of survey research for decades. It can range from asking a few targeted questions of individuals on a street corner to obtain information related to behaviors and preferences, to a more rigorous study using multiple valid and reliable instruments. Common examples of less rigorous surveys include marketing or political surveys of consumer patterns and public opinion polls.
Survey research has historically included large population-based data collection. The primary purpose of this type of survey research was to obtain information describing characteristics of a large sample of individuals of interest relatively quickly. Large census surveys obtaining information reflecting demographic and personal characteristics and consumer feedback surveys are prime examples. These surveys were often provided through the mail and were intended to describe demographic characteristics of individuals or obtain opinions on which to base programs or products for a population or group.
More recently, survey research has developed into a rigorous approach to research, with scientifically tested strategies detailing who to include (representative sample), what and how to distribute (survey method), and when to initiate the survey and follow up with nonresponders (reducing nonresponse error), in order to ensure a high-quality research process and outcome. Currently, the term "survey" can reflect a range of research aims, sampling and recruitment strategies, data collection instruments, and methods of survey administration.
Given this range of options in the conduct of survey research, it is imperative for the consumer/reader of survey research to understand the potential for bias in survey research as well as the tested techniques for reducing bias, in order to draw appropriate conclusions about the information reported in this manner. Common types of error in research, along with the sources of error and strategies for reducing error as described throughout this article, are summarized in the Table .

Sources of Error in Survey Research and Strategies to Reduce Error
The goal of sampling strategies in survey research is to obtain a sufficient sample that is representative of the population of interest. It is often not feasible to collect data from an entire population of interest (e.g., all individuals with lung cancer); therefore, a subset of the population or sample is used to estimate the population responses (e.g., individuals with lung cancer currently receiving treatment). A large random sample increases the likelihood that the responses from the sample will accurately reflect the entire population. In order to accurately draw conclusions about the population, the sample must include individuals with characteristics similar to the population.
It is therefore necessary to correctly identify the population of interest (e.g., individuals with lung cancer currently receiving treatment vs. all individuals with lung cancer). The sample will ideally include individuals who reflect the intended population in terms of all characteristics of the population (e.g., sex, socioeconomic characteristics, symptom experience) and contain a similar distribution of individuals with those characteristics. As discussed by Mady Stovall beginning on page 162, Fujimori et al. ( 2014 ), for example, were interested in the population of oncologists. The authors obtained a sample of oncologists from two hospitals in Japan. These participants may or may not have similar characteristics to all oncologists in Japan.
Participant recruitment strategies can affect the adequacy and representativeness of the sample obtained. Using diverse recruitment strategies can help improve the size of the sample and help ensure adequate coverage of the intended population. For example, if a survey researcher intends to obtain a sample of individuals with breast cancer representative of all individuals with breast cancer in the United States, the researcher would want to use recruitment strategies that would recruit both women and men, individuals from rural and urban settings, individuals receiving and not receiving active treatment, and so on. Because of the difficulty in obtaining samples representative of a large population, researchers may focus the population of interest to a subset of individuals (e.g., women with stage III or IV breast cancer). Large census surveys require extremely large samples to adequately represent the characteristics of the population because they are intended to represent the entire population.
DATA COLLECTION METHODS
Survey research may use a variety of data collection methods with the most common being questionnaires and interviews. Questionnaires may be self-administered or administered by a professional, may be administered individually or in a group, and typically include a series of items reflecting the research aims. Questionnaires may include demographic questions in addition to valid and reliable research instruments ( Costanzo, Stawski, Ryff, Coe, & Almeida, 2012 ; DuBenske et al., 2014 ; Ponto, Ellington, Mellon, & Beck, 2010 ). It is helpful to the reader when authors describe the contents of the survey questionnaire so that the reader can interpret and evaluate the potential for errors of validity (e.g., items or instruments that do not measure what they are intended to measure) and reliability (e.g., items or instruments that do not measure a construct consistently). Helpful examples of articles that describe the survey instruments exist in the literature ( Buerhaus et al., 2012 ).
Questionnaires may be in paper form and mailed to participants, delivered in an electronic format via email or an Internet-based program such as SurveyMonkey, or a combination of both, giving the participant the option to choose which method is preferred ( Ponto et al., 2010 ). Using a combination of methods of survey administration can help to ensure better sample coverage (i.e., all individuals in the population having a chance of inclusion in the sample) therefore reducing coverage error ( Dillman, Smyth, & Christian, 2014 ; Singleton & Straits, 2009 ). For example, if a researcher were to only use an Internet-delivered questionnaire, individuals without access to a computer would be excluded from participation. Self-administered mailed, group, or Internet-based questionnaires are relatively low cost and practical for a large sample ( Check & Schutt, 2012 ).
Dillman et al. ( 2014 ) have described and tested a tailored design method for survey research. Improving the visual appeal and graphics of surveys by using a font size appropriate for the respondents, ordering items logically without creating unintended response bias, and arranging items clearly on each page can increase the response rate to electronic questionnaires. Attending to these and other issues in electronic questionnaires can help reduce measurement error (i.e., lack of validity or reliability) and help ensure a better response rate.
Conducting interviews is another approach to data collection used in survey research. Interviews may be conducted by phone, computer, or in person and have the benefit of visually identifying the nonverbal response(s) of the interviewee and subsequently being able to clarify the intended question. An interviewer can use probing comments to obtain more information about a question or topic and can request clarification of an unclear response ( Singleton & Straits, 2009 ). Interviews can be costly and time intensive, and therefore are relatively impractical for large samples.
Some authors advocate for using mixed methods for survey research when no one method is adequate to address the planned research aims, to reduce the potential for measurement and non-response error, and to better tailor the study methods to the intended sample ( Dillman et al., 2014 ; Singleton & Straits, 2009 ). For example, a mixed methods survey research approach may begin with distributing a questionnaire and following up with telephone interviews to clarify unclear survey responses ( Singleton & Straits, 2009 ). Mixed methods might also be used when visual or auditory deficits preclude an individual from completing a questionnaire or participating in an interview.
FUJIMORI ET AL.: SURVEY RESEARCH
Fujimori et al. ( 2014 ) described the use of survey research in a study of the effect of communication skills training for oncologists on oncologist and patient outcomes (e.g., oncologist’s performance and confidence and patient’s distress, satisfaction, and trust). A sample of 30 oncologists from two hospitals was obtained and though the authors provided a power analysis concluding an adequate number of oncologist participants to detect differences between baseline and follow-up scores, the conclusions of the study may not be generalizable to a broader population of oncologists. Oncologists were randomized to either an intervention group (i.e., communication skills training) or a control group (i.e., no training).
Fujimori et al. ( 2014 ) chose a quantitative approach to collect data from oncologist and patient participants regarding the study outcome variables. Self-report numeric ratings were used to measure oncologist confidence and patient distress, satisfaction, and trust. Oncologist confidence was measured using two instruments each using 10-point Likert rating scales. The Hospital Anxiety and Depression Scale (HADS) was used to measure patient distress and has demonstrated validity and reliability in a number of populations including individuals with cancer ( Bjelland, Dahl, Haug, & Neckelmann, 2002 ). Patient satisfaction and trust were measured using 0 to 10 numeric rating scales. Numeric observer ratings were used to measure oncologist performance of communication skills based on a videotaped interaction with a standardized patient. Participants completed the same questionnaires at baseline and follow-up.
The authors clearly describe what data were collected from all participants. Providing additional information about the manner in which questionnaires were distributed (i.e., electronic, mail), the setting in which data were collected (e.g., home, clinic), and the design of the survey instruments (e.g., visual appeal, format, content, arrangement of items) would assist the reader in drawing conclusions about the potential for measurement and nonresponse error. The authors describe conducting a follow-up phone call or mail inquiry for nonresponders, using the Dillman et al. ( 2014 ) tailored design for survey research follow-up may have reduced nonresponse error.
CONCLUSIONS
Survey research is a useful and legitimate approach to research that has clear benefits in helping to describe and explore variables and constructs of interest. Survey research, like all research, has the potential for a variety of sources of error, but several strategies exist to reduce the potential for error. Advanced practitioners aware of the potential sources of error and strategies to improve survey research can better determine how and whether the conclusions from a survey research study apply to practice.
The author has no potential conflicts of interest to disclose.

Want to create or adapt books like this? Learn more about how Pressbooks supports open publishing practices.
Part 2: Conceptualizing your research project
9. Writing your research question
Chapter outline.
- Empirical vs. ethical questions (4 minute read)
- Characteristics of a good research question (4 minute read)
- Quantitative research questions (7 minute read)
- Qualitative research questions (3 minute read)
- Evaluating and updating your research questions (4 minute read)
Content warning: examples in this chapter include references to sexual violence, sexism, substance use disorders, homelessness, domestic violence, the child welfare system, cissexism and heterosexism, and truancy and school discipline.
9.1 Empirical vs. ethical questions
Learning objectives.
Learners will be able to…
- Define empirical questions and provide an example
- Define ethical questions and provide an example
Writing a good research question is an art and a science. It is a science because you have to make sure it is clear, concise, and well-developed. It is an art because often your language needs “wordsmithing” to perfect and clarify the meaning. This is an exciting part of the research process; however, it can also be one of the most stressful.
Creating a good research question begins by identifying a topic you are interested in studying. At this point, you already have a working question. You’ve been applying it to the exercises in each chapter, and after reading more about your topic in the scholarly literature, you’ve probably gone back and revised your working question a few times. We’re going to continue that process in more detail in this chapter. Keep in mind that writing research questions is an iterative process, with revisions happening week after week until you are ready to start your project.
Empirical vs. ethical questions
When it comes to research questions, social science is best equipped to answer empirical questions —those that can be answered by real experience in the real world—as opposed to ethical questions —questions about which people have moral opinions and that may not be answerable in reference to the real world. While social workers have explicit ethical obligations (e.g., service, social justice), research projects ask empirical questions to help actualize and support the work of upholding those ethical principles.

In order to help you better understand the difference between ethical and empirical questions, let’s consider a topic about which people have moral opinions. How about SpongeBob SquarePants? [1] In early 2005, members of the conservative Christian group Focus on the Family (2005) [2] denounced this seemingly innocuous cartoon character as “morally offensive” because they perceived his character to be one that promotes a “pro-gay agenda.” Focus on the Family supported their claim that SpongeBob is immoral by citing his appearance in a children’s video designed to promote tolerance of all family forms (BBC News, 2005). [3] They also cited SpongeBob’s regular hand-holding with his male sidekick Patrick as further evidence of his immorality.
So, can we now conclude that SpongeBob SquarePants is immoral? Not so fast. While your mother or a newspaper or television reporter may provide an answer, a social science researcher cannot. Questions of morality are ethical, not empirical. Of course, this doesn’t mean that social science researchers cannot study opinions about or social meanings surrounding SpongeBob SquarePants (Carter, 2010). [4] We study humans after all, and as you will discover in the following chapters of this textbook, we are trained to utilize a variety of scientific data-collection techniques to understand patterns of human beliefs and behaviors. Using these techniques, we could find out how many people in the United States find SpongeBob morally reprehensible, but we could never learn, empirically, whether SpongeBob is in fact morally reprehensible.
Let’s consider an example from a recent MSW research class I taught. A student group wanted to research the penalties for sexual assault. Their original research question was: “How can prison sentences for sexual assault be so much lower than the penalty for drug possession?” Outside of the research context, that is a darn good question! It speaks to how the War on Drugs and the patriarchy have distorted the criminal justice system towards policing of drug crimes over gender-based violence.
Unfortunately, it is an ethical question, not an empirical one. To answer that question, you would have to draw on philosophy and morality, answering what it is about human nature and society that allows such unjust outcomes. However, you could not answer that question by gathering data about people in the real world. If I asked people that question, they would likely give me their opinions about drugs, gender-based violence, and the criminal justice system. But I wouldn’t get the real answer about why our society tolerates such an imbalance in punishment.
As the students worked on the project through the semester, they continued to focus on the topic of sexual assault in the criminal justice system. Their research question became more empirical because they read more empirical articles about their topic. One option that they considered was to evaluate intervention programs for perpetrators of sexual assault to see if they reduced the likelihood of committing sexual assault again. Another option they considered was seeing if counties or states with higher than average jail sentences for sexual assault perpetrators had lower rates of re-offense for sexual assault. These projects addressed the ethical question of punishing perpetrators of sexual violence but did so in a way that gathered and analyzed empirical real-world data. Our job as social work researchers is to gather social facts about social work issues, not to judge or determine morality.
Key Takeaways
- Empirical questions are distinct from ethical questions.
- There are usually a number of ethical questions and a number of empirical questions that could be asked about any single topic.
- While social workers may research topics about which people have moral opinions, a researcher’s job is to gather and analyze empirical data.
- Take a look at your working question. Make sure you have an empirical question, not an ethical one. To perform this check, describe how you could find an answer to your question by conducting a study, like a survey or focus group, with real people.
9.2 Characteristics of a good research question
- Identify and explain the key features of a good research question
- Explain why it is important for social workers to be focused and clear with the language they use in their research questions
Now that you’ve made sure your working question is empirical, you need to revise that working question into a formal research question. So, what makes a good research question? First, it is generally written in the form of a question. To say that your research question is “the opioid epidemic” or “animal assisted therapy” or “oppression” would not be correct. You need to frame your topic as a question, not a statement. A good research question is also one that is well-focused. A well-focused question helps you tune out irrelevant information and not try to answer everything about the world all at once. You could be the most eloquent writer in your class, or even in the world, but if the research question about which you are writing is unclear, your work will ultimately lack direction.
In addition to being written in the form of a question and being well-focused, a good research question is one that cannot be answered with a simple yes or no. For example, if your interest is in gender norms, you could ask, “Does gender affect a person’s performance of household tasks?” but you will have nothing left to say once you discover your yes or no answer. Instead, why not ask, about the relationship between gender and household tasks. Alternatively, maybe we are interested in how or to what extent gender affects a person’s contributions to housework in a marriage? By tweaking your question in this small way, you suddenly have a much more fascinating question and more to say as you attempt to answer it.
A good research question should also have more than one plausible answer. In the example above, the student who studied the relationship between gender and household tasks had a specific interest in the impact of gender, but she also knew that preferences might be impacted by other factors. For example, she knew from her own experience that her more traditional and socially conservative friends were more likely to see household tasks as part of the female domain, and were less likely to expect their male partners to contribute to those tasks. Thinking through the possible relationships between gender, culture, and household tasks led that student to realize that there were many plausible answers to her questions about how gender affects a person’s contribution to household tasks. Because gender doesn’t exist in a vacuum, she wisely felt that she needed to consider other characteristics that work together with gender to shape people’s behaviors, likes, and dislikes. By doing this, the student considered the third feature of a good research question–she thought about relationships between several concepts. While she began with an interest in a single concept—household tasks—by asking herself what other concepts (such as gender or political orientation) might be related to her original interest, she was able to form a question that considered the relationships among those concepts.
This student had one final component to consider. Social work research questions must contain a target population. Her study would be very different if she were to conduct it on older adults or immigrants who just arrived in a new country. The target population is the group of people whose needs your study addresses. Maybe the student noticed issues with household tasks as part of her social work practice with first-generation immigrants, and so she made it her target population. Maybe she wants to address the needs of another community. Whatever the case, the target population should be chosen while keeping in mind social work’s responsibility to work on behalf of marginalized and oppressed groups.
In sum, a good research question generally has the following features:
- It is written in the form of a question
- It is clearly written
- It cannot be answered with “yes” or “no”
- It has more than one plausible answer
- It considers relationships among multiple variables
- It is specific and clear about the concepts it addresses
- It includes a target population
- A poorly focused research question can lead to the demise of an otherwise well-executed study.
- Research questions should be clearly worded, consider relationships between multiple variables, have more than one plausible answer, and address the needs of a target population.
Okay, it’s time to write out your first draft of a research question.
- Once you’ve done so, take a look at the checklist in this chapter and see if your research question meets the criteria to be a good one.
Brainstorm whether your research question might be better suited to quantitative or qualitative methods.
- Describe why your question fits better with quantitative or qualitative methods.
- Provide an alternative research question that fits with the other type of research method.
9.3 Quantitative research questions
- Describe how research questions for exploratory, descriptive, and explanatory quantitative questions differ and how to phrase them
- Identify the differences between and provide examples of strong and weak explanatory research questions
Quantitative descriptive questions
The type of research you are conducting will impact the research question that you ask. Probably the easiest questions to think of are quantitative descriptive questions. For example, “What is the average student debt load of MSW students?” is a descriptive question—and an important one. We aren’t trying to build a causal relationship here. We’re simply trying to describe how much debt MSW students carry. Quantitative descriptive questions like this one are helpful in social work practice as part of community scans, in which human service agencies survey the various needs of the community they serve. If the scan reveals that the community requires more services related to housing, child care, or day treatment for people with disabilities, a nonprofit office can use the community scan to create new programs that meet a defined community need.
Quantitative descriptive questions will often ask for percentage, count the number of instances of a phenomenon, or determine an average. Descriptive questions may only include one variable, such as ours about student debt load, or they may include multiple variables. Because these are descriptive questions, our purpose is not to investigate causal relationships between variables. To do that, we need to use a quantitative explanatory question.

Quantitative explanatory questions
Most studies you read in the academic literature will be quantitative and explanatory. Why is that? If you recall from Chapter 2 , explanatory research tries to build nomothetic causal relationships. They are generalizable across space and time, so they are applicable to a wide audience. The editorial board of a journal wants to make sure their content will be useful to as many people as possible, so it’s not surprising that quantitative research dominates the academic literature.
Structurally, quantitative explanatory questions must contain an independent variable and dependent variable. Questions should ask about the relationship between these variables. The standard format I was taught in graduate school for an explanatory quantitative research question is: “What is the relationship between [independent variable] and [dependent variable] for [target population]?” You should play with the wording for your research question, revising that standard format to match what you really want to know about your topic.
Let’s take a look at a few more examples of possible research questions and consider the relative strengths and weaknesses of each. Table 9.1 does just that. While reading the table, keep in mind that I have only noted what I view to be the most relevant strengths and weaknesses of each question. Certainly each question may have additional strengths and weaknesses not noted in the table. Each of these questions is drawn from student projects in my research methods classes and reflects the work of many students on their research question over many weeks.
| What are the internal and external effects/problems associated with children witnessing domestic violence? | Written as a question | Not clearly focused | How does witnessing domestic violence impact a child’s romantic relationships in adulthood? |
| Considers relationships among multiple concepts | Not specific and clear about the concepts it addresses | ||
| Contains a population | |||
| What causes foster children who are transitioning to adulthood to become homeless, jobless, pregnant, unhealthy, etc.? | Considers relationships among multiple concepts | Concepts are not specific and clear | What is the relationship between sexual orientation or gender identity and homelessness for late adolescents in foster care? |
| Contains a population | |||
| Not written as a yes/no question | |||
| How does income inequality predict ambivalence in the Stereo Content Model using major U.S. cities as target populations? | Written as a question | Unclear wording | How does income inequality affect ambivalence in high-density urban areas? |
| Considers relationships among multiple concepts | Population is unclear | ||
| Why are mental health rates higher in white foster children than African Americans and other races? | Written as a question | Concepts are not clear | How does race impact rates of mental health diagnosis for children in foster care? |
| Not written as a yes/no question | Does not contain a target population |
Making it more specific
A good research question should also be specific and clear about the concepts it addresses. A student investigating gender and household tasks knows what they mean by “household tasks.” You likely also have an impression of what “household tasks” means. But are your definition and the student’s definition the same? A participant in their study may think that managing finances and performing home maintenance are household tasks, but the researcher may be interested in other tasks like childcare or cleaning. The only way to ensure your study stays focused and clear is to be specific about what you mean by a concept. The student in our example could pick a specific household task that was interesting to them or that the literature indicated was important—for example, childcare. Or, the student could have a broader view of household tasks, one that encompasses childcare, food preparation, financial management, home repair, and care for relatives. Any option is probably okay, as long as the researcher is clear on what they mean by “household tasks.” Clarifying these distinctions is important as we look ahead to specifying how your variables will be measured in Chapter 11 .
Table 9.2 contains some “watch words” that indicate you may need to be more specific about the concepts in your research question.
| Factors, Causes, Effects, Outcomes | What causes or effects are you interested in? What causes and effects are important, based on the literature in your topic area? Try to choose one or a handful you consider to be the most important. |
| Effective, Effectiveness, Useful, Efficient | Effective at doing what? Effectiveness is meaningless on its own. What outcome should the program or intervention have? Reduced symptoms of a mental health issue? Better socialization? |
| Etc., and so forth | Don’t assume that your reader understands what you mean by “and so forth.” Remember that focusing on two or a small handful concepts is necessary. Your study cannot address everything about a social problem, though the results will likely have implications on other aspects of the social world. |
It can be challenging to be this specific in social work research, particularly when you are just starting out your project and still reading the literature. If you’ve only read one or two articles on your topic, it can be hard to know what you are interested in studying. Broad questions like “What are the causes of chronic homelessness, and what can be done to prevent it?” are common at the beginning stages of a research project as working questions. However, moving from working questions to research questions in your research proposal requires that you examine the literature on the topic and refine your question over time to be more specific and clear. Perhaps you want to study the effect of a specific anti-homelessness program that you found in the literature. Maybe there is a particular model to fighting homelessness, like Housing First or transitional housing, that you want to investigate further. You may want to focus on a potential cause of homelessness such as LGBTQ+ discrimination that you find interesting or relevant to your practice. As you can see, the possibilities for making your question more specific are almost infinite.
Quantitative exploratory questions
In exploratory research, the researcher doesn’t quite know the lay of the land yet. If someone is proposing to conduct an exploratory quantitative project, the watch words highlighted in Table 9.2 are not problematic at all. In fact, questions such as “What factors influence the removal of children in child welfare cases?” are good because they will explore a variety of factors or causes. In this question, the independent variable is less clearly written, but the dependent variable, family preservation outcomes, is quite clearly written. The inverse can also be true. If we were to ask, “What outcomes are associated with family preservation services in child welfare?”, we would have a clear independent variable, family preservation services, but an unclear dependent variable, outcomes. Because we are only conducting exploratory research on a topic, we may not have an idea of what concepts may comprise our “outcomes” or “factors.” Only after interacting with our participants will we be able to understand which concepts are important.
Remember that exploratory research is appropriate only when the researcher does not know much about topic because there is very little scholarly research. In our examples above, there is extensive literature on the outcomes in family reunification programs and risk factors for child removal in child welfare. Make sure you’ve done a thorough literature review to ensure there is little relevant research to guide you towards a more explanatory question.
- Descriptive quantitative research questions are helpful for community scans but cannot investigate causal relationships between variables.
- Explanatory quantitative research questions must include an independent and dependent variable.
- Exploratory quantitative research questions should only be considered when there is very little previous research on your topic.
- Identify the type of research you are engaged in (descriptive, explanatory, or exploratory).
- Create a quantitative research question for your project that matches with the type of research you are engaged in.
Preferably, you should be creating an explanatory research question for quantitative research.
9.4 Qualitative research questions
- List the key terms associated with qualitative research questions
- Distinguish between qualitative and quantitative research questions
Qualitative research questions differ from quantitative research questions. Because qualitative research questions seek to explore or describe phenomena, not provide a neat nomothetic explanation, they are often more general and openly worded. They may include only one concept, though many include more than one. Instead of asking how one variable causes changes in another, we are instead trying to understand the experiences , understandings , and meanings that people have about the concepts in our research question. These keywords often make an appearance in qualitative research questions.
Let’s work through an example from our last section. In Table 9.1, a student asked, “What is the relationship between sexual orientation or gender identity and homelessness for late adolescents in foster care?” In this question, it is pretty clear that the student believes that adolescents in foster care who identify as LGBTQ+ may be at greater risk for homelessness. This is a nomothetic causal relationship—LGBTQ+ status causes changes in homelessness.
However, what if the student were less interested in predicting homelessness based on LGBTQ+ status and more interested in understanding the stories of foster care youth who identify as LGBTQ+ and may be at risk for homelessness? In that case, the researcher would be building an idiographic causal explanation . The youths whom the researcher interviews may share stories of how their foster families, caseworkers, and others treated them. They may share stories about how they thought of their own sexuality or gender identity and how it changed over time. They may have different ideas about what it means to transition out of foster care.

Because qualitative questions usually center on idiographic causal relationships, they look different than quantitative questions. Table 9.3 below takes the final research questions from Table 9.1 and adapts them for qualitative research. The guidelines for research questions previously described in this chapter still apply, but there are some new elements to qualitative research questions that are not present in quantitative questions.
- Qualitative research questions often ask about lived experience, personal experience, understanding, meaning, and stories.
- Qualitative research questions may be more general and less specific.
- Qualitative research questions may also contain only one variable, rather than asking about relationships between multiple variables.
| How does witnessing domestic violence impact a child’s romantic relationships in adulthood? | How do people who witness domestic violence understand its effects on their current relationships? |
| What is the relationship between sexual orientation or gender identity and homelessness for late adolescents in foster care? | What is the experience of identifying as LGBTQ+ in the foster care system? |
| How does income inequality affect ambivalence in high-density urban areas? | What does racial ambivalence mean to residents of an urban neighborhood with high income inequality? |
| How does race impact rates of mental health diagnosis for children in foster care? | How do African-Americans experience seeking help for mental health concerns? |
Qualitative research questions have one final feature that distinguishes them from quantitative research questions: they can change over the course of a study. Qualitative research is a reflexive process, one in which the researcher adapts their approach based on what participants say and do. The researcher must constantly evaluate whether their question is important and relevant to the participants. As the researcher gains information from participants, it is normal for the focus of the inquiry to shift.
For example, a qualitative researcher may want to study how a new truancy rule impacts youth at risk of expulsion. However, after interviewing some of the youth in their community, a researcher might find that the rule is actually irrelevant to their behavior and thoughts. Instead, their participants will direct the discussion to their frustration with the school administrators or the lack of job opportunities in the area. This is a natural part of qualitative research, and it is normal for research questions and hypothesis to evolve based on information gleaned from participants.
However, this reflexivity and openness unacceptable in quantitative research for good reasons. Researchers using quantitative methods are testing a hypothesis, and if they could revise that hypothesis to match what they found, they could never be wrong! Indeed, an important component of open science and reproducability is the preregistration of a researcher’s hypotheses and data analysis plan in a central repository that can be verified and replicated by reviewers and other researchers. This interactive graphic from 538 shows how an unscrupulous research could come up with a hypothesis and theoretical explanation after collecting data by hunting for a combination of factors that results in a statistically significant relationship. This is an excellent example of how the positivist assumptions behind quantitative research and intepretivist assumptions behind qualitative research result in different approaches to social science.
- Qualitative research questions often contain words or phrases like “lived experience,” “personal experience,” “understanding,” “meaning,” and “stories.”
- Qualitative research questions can change and evolve over the course of the study.
- Using the guidance in this chapter, write a qualitative research question. You may want to use some of the keywords mentioned above.
9.5 Evaluating and updating your research questions
- Evaluate the feasibility and importance of your research questions
- Begin to match your research questions to specific designs that determine what the participants in your study will do
Feasibility and importance
As you are getting ready to finalize your research question and move into designing your research study, it is important to check whether your research question is feasible for you to answer and what importance your results will have in the community, among your participants, and in the scientific literature
Key questions to consider when evaluating your question’s feasibility include:
- Do you have access to the data you need?
- Will you be able to get consent from stakeholders, gatekeepers, and others?
- Does your project pose risk to individuals through direct harm, dual relationships, or breaches in confidentiality? (see Chapter 6 for more ethical considerations)
- Are you competent enough to complete the study?
- Do you have the resources and time needed to carry out the project?
Key questions to consider when evaluating the importance of your question include:
- Can we answer your research question simply by looking at the literature on your topic?
- How does your question add something new to the scholarly literature? (raises a new issue, addresses a controversy, studies a new population, etc.)
- How will your target population benefit, once you answer your research question?
- How will the community, social work practice, and the broader social world benefit, once you answer your research question?
- Using the questions above, check whether you think your project is feasible for you to complete, given the constrains that student projects face.
- Realistically, explore the potential impact of your project on the community and in the scientific literature. Make sure your question cannot be answered by simply reading more about your topic.
Matching your research question and study design
This chapter described how to create a good quantitative and qualitative research question. In Parts 3 and 4 of this textbook, we will detail some of the basic designs like surveys and interviews that social scientists use to answer their research questions. But which design should you choose?
As with most things, it all depends on your research question. If your research question involves, for example, testing a new intervention, you will likely want to use an experimental design. On the other hand, if you want to know the lived experience of people in a public housing building, you probably want to use an interview or focus group design.
We will learn more about each one of these designs in the remainder of this textbook. We will also learn about using data that already exists, studying an individual client inside clinical practice, and evaluating programs, which are other examples of designs. Below is a list of designs we will cover in this textbook:
- Surveys: online, phone, mail, in-person
- Experiments: classic, pre-experiments, quasi-experiments
- Interviews: in-person or via phone or videoconference
- Focus groups: in-person or via videoconference
- Content analysis of existing data
- Secondary data analysis of another researcher’s data
- Program evaluation
The design of your research study determines what you and your participants will do. In an experiment, for example, the researcher will introduce a stimulus or treatment to participants and measure their responses. In contrast, a content analysis may not have participants at all, and the researcher may simply read the marketing materials for a corporation or look at a politician’s speeches to conduct the data analysis for the study.
I imagine that a content analysis probably seems easier to accomplish than an experiment. However, as a researcher, you have to choose a research design that makes sense for your question and that is feasible to complete with the resources you have. All research projects require some resources to accomplish. Make sure your design is one you can carry out with the resources (time, money, staff, etc.) that you have.
There are so many different designs that exist in the social science literature that it would be impossible to include them all in this textbook. The purpose of the subsequent chapters is to help you understand the basic designs upon which these more advanced designs are built. As you learn more about research design, you will likely find yourself revising your research question to make sure it fits with the design. At the same time, your research question as it exists now should influence the design you end up choosing. There is no set order in which these should happen. Instead, your research project should be guided by whether you can feasibly carry it out and contribute new and important knowledge to the world.
- Research questions must be feasible and important.
- Research questions must match study design.
- Based on what you know about designs like surveys, experiments, and interviews, describe how you might use one of them to answer your research question.
- You may want to refer back to Chapter 2 which discusses how to get raw data about your topic and the common designs used in student research projects.
Media Attributions
- patrick-starfish-2062906_1920 © Inspired Images is licensed under a CC0 (Creative Commons Zero) license
- financial-2860753_1920 © David Schwarzenberg is licensed under a CC0 (Creative Commons Zero) license
- target-group-3460039_1920 © Gerd Altmann is licensed under a CC0 (Creative Commons Zero) license
- Not familiar with SpongeBob SquarePants? You can learn more about him on Nickelodeon’s site dedicated to all things SpongeBob: http://www.nick.com/spongebob-squarepants/ ↵
- Focus on the Family. (2005, January 26). Focus on SpongeBob. Christianity Today . Retrieved from http://www.christianitytoday.com/ct/2005/januaryweb-only/34.0c.html ↵
- BBC News. (2005, January 20). US right attacks SpongeBob video. Retrieved from: http://news.bbc.co.uk/2/hi/americas/4190699.stm ↵
- In fact, an MA thesis examines representations of gender and relationships in the cartoon: Carter, A. C. (2010). Constructing gender and relationships in “SpongeBob SquarePants”: Who lives in a pineapple under the sea . MA thesis, Department of Communication, University of South Alabama, Mobile, AL. ↵
research questions that can be answered by systematically observing the real world
unsuitable research questions which are not answerable by systematic observation of the real world but instead rely on moral or philosophical opinions
the group of people whose needs your study addresses
attempts to explain or describe your phenomenon exhaustively, based on the subjective understandings of your participants
"Assuming that the null hypothesis is true and the study is repeated an infinite number times by drawing random samples from the same populations(s), less than 5% of these results will be more extreme than the current result" (Cassidy et al., 2019, p. 233).
whether you can practically and ethically complete the research project you propose
the impact your study will have on participants, communities, scientific knowledge, and social justice
Graduate research methods in social work Copyright © 2021 by Matthew DeCarlo, Cory Cummings, Kate Agnelli is licensed under a Creative Commons Attribution-NonCommercial-ShareAlike 4.0 International License , except where otherwise noted.
Share This Book
Social Work Research Methods That Drive the Practice

Social workers advocate for the well-being of individuals, families and communities. But how do social workers know what interventions are needed to help an individual? How do they assess whether a treatment plan is working? What do social workers use to write evidence-based policy?
Social work involves research-informed practice and practice-informed research. At every level, social workers need to know objective facts about the populations they serve, the efficacy of their interventions and the likelihood that their policies will improve lives. A variety of social work research methods make that possible.
Data-Driven Work
Data is a collection of facts used for reference and analysis. In a field as broad as social work, data comes in many forms.
Quantitative vs. Qualitative
As with any research, social work research involves both quantitative and qualitative studies.
Quantitative Research
Answers to questions like these can help social workers know about the populations they serve — or hope to serve in the future.
- How many students currently receive reduced-price school lunches in the local school district?
- How many hours per week does a specific individual consume digital media?
- How frequently did community members access a specific medical service last year?
Quantitative data — facts that can be measured and expressed numerically — are crucial for social work.
Quantitative research has advantages for social scientists. Such research can be more generalizable to large populations, as it uses specific sampling methods and lends itself to large datasets. It can provide important descriptive statistics about a specific population. Furthermore, by operationalizing variables, it can help social workers easily compare similar datasets with one another.
Qualitative Research
Qualitative data — facts that cannot be measured or expressed in terms of mere numbers or counts — offer rich insights into individuals, groups and societies. It can be collected via interviews and observations.
- What attitudes do students have toward the reduced-price school lunch program?
- What strategies do individuals use to moderate their weekly digital media consumption?
- What factors made community members more or less likely to access a specific medical service last year?
Qualitative research can thereby provide a textured view of social contexts and systems that may not have been possible with quantitative methods. Plus, it may even suggest new lines of inquiry for social work research.
Mixed Methods Research
Combining quantitative and qualitative methods into a single study is known as mixed methods research. This form of research has gained popularity in the study of social sciences, according to a 2019 report in the academic journal Theory and Society. Since quantitative and qualitative methods answer different questions, merging them into a single study can balance the limitations of each and potentially produce more in-depth findings.
However, mixed methods research is not without its drawbacks. Combining research methods increases the complexity of a study and generally requires a higher level of expertise to collect, analyze and interpret the data. It also requires a greater level of effort, time and often money.
The Importance of Research Design
Data-driven practice plays an essential role in social work. Unlike philanthropists and altruistic volunteers, social workers are obligated to operate from a scientific knowledge base.
To know whether their programs are effective, social workers must conduct research to determine results, aggregate those results into comprehensible data, analyze and interpret their findings, and use evidence to justify next steps.
Employing the proper design ensures that any evidence obtained during research enables social workers to reliably answer their research questions.
Research Methods in Social Work
The various social work research methods have specific benefits and limitations determined by context. Common research methods include surveys, program evaluations, needs assessments, randomized controlled trials, descriptive studies and single-system designs.
Surveys involve a hypothesis and a series of questions in order to test that hypothesis. Social work researchers will send out a survey, receive responses, aggregate the results, analyze the data, and form conclusions based on trends.
Surveys are one of the most common research methods social workers use — and for good reason. They tend to be relatively simple and are usually affordable. However, surveys generally require large participant groups, and self-reports from survey respondents are not always reliable.
Program Evaluations
Social workers ally with all sorts of programs: after-school programs, government initiatives, nonprofit projects and private programs, for example.
Crucially, social workers must evaluate a program’s effectiveness in order to determine whether the program is meeting its goals and what improvements can be made to better serve the program’s target population.
Evidence-based programming helps everyone save money and time, and comparing programs with one another can help social workers make decisions about how to structure new initiatives. Evaluating programs becomes complicated, however, when programs have multiple goal metrics, some of which may be vague or difficult to assess (e.g., “we aim to promote the well-being of our community”).
Needs Assessments
Social workers use needs assessments to identify services and necessities that a population lacks access to.
Common social work populations that researchers may perform needs assessments on include:
- People in a specific income group
- Everyone in a specific geographic region
- A specific ethnic group
- People in a specific age group
In the field, a social worker may use a combination of methods (e.g., surveys and descriptive studies) to learn more about a specific population or program. Social workers look for gaps between the actual context and a population’s or individual’s “wants” or desires.
For example, a social worker could conduct a needs assessment with an individual with cancer trying to navigate the complex medical-industrial system. The social worker may ask the client questions about the number of hours they spend scheduling doctor’s appointments, commuting and managing their many medications. After learning more about the specific client needs, the social worker can identify opportunities for improvements in an updated care plan.
In policy and program development, social workers conduct needs assessments to determine where and how to effect change on a much larger scale. Integral to social work at all levels, needs assessments reveal crucial information about a population’s needs to researchers, policymakers and other stakeholders. Needs assessments may fall short, however, in revealing the root causes of those needs (e.g., structural racism).
Randomized Controlled Trials
Randomized controlled trials are studies in which a randomly selected group is subjected to a variable (e.g., a specific stimulus or treatment) and a control group is not. Social workers then measure and compare the results of the randomized group with the control group in order to glean insights about the effectiveness of a particular intervention or treatment.
Randomized controlled trials are easily reproducible and highly measurable. They’re useful when results are easily quantifiable. However, this method is less helpful when results are not easily quantifiable (i.e., when rich data such as narratives and on-the-ground observations are needed).
Descriptive Studies
Descriptive studies immerse the researcher in another context or culture to study specific participant practices or ways of living. Descriptive studies, including descriptive ethnographic studies, may overlap with and include other research methods:
- Informant interviews
- Census data
- Observation
By using descriptive studies, researchers may glean a richer, deeper understanding of a nuanced culture or group on-site. The main limitations of this research method are that it tends to be time-consuming and expensive.
Single-System Designs
Unlike most medical studies, which involve testing a drug or treatment on two groups — an experimental group that receives the drug/treatment and a control group that does not — single-system designs allow researchers to study just one group (e.g., an individual or family).
Single-system designs typically entail studying a single group over a long period of time and may involve assessing the group’s response to multiple variables.
For example, consider a study on how media consumption affects a person’s mood. One way to test a hypothesis that consuming media correlates with low mood would be to observe two groups: a control group (no media) and an experimental group (two hours of media per day). When employing a single-system design, however, researchers would observe a single participant as they watch two hours of media per day for one week and then four hours per day of media the next week.
These designs allow researchers to test multiple variables over a longer period of time. However, similar to descriptive studies, single-system designs can be fairly time-consuming and costly.
Learn More About Social Work Research Methods
Social workers have the opportunity to improve the social environment by advocating for the vulnerable — including children, older adults and people with disabilities — and facilitating and developing resources and programs.
Learn more about how you can earn your Master of Social Work online at Virginia Commonwealth University . The highest-ranking school of social work in Virginia, VCU has a wide range of courses online. That means students can earn their degrees with the flexibility of learning at home. Learn more about how you can take your career in social work further with VCU.
From M.S.W. to LCSW: Understanding Your Career Path as a Social Worker
How Palliative Care Social Workers Support Patients With Terminal Illnesses
How to Become a Social Worker in Health Care
Gov.uk, Mixed Methods Study
MVS Open Press, Foundations of Social Work Research
Open Social Work Education, Scientific Inquiry in Social Work
Open Social Work, Graduate Research Methods in Social Work: A Project-Based Approach
Routledge, Research for Social Workers: An Introduction to Methods
SAGE Publications, Research Methods for Social Work: A Problem-Based Approach
Theory and Society, Mixed Methods Research: What It Is and What It Could Be
READY TO GET STARTED WITH OUR ONLINE M.S.W. PROGRAM FORMAT?
Bachelor’s degree is required.
VCU Program Helper
This AI chatbot provides automated responses, which may not always be accurate. By continuing with this conversation, you agree that the contents of this chat session may be transcribed and retained. You also consent that this chat session and your interactions, including cookie usage, are subject to our privacy policy .
S371 Social Work Research - Jill Chonody: What is Quantitative Research?
- Choosing a Topic
- Choosing Search Terms
- What is Quantitative Research?
- Requesting Materials
Quantitative Research in the Social Sciences
This page is courtesy of University of Southern California: http://libguides.usc.edu/content.php?pid=83009&sid=615867
Quantitative methods emphasize objective measurements and the statistical, mathematical, or numerical analysis of data collected through polls, questionnaires, and surveys, or by manipulating pre-existing statistical data using computational techniques . Quantitative research focuses on gathering numerical data and generalizing it across groups of people or to explain a particular phenomenon.
Babbie, Earl R. The Practice of Social Research . 12th ed. Belmont, CA: Wadsworth Cengage, 2010; Muijs, Daniel. Doing Quantitative Research in Education with SPSS . 2nd edition. London: SAGE Publications, 2010.
Characteristics of Quantitative Research
Your goal in conducting quantitative research study is to determine the relationship between one thing [an independent variable] and another [a dependent or outcome variable] within a population. Quantitative research designs are either descriptive [subjects usually measured once] or experimental [subjects measured before and after a treatment]. A descriptive study establishes only associations between variables; an experimental study establishes causality.
Quantitative research deals in numbers, logic, and an objective stance. Quantitative research focuses on numberic and unchanging data and detailed, convergent reasoning rather than divergent reasoning [i.e., the generation of a variety of ideas about a research problem in a spontaneous, free-flowing manner].
Its main characteristics are :
- The data is usually gathered using structured research instruments.
- The results are based on larger sample sizes that are representative of the population.
- The research study can usually be replicated or repeated, given its high reliability.
- Researcher has a clearly defined research question to which objective answers are sought.
- All aspects of the study are carefully designed before data is collected.
- Data are in the form of numbers and statistics, often arranged in tables, charts, figures, or other non-textual forms.
- Project can be used to generalize concepts more widely, predict future results, or investigate causal relationships.
- Researcher uses tools, such as questionnaires or computer software, to collect numerical data.
The overarching aim of a quantitative research study is to classify features, count them, and construct statistical models in an attempt to explain what is observed.
Things to keep in mind when reporting the results of a study using quantiative methods :
- Explain the data collected and their statistical treatment as well as all relevant results in relation to the research problem you are investigating. Interpretation of results is not appropriate in this section.
- Report unanticipated events that occurred during your data collection. Explain how the actual analysis differs from the planned analysis. Explain your handling of missing data and why any missing data does not undermine the validity of your analysis.
- Explain the techniques you used to "clean" your data set.
- Choose a minimally sufficient statistical procedure ; provide a rationale for its use and a reference for it. Specify any computer programs used.
- Describe the assumptions for each procedure and the steps you took to ensure that they were not violated.
- When using inferential statistics , provide the descriptive statistics, confidence intervals, and sample sizes for each variable as well as the value of the test statistic, its direction, the degrees of freedom, and the significance level [report the actual p value].
- Avoid inferring causality , particularly in nonrandomized designs or without further experimentation.
- Use tables to provide exact values ; use figures to convey global effects. Keep figures small in size; include graphic representations of confidence intervals whenever possible.
- Always tell the reader what to look for in tables and figures .
NOTE: When using pre-existing statistical data gathered and made available by anyone other than yourself [e.g., government agency], you still must report on the methods that were used to gather the data and describe any missing data that exists and, if there is any, provide a clear explanation why the missing datat does not undermine the validity of your final analysis.
Babbie, Earl R. The Practice of Social Research . 12th ed. Belmont, CA: Wadsworth Cengage, 2010; Brians, Craig Leonard et al. Empirical Political Analysis: Quantitative and Qualitative Research Methods . 8th ed. Boston, MA: Longman, 2011; McNabb, David E. Research Methods in Public Administration and Nonprofit Management: Quantitative and Qualitative Approaches . 2nd ed. Armonk, NY: M.E. Sharpe, 2008; Quantitative Research Methods . Writing@CSU. Colorado State University; Singh, Kultar. Quantitative Social Research Methods . Los Angeles, CA: Sage, 2007.
Basic Research Designs for Quantitative Studies
Before designing a quantitative research study, you must decide whether it will be descriptive or experimental because this will dictate how you gather, analyze, and interpret the results. A descriptive study is governed by the following rules: subjects are generally measured once; the intention is to only establish associations between variables; and, the study may include a sample population of hundreds or thousands of subjects to ensure that a valid estimate of a generalized relationship between variables has been obtained. An experimental design includes subjects measured before and after a particular treatment, the sample population may be very small and purposefully chosen, and it is intended to establish causality between variables. Introduction The introduction to a quantitative study is usually written in the present tense and from the third person point of view. It covers the following information:
- Identifies the research problem -- as with any academic study, you must state clearly and concisely the research problem being investigated.
- Reviews the literature -- review scholarship on the topic, synthesizing key themes and, if necessary, noting studies that have used similar methods of inquiry and analysis. Note where key gaps exist and how your study helps to fill these gaps or clarifies existing knowledge.
- Describes the theoretical framework -- provide an outline of the theory or hypothesis underpinning your study. If necessary, define unfamiliar or complex terms, concepts, or ideas and provide the appropriate background information to place the research problem in proper context [e.g., historical, cultural, economic, etc.].
Methodology The methods section of a quantitative study should describe how each objective of your study will be achieved. Be sure to provide enough detail to enable the reader can make an informed assessment of the methods being used to obtain results associated with the research problem. The methods section should be presented in the past tense.
- Study population and sampling -- where did the data come from; how robust is it; note where gaps exist or what was excluded. Note the procedures used for their selection;
- Data collection – describe the tools and methods used to collect information and identify the variables being measured; describe the methods used to obtain the data; and, note if the data was pre-existing [i.e., government data] or you gathered it yourself. If you gathered it yourself, describe what type of instrument you used and why. Note that no data set is perfect--describe any limitations in methods of gathering data.
- Data analysis -- describe the procedures for processing and analyzing the data. If appropriate, describe the specific instruments of analysis used to study each research objective, including mathematical techniques and the type of computer software used to manipulate the data.
Results The finding of your study should be written objectively and in a succinct and precise format. In quantitative studies, it is common to use graphs, tables, charts, and other non-textual elements to help the reader understand the data. Make sure that non-textual elements do not stand in isolation from the text but are being used to supplement the overall description of the results and to help clarify key points being made. Further information about how to effectively present data using charts and graphs can be found here .
- Statistical analysis -- how did you analyze the data? What were the key findings from the data? The findings should be present in a logical, sequential order. Describe but do not interpret these trends or negative results; save that for the discussion section. The results should be presented in the past tense.
Discussion Discussions should be analytic, logical, and comprehensive. The discussion should meld together your findings in relation to those identified in the literature review, and placed within the context of the theoretical framework underpinning the study. The discussion should be presented in the present tense.
- Interpretation of results -- reiterate the research problem being investigated and compare and contrast the findings with the research questions underlying the study. Did they affirm predicted outcomes or did the data refute it?
- Description of trends, comparison of groups, or relationships among variables -- describe any trends that emerged from your analysis and explain all unanticipated and statistical insignificant findings.
- Discussion of implications – what is the meaning of your results? Highlight key findings based on the overall results and note findings that you believe are important. How have the results helped fill gaps in understanding the research problem?
- Limitations -- describe any limitations or unavoidable bias in your study and, if necessary, note why these limitations did not inhibit effective interpretation of the results.
Conclusion End your study by to summarizing the topic and provide a final comment and assessment of the study.
- Summary of findings – synthesize the answers to your research questions. Do not report any statistical data here; just provide a narrative summary of the key findings and describe what was learned that you did not know before conducting the study.
- Recommendations – if appropriate to the aim of the assignment, tie key findings with policy recommendations or actions to be taken in practice.
- Future research – note the need for future research linked to your study’s limitations or to any remaining gaps in the literature that were not addressed in your study.
Black, Thomas R. Doing Quantitative Research in the Social Sciences: An Integrated Approach to Research Design, Measurement and Statistics . London: Sage, 1999; Gay,L. R. and Peter Airasain. Educational Research: Competencies for Analysis and Applications . 7th edition. Upper Saddle River, NJ: Merril Prentice Hall, 2003; Hector, Anestine. An Overview of Quantitative Research in Compostion and TESOL . Department of English, Indiana University of Pennsylvania; Hopkins, Will G. “Quantitative Research Design.” Sportscience 4, 1 (2000); A Strategy for Writing Up Research Results . The Structure, Format, Content, and Style of a Journal-Style Scientific Paper. Department of Biology. Bates College; Nenty, H. Johnson. "Writing a Quantitative Research Thesis." International Journal of Educational Science 1 (2009): 19-32; Ouyang, Ronghua (John). Basic Inquiry of Quantitative Research . Kennesaw State University.
- << Previous: Finding Quantitative Research
- Next: Databases >>
- Last Updated: Jul 11, 2023 1:03 PM
- URL: https://libguides.iun.edu/S371socialworkresearch
Social Work Toolbox: 37 Questions, Assessments, & Resources

This may be because of its unlikely position, balanced between “the individual and society, the powerful and the excluded” (Davies, 2013, p. 3).
Social work is a unique profession because of its breadth and depth of engagement and the many governmental and private organizations with which it engages.
Not only does it help individuals and groups solve problems in psychosocial functioning, but it also attempts to support them in their life-enhancing goals and ultimately create a just society (Suppes & Wells, 2017).
This article provides a toolbox for social workers, with a selection of assessments and resources to support them in their role and career.
Before you continue, we thought you might like to download our three Positive Psychology Exercises for free . These science-based exercises will explore fundamental aspects of positive psychology including strengths, values, and self-compassion, and will give you the tools to enhance the wellbeing of your clients, students, or employees.
This Article Contains:
6 best resources for social workers, top 17 questions to ask your clients, 2 assessments for your sessions, social work & domestic violence: 5 helpful resources, our 3 favorite podcasts on the topic, resources from positivepsychology.com, a take-home message.
Demanding professions require dedicated and supportive resources that transform social work theory into practice. The following worksheets and tools target some of the most challenging and essential areas of social work (Rogers, Whitaker, Edmondson, & Peach, 2020; Davies, 2013):
Emotional intelligence
“Understanding emotion arises from the combined consciousness of how we perceive emotions and use our intellect to make sense of them” (Rogers et al., 2020, p. 47).
For social workers, emotional intelligence is invaluable. They must develop and maintain awareness of both their own and their client’s feelings and use the insights to select appropriate interventions and communication strategies without becoming overwhelmed.
The Reflecting on Emotions in Social Work worksheet encourages social workers to stop and consider their feelings following an initial client visit.
In the worksheet, the social worker is guided to find some quiet time and space to reflect on:
- How do I feel about my initial visit?
- What are my thoughts regarding the purpose of the visit?
- How do I think I can proceed with developing a relationship with the client?
- How do I think the client feels about my visit?
Being self-aware is a crucial aspect of social work and will inform the ongoing relationship with the client.
Fostering empathy
Mirror neurons fire when we watch others performing an action or experiencing an emotion. They play a significant role in learning new skills and developing empathy for others’ experiences (Thomson, 2010).
Social workers must become more aware of service users’ experiences, as they can influence and affect the interaction with them.
Use the Fostering Empathy Reflectively worksheet to improve the understanding of your own and others’ emotions and increase the degree of empathy.
Observing others can make social workers more aware of human behavior and the emotions and thoughts underneath to increase their capacity for empathy.
Reflective cycle
Reflecting on situations encountered on the job can help social workers fully consider their own and their clients’ thoughts and feelings before drawing conclusions. Indeed, “successful reflection emphasizes the centrality of self-awareness and the capacity for analysis” (Rogers et al., 2020, p. 64).
Use the Reflective Cycle for Social Work to reflect on events, incidents, and behaviors in a structured and systematic way (modified from Gibbs, 1988).
Challenging social interactions
Good communication skills and confidence in social interactions are essential for social work. There will be times when you need assertiveness to challenge others to ensure the client’s needs are met (Rogers et al., 2020).
However, like all skills, social skills can be learned and maintained through education and practice.
The Preparing for Difficult Social Interactions worksheet considers how a situation or event may unfold through focusing on the essential issues.
Practice and role-play can help social workers prepare for a more successful social interaction and gain confidence in their coping abilities.
Motivational Interviewing in Social Work
“Change can become difficult for service users when they are ambivalent about the extent to which the change will be beneficial” (Davies, 2013, p. 451).
One method used by social workers to explore their clients’ intrinsic values and ambivalence is through motivational interviewing (MI). MI has four basic principles (modified from Davies, 2013):
- Expressing empathy Displaying a clear and genuine interest in the client’s needs, feelings, and perspective.
- Developing discrepancy Watching and listening for discrepancies between a client’s present behavior and values and future goals.
- Rolling with resistance Avoiding getting into arguments or pushing for change.
- Supporting self-efficacy Believing in the client’s capacity to change.
The Motivational Interviewing in Social Work worksheet uses the five stages of change to consider the client’s readiness for change and as input for selecting an appropriate intervention (Prochaska & DiClemente, 1986; Davies, 2013).
The client should be encouraged to create and implement a plan, including goals and details of the specific tasks required.
Respectful practices
Rogers et al. (2020) identified several fundamental values that social workers should be aware of and practice with their service users, families, and other organizations with which they engage. These include:
- Individuality
- Honesty and integrity
The Respectful Practices in Social Work worksheet encourages reflection on whether a social worker remains in touch with their values and the principles expected in their work.
Social workers should frequently think of recent examples of interactions with clients, families, and other organizations, and ask themselves (modified from Rogers et al., 2020):
- Were you polite, courteous, warm, and approachable?
- How well did you accept people with different beliefs and values from your own?
- Did you attempt to understand the person and their history?
- Were you professional, open, honest, and trustworthy?
- Did you treat each person equally, providing fair access to your time and resources?
A regular check-in to ensure high standards are being maintained and values remain clear will ensure the continued professionalism expected from a social worker.

The following questions provide practical examples; practitioners should tailor them according to timing and context and remain sensitive to the needs of all involved (Rogers et al., 2020; Suppes & Wells, 2017; Davies, 2013).
Open questions
Open questions encourage the respondent to reflect and respond with their feelings, thoughts, and personal experiences. For example:
- What is your view of what happened?
- What has it been like living with this issue?
- How could we work together to find a good solution?
- What are your greatest fears?

World’s Largest Positive Psychology Resource
The Positive Psychology Toolkit© is a groundbreaking practitioner resource containing over 500 science-based exercises , activities, interventions, questionnaires, and assessments created by experts using the latest positive psychology research.
Updated monthly. 100% Science-based.
“The best positive psychology resource out there!” — Emiliya Zhivotovskaya , Flourishing Center CEO
Closed questions
Typically, closed questions are used to find out personal details such as name and address, but they can also provide focus and clarity to confirm information. Closed questions are especially important when dealing with someone with cognitive impairment or who finds it difficult to speak up, and can lead to follow-up, open questions.
For example:
- How old are you?
- Are you in trouble?
- Are you scared?
- Do you need help?
Hypothetical questions
Hypothetical questions can be helpful when we need the service user to consider a potentially different future, one in which their problems have been resolved. Such questions can build hope and set goals. For example:
- Can you imagine how things would be if you did not live with the fear of violence?
- Where would you like to be in a few years after you leave school?
- Can you imagine what you would do if a similar situation were to happen again?
Strengths-based questions
“Focusing on strengths helps to move away from a preoccupation with risk and risk management” and builds strengths for a better future (Rogers et al., 2020, p. 243). Strengths-based questions in social work can be powerful tools for identifying the positives and adopting a solution-focused approach.
Examples include:
- Survival – How did you cope in the past?
- Support – Who helps you and gives you support and guidance?
- Esteem – How do you feel when you receive compliments?
- Perspective – What are your thoughts about the situation, issue, or problem?
- Change – What would you like to change, and how can I help?
- Meaning – What gives your life meaning?

Download 3 Free Positive Psychology Exercises (PDF)
Enhance wellbeing with these free, science-based exercises that draw on the latest insights from positive psychology.
Download 3 Free Positive Psychology Tools Pack (PDF)
By filling out your name and email address below.
Interventions in social work are often described as having four stages: engagement, assessment, intervention, and evaluation (Suppes & Wells, 2017).
The assessment stage typically involves:
- Collecting, organizing, and interpreting data
- Assessing a client’s strengths and limitations
- Developing and agreeing on goals and objectives for interventions
- Selecting strategies appropriate to the intervention
Assessment is an ongoing process that typically focuses on risk. It begins with the referral and only ends when the intervention is complete or the case closed.
Assessment will need to be specific to the situation and the individuals involved, but it is likely to consider the following kinds of risks (Rogers et al., 2020; Bath and North East Somerset Council, 2017):
General risk assessment
Risk management does not remove risk, but rather reduces the likelihood or impact of problematic behavior. Risk assessments are performed to identify factors that may cause risky behavior or events (Davies, 2013).
Questions include:
- What has been happening?
- What is happening right now?
- What could happen?
- How likely is it that it will happen?
- How serious could it be?
The wording and detail of each will depend on the situation, client, and environment, guided by the social worker’s training and experience.
Assessment of risk to children
A child’s safety is of the utmost importance. As part of the assessment process, a complete understanding of actual or potential harm is vital, including (modified from Bath and North East Somerset Council, 2017):
- Has the child been harmed? Are they likely to be harmed?
- Is the child at immediate risk of harm and is their safety threatened?
- If harmed previously, to what extent or degree? Is there likely to be harm in the future?
- Has there been a detrimental impact on the child’s wellbeing? Is there likely to be in the future?
- Is there a parent or guardian able and motivated to protect the child from harm?
Social workers must use professional judgment to assess the level of risk and assure the child’s ongoing safety.
Assessment process – Oregon Department of Human Services

The figures related to domestic violence are shocking. There are 1.3 million women and 835,000 men in the United States alone who are physically assaulted by a close partner each year (NASW, n.d.).
The NASW offers valuable resources to help social workers recognize the signs of existing domestic violence, prevent future violence, and help victims, including:
- We can help end domestic violence – information on how the White Ribbon Day Campaign is raising awareness of domestic violence
SocialWorkersToolBox.com is another website with a vast range of free social work tools and resources. This UK-based website has a range of videos and educational toolkits, including:
- Exploring Healthy Relationships: Resource Pack for 14–16-Year-Olds
- Parents’ Guide: Youth Violence, Knife Crime, and Gangs
- Family Meetings: Parents’ Guide and Templates
- Preventing Bullying: A Guide for Parents
Many of the worksheets are helpful for sharing with parents, carers, and organizations.
Here are three insightful podcasts that discuss many of the issues facing social workers and social policymakers:
- NASW Social Work Talks Podcast The NASW podcast explores topics social workers care about and hosts experts in both theory and practice. The podcast covers broad subjects including racism, child welfare, burnout, and facing grief.
- The Social Work Podcast This fascinating podcast is another great place to hear from social workers and other experts in the field. The host and founder is Jonathan Singer, while Allan Barsky – a lecturer and researcher – is a frequent guest. Along with other guests, various issues affecting social workers and policymakers are discussed.
- Social Work Stories Podcast hosts and social workers Lis Murphy, Mim Fox, and Justin Stech guide listeners through all aspects of social work and social welfare.
17 Top-Rated Positive Psychology Exercises for Practitioners
Expand your arsenal and impact with these 17 Positive Psychology Exercises [PDF] , scientifically designed to promote human flourishing, meaning, and wellbeing.
Created by Experts. 100% Science-based.
Social workers should be well versed in a variety of theories, tools, and skills. We have plenty of resources to support experienced social workers and those new to the profession.
One valuable point of focus for social workers involves building strengths and its role in solution-focused therapy . Why not download our free strengths exercise pack and try out the powerful exercises contained within? Here are some examples:
- Strength Regulation By learning how to regulate their strengths, clients can be taught to use them more effectively.
- You at Your Best Strengths finding is a powerful way for social workers to increase service users’ awareness of their strengths.
Other free helpful resources for social workers include:
- Conflict Resolution Checklist Remove issues and factors causing or increasing conflict with this practical checklist .
- Assertive Communication Practicing assertive communication can be equally valuable for social workers and service users.
More extensive versions of the following tools are available with a subscription to the Positive Psychology Toolkit© , but they are described briefly below:
- Self-Contract
Commitment and self-belief can increase the likelihood of successful future behavioral change.
The idea is to commit yourself to making a positive and effective change by signing a statement of what you will do and when. For example:
I will do [goal] by [date].
- Cognitive Restructuring
While negative thoughts may not accurately reflect reality, they can increase the risk of unwelcome and harmful behavior.
This cognitive psychology tool helps people identify distorted and unhelpful thinking and find other ways of thinking:
- Step one – Identify automatic unhelpful thoughts that are causing distress.
- Step two – Evaluate the accuracy of these thoughts.
- Step three – Substitute them with fair, rational, and balanced thoughts.
Individuals can then reflect on how this more balanced and realistic style of thinking makes them feel.
If you’re looking for more science-based ways to help others enhance their wellbeing, this signature collection contains 17 validated positive psychology tools for practitioners. Use them to help others flourish and thrive.
Society and policymakers increasingly rely on social workers to help solve individual and group issues involving psychosocial functioning. But beyond helping people survive when society lets them down, social workers support them through positive change toward meaningful goals.
Social workers must be well equipped with social, goal-setting, and communication skills underpinned by positive psychology theory and developed through practice to be successful.
Reflection is crucial. Professionals must analyze their own and others’ emotions, thinking, and behavior while continuously monitoring risk, particularly when vulnerable populations are involved.
The nature of social work is to engage with populations often at the edge of society, where support is either not provided or under-represented.
This article includes tools, worksheets, and other resources that support social workers as they engage with and help their clients. Try them out and tailor them as needed to help deliver positive and lasting change and a more just society.
We hope you enjoyed reading this article. Don’t forget to download our three Positive Psychology Exercises for free .
- Bath and North East Somerset Council. (2017, June). Risk assessment guidance . Retrieved November 17, 2021, from https://bathnes.proceduresonline.com/chapters/p_risk_assess.html
- Davies, M. (2013). The Blackwell companion to social work . Wiley Blackwell.
- Gibbs, G. (1988). Learning by doing: A guide to teaching and learning methods . Oxford Further Education Unit.
- National Association of Social Workers. (n.d.). Domestic violence media toolkit . Retrieved November 17, 2021, from https://www.socialworkers.org/News/1000-Experts/Media-Toolkits/Domestic-Violence
- Prochaska, J. O., & DiClemente, C. C. (1986). Toward a comprehensive model of change. In W. R. Miller & N. Heather (Eds.) Treating addictive behaviors: Processes of chang e. Springer.
- Rogers, M., Whitaker, D., Edmondson, D., & Peach, D. (2020). Developing skills & knowledge for social work practice . SAGE.
- Suppes, M. A., & Wells, M. A. (2017). The social work experience: An introduction to social work and social welfare . Pearson.
- Thomson, H. (2010, April 14). Empathetic mirror neurons found in humans at last . New Scientist. Retrieved November 16, 2021, from https://www.newscientist.com/article/mg20627565-600-empathetic-mirror-neurons-found-in-humans-at-last/

Share this article:
Article feedback
What our readers think.

Thanks so much for including the Social Work Podcast in this article. One correction: Allan Barsky is a frequent guest, but Jonathan Singer is the founder and host.

Hi there Jonathan,
Thank you so much for bringing this to our attention! We are delighted that you are reading the blog as we are fans of your podcast as well.
We will adjust this right away so we can give credit where credit is due 🙂
Thanks for all that you do!
Kind regards, -Caroline | Community Manager

Petra, it does not hurt to see this information again. Some social workers are new at their jobs and can always benefit from hearing this info repeated. If you want to hear from social workers only, then encourage your peers and or colleagues to write this stuff from their perspective.

This article is demeaning and patronsing! As social workers – we have done our (at least) 4 years at uni and this stuff is social work 101. As psychologists – I find you often think you know best and can “tell” other professionals how to do their jobs. So – if you want to write something to social workers – get a social worker to write it! Petra van Vliet – proud and loud social worker
Let us know your thoughts Cancel reply
Your email address will not be published.
Save my name, email, and website in this browser for the next time I comment.
Related articles

Hierarchy of Needs: A 2024 Take on Maslow’s Findings
One of the most influential theories in human psychology that addresses our quest for wellbeing is Abraham Maslow’s Hierarchy of Needs. While Maslow’s theory of [...]

Emotional Development in Childhood: 3 Theories Explained
We have all witnessed a sweet smile from a baby. That cute little gummy grin that makes us smile in return. Are babies born with [...]

Using Classical Conditioning for Treating Phobias & Disorders
Does the name Pavlov ring a bell? Classical conditioning, a psychological phenomenon first discovered by Ivan Pavlov in the late 19th century, has proven to [...]
Read other articles by their category
- Body & Brain (52)
- Coaching & Application (39)
- Compassion (23)
- Counseling (40)
- Emotional Intelligence (21)
- Gratitude (18)
- Grief & Bereavement (18)
- Happiness & SWB (40)
- Meaning & Values (26)
- Meditation (16)
- Mindfulness (40)
- Motivation & Goals (41)
- Optimism & Mindset (29)
- Positive CBT (28)
- Positive Communication (23)
- Positive Education (37)
- Positive Emotions (32)
- Positive Leadership (16)
- Positive Parenting (14)
- Positive Psychology (21)
- Positive Workplace (35)
- Productivity (16)
- Relationships (46)
- Resilience & Coping (39)
- Self Awareness (20)
- Self Esteem (37)
- Strengths & Virtues (29)
- Stress & Burnout Prevention (33)
- Theory & Books (42)
- Therapy Exercises (37)
- Types of Therapy (54)
3 Positive Psychology Tools (PDF)
Strengths and Difficulties Questionnaires strengths and limitations as an evaluation and practice tool in Social Work
- August 2018
- Aotearoa New Zealand Social Work 30(2):28
- This person is not on ResearchGate, or hasn't claimed this research yet.
Abstract and Figures

Discover the world's research
- 25+ million members
- 160+ million publication pages
- 2.3+ billion citations
- CLIN SOC WORK J

- Martin Bergström

- BMC PSYCHIATRY

- Margaret Bruce

- Gina Conti-Ramsden
- SMITH COLL STUD SOC

- Karen VanDeusen

- J Paediatr Child Health
- Janine Thomson

- Chris Frampton

- Recruit researchers
- Join for free
- Login Email Tip: Most researchers use their institutional email address as their ResearchGate login Password Forgot password? Keep me logged in Log in or Continue with Google Welcome back! Please log in. Email · Hint Tip: Most researchers use their institutional email address as their ResearchGate login Password Forgot password? Keep me logged in Log in or Continue with Google No account? Sign up
Have a language expert improve your writing
Run a free plagiarism check in 10 minutes, generate accurate citations for free.
- Knowledge Base
Methodology
- Survey Research | Definition, Examples & Methods
Survey Research | Definition, Examples & Methods
Published on August 20, 2019 by Shona McCombes . Revised on June 22, 2023.
Survey research means collecting information about a group of people by asking them questions and analyzing the results. To conduct an effective survey, follow these six steps:
- Determine who will participate in the survey
- Decide the type of survey (mail, online, or in-person)
- Design the survey questions and layout
- Distribute the survey
- Analyze the responses
- Write up the results
Surveys are a flexible method of data collection that can be used in many different types of research .
Table of contents
What are surveys used for, step 1: define the population and sample, step 2: decide on the type of survey, step 3: design the survey questions, step 4: distribute the survey and collect responses, step 5: analyze the survey results, step 6: write up the survey results, other interesting articles, frequently asked questions about surveys.
Surveys are used as a method of gathering data in many different fields. They are a good choice when you want to find out about the characteristics, preferences, opinions, or beliefs of a group of people.
Common uses of survey research include:
- Social research : investigating the experiences and characteristics of different social groups
- Market research : finding out what customers think about products, services, and companies
- Health research : collecting data from patients about symptoms and treatments
- Politics : measuring public opinion about parties and policies
- Psychology : researching personality traits, preferences and behaviours
Surveys can be used in both cross-sectional studies , where you collect data just once, and in longitudinal studies , where you survey the same sample several times over an extended period.
Here's why students love Scribbr's proofreading services
Discover proofreading & editing
Before you start conducting survey research, you should already have a clear research question that defines what you want to find out. Based on this question, you need to determine exactly who you will target to participate in the survey.
Populations
The target population is the specific group of people that you want to find out about. This group can be very broad or relatively narrow. For example:
- The population of Brazil
- US college students
- Second-generation immigrants in the Netherlands
- Customers of a specific company aged 18-24
- British transgender women over the age of 50
Your survey should aim to produce results that can be generalized to the whole population. That means you need to carefully define exactly who you want to draw conclusions about.
Several common research biases can arise if your survey is not generalizable, particularly sampling bias and selection bias . The presence of these biases have serious repercussions for the validity of your results.
It’s rarely possible to survey the entire population of your research – it would be very difficult to get a response from every person in Brazil or every college student in the US. Instead, you will usually survey a sample from the population.
The sample size depends on how big the population is. You can use an online sample calculator to work out how many responses you need.
There are many sampling methods that allow you to generalize to broad populations. In general, though, the sample should aim to be representative of the population as a whole. The larger and more representative your sample, the more valid your conclusions. Again, beware of various types of sampling bias as you design your sample, particularly self-selection bias , nonresponse bias , undercoverage bias , and survivorship bias .
There are two main types of survey:
- A questionnaire , where a list of questions is distributed by mail, online or in person, and respondents fill it out themselves.
- An interview , where the researcher asks a set of questions by phone or in person and records the responses.
Which type you choose depends on the sample size and location, as well as the focus of the research.
Questionnaires
Sending out a paper survey by mail is a common method of gathering demographic information (for example, in a government census of the population).
- You can easily access a large sample.
- You have some control over who is included in the sample (e.g. residents of a specific region).
- The response rate is often low, and at risk for biases like self-selection bias .
Online surveys are a popular choice for students doing dissertation research , due to the low cost and flexibility of this method. There are many online tools available for constructing surveys, such as SurveyMonkey and Google Forms .
- You can quickly access a large sample without constraints on time or location.
- The data is easy to process and analyze.
- The anonymity and accessibility of online surveys mean you have less control over who responds, which can lead to biases like self-selection bias .
If your research focuses on a specific location, you can distribute a written questionnaire to be completed by respondents on the spot. For example, you could approach the customers of a shopping mall or ask all students to complete a questionnaire at the end of a class.
- You can screen respondents to make sure only people in the target population are included in the sample.
- You can collect time- and location-specific data (e.g. the opinions of a store’s weekday customers).
- The sample size will be smaller, so this method is less suitable for collecting data on broad populations and is at risk for sampling bias .
Oral interviews are a useful method for smaller sample sizes. They allow you to gather more in-depth information on people’s opinions and preferences. You can conduct interviews by phone or in person.
- You have personal contact with respondents, so you know exactly who will be included in the sample in advance.
- You can clarify questions and ask for follow-up information when necessary.
- The lack of anonymity may cause respondents to answer less honestly, and there is more risk of researcher bias.
Like questionnaires, interviews can be used to collect quantitative data: the researcher records each response as a category or rating and statistically analyzes the results. But they are more commonly used to collect qualitative data : the interviewees’ full responses are transcribed and analyzed individually to gain a richer understanding of their opinions and feelings.
Next, you need to decide which questions you will ask and how you will ask them. It’s important to consider:
- The type of questions
- The content of the questions
- The phrasing of the questions
- The ordering and layout of the survey
Open-ended vs closed-ended questions
There are two main forms of survey questions: open-ended and closed-ended. Many surveys use a combination of both.
Closed-ended questions give the respondent a predetermined set of answers to choose from. A closed-ended question can include:
- A binary answer (e.g. yes/no or agree/disagree )
- A scale (e.g. a Likert scale with five points ranging from strongly agree to strongly disagree )
- A list of options with a single answer possible (e.g. age categories)
- A list of options with multiple answers possible (e.g. leisure interests)
Closed-ended questions are best for quantitative research . They provide you with numerical data that can be statistically analyzed to find patterns, trends, and correlations .
Open-ended questions are best for qualitative research. This type of question has no predetermined answers to choose from. Instead, the respondent answers in their own words.
Open questions are most common in interviews, but you can also use them in questionnaires. They are often useful as follow-up questions to ask for more detailed explanations of responses to the closed questions.
The content of the survey questions
To ensure the validity and reliability of your results, you need to carefully consider each question in the survey. All questions should be narrowly focused with enough context for the respondent to answer accurately. Avoid questions that are not directly relevant to the survey’s purpose.
When constructing closed-ended questions, ensure that the options cover all possibilities. If you include a list of options that isn’t exhaustive, you can add an “other” field.
Phrasing the survey questions
In terms of language, the survey questions should be as clear and precise as possible. Tailor the questions to your target population, keeping in mind their level of knowledge of the topic. Avoid jargon or industry-specific terminology.
Survey questions are at risk for biases like social desirability bias , the Hawthorne effect , or demand characteristics . It’s critical to use language that respondents will easily understand, and avoid words with vague or ambiguous meanings. Make sure your questions are phrased neutrally, with no indication that you’d prefer a particular answer or emotion.
Ordering the survey questions
The questions should be arranged in a logical order. Start with easy, non-sensitive, closed-ended questions that will encourage the respondent to continue.
If the survey covers several different topics or themes, group together related questions. You can divide a questionnaire into sections to help respondents understand what is being asked in each part.
If a question refers back to or depends on the answer to a previous question, they should be placed directly next to one another.
Receive feedback on language, structure, and formatting
Professional editors proofread and edit your paper by focusing on:
- Academic style
- Vague sentences
- Style consistency
See an example

Before you start, create a clear plan for where, when, how, and with whom you will conduct the survey. Determine in advance how many responses you require and how you will gain access to the sample.
When you are satisfied that you have created a strong research design suitable for answering your research questions, you can conduct the survey through your method of choice – by mail, online, or in person.
There are many methods of analyzing the results of your survey. First you have to process the data, usually with the help of a computer program to sort all the responses. You should also clean the data by removing incomplete or incorrectly completed responses.
If you asked open-ended questions, you will have to code the responses by assigning labels to each response and organizing them into categories or themes. You can also use more qualitative methods, such as thematic analysis , which is especially suitable for analyzing interviews.
Statistical analysis is usually conducted using programs like SPSS or Stata. The same set of survey data can be subject to many analyses.
Finally, when you have collected and analyzed all the necessary data, you will write it up as part of your thesis, dissertation , or research paper .
In the methodology section, you describe exactly how you conducted the survey. You should explain the types of questions you used, the sampling method, when and where the survey took place, and the response rate. You can include the full questionnaire as an appendix and refer to it in the text if relevant.
Then introduce the analysis by describing how you prepared the data and the statistical methods you used to analyze it. In the results section, you summarize the key results from your analysis.
In the discussion and conclusion , you give your explanations and interpretations of these results, answer your research question, and reflect on the implications and limitations of the research.
If you want to know more about statistics , methodology , or research bias , make sure to check out some of our other articles with explanations and examples.
- Student’s t -distribution
- Normal distribution
- Null and Alternative Hypotheses
- Chi square tests
- Confidence interval
- Quartiles & Quantiles
- Cluster sampling
- Stratified sampling
- Data cleansing
- Reproducibility vs Replicability
- Peer review
- Prospective cohort study
Research bias
- Implicit bias
- Cognitive bias
- Placebo effect
- Hawthorne effect
- Hindsight bias
- Affect heuristic
- Social desirability bias
A questionnaire is a data collection tool or instrument, while a survey is an overarching research method that involves collecting and analyzing data from people using questionnaires.
A Likert scale is a rating scale that quantitatively assesses opinions, attitudes, or behaviors. It is made up of 4 or more questions that measure a single attitude or trait when response scores are combined.
To use a Likert scale in a survey , you present participants with Likert-type questions or statements, and a continuum of items, usually with 5 or 7 possible responses, to capture their degree of agreement.
Individual Likert-type questions are generally considered ordinal data , because the items have clear rank order, but don’t have an even distribution.
Overall Likert scale scores are sometimes treated as interval data. These scores are considered to have directionality and even spacing between them.
The type of data determines what statistical tests you should use to analyze your data.
The priorities of a research design can vary depending on the field, but you usually have to specify:
- Your research questions and/or hypotheses
- Your overall approach (e.g., qualitative or quantitative )
- The type of design you’re using (e.g., a survey , experiment , or case study )
- Your sampling methods or criteria for selecting subjects
- Your data collection methods (e.g., questionnaires , observations)
- Your data collection procedures (e.g., operationalization , timing and data management)
- Your data analysis methods (e.g., statistical tests or thematic analysis )
Cite this Scribbr article
If you want to cite this source, you can copy and paste the citation or click the “Cite this Scribbr article” button to automatically add the citation to our free Citation Generator.
McCombes, S. (2023, June 22). Survey Research | Definition, Examples & Methods. Scribbr. Retrieved September 5, 2024, from https://www.scribbr.com/methodology/survey-research/
Is this article helpful?

Shona McCombes
Other students also liked, qualitative vs. quantitative research | differences, examples & methods, questionnaire design | methods, question types & examples, what is a likert scale | guide & examples, "i thought ai proofreading was useless but..".
I've been using Scribbr for years now and I know it's a service that won't disappoint. It does a good job spotting mistakes”
- Boston University Libraries
Databases for Social Work Research
- Social Work Databases
- Searching Databases
- Subject Guides for Your Research
About This Guide
This guide is dedicated to using databases at Boston University to conduct specialized research in the field of social work.
Why Do We Use Databases?
You can use the BU Libraries Search box to connect to information across databases that you have access to. However, by choosing to start your search within a database, you can ensure that it comes from within your specific discipline or apply different filters.
Where you start searching depends on your own personal research needs and goals.
Colleagues at Northeastern Illinois University made this great video on why we sometimes use databases:

- Next: Social Work Databases >>
- Last Updated: Sep 6, 2024 1:59 PM
- URL: https://library.bu.edu/socialworkdatabases
Thank you for visiting nature.com. You are using a browser version with limited support for CSS. To obtain the best experience, we recommend you use a more up to date browser (or turn off compatibility mode in Internet Explorer). In the meantime, to ensure continued support, we are displaying the site without styles and JavaScript.
- View all journals
- Explore content
- About the journal
- Publish with us
- Sign up for alerts
- Open access
- Published: 04 September 2024
How to avoid sinking in swamp: exploring the intentions of digitally disadvantaged groups to use a new public infrastructure that combines physical and virtual spaces
- Chengxiang Chu 1 na1 ,
- Zhenyang Shen 1 na1 ,
- Hanyi Xu 2 na1 ,
- Qizhi Wei 1 &
- Cong Cao ORCID: orcid.org/0000-0003-4163-2218 1
Humanities and Social Sciences Communications volume 11 , Article number: 1135 ( 2024 ) Cite this article
Metrics details
- Science, technology and society
With advances in digital technology, physical and virtual spaces have gradually merged. For digitally disadvantaged groups, this transformation is both convenient and potentially supportive. Previous research on public infrastructure has been limited to improvements in physical facilities, and few researchers have investigated the use of mixed physical and virtual spaces. In this study, we focused on integrated virtual and physical spaces and investigated the factors affecting digitally disadvantaged groups’ intentions to use this new infrastructure. Building on a unified theory of the acceptance and use of technology, we focused on social interaction anxiety, identified the characteristics of digitally disadvantaged groups, and constructed a research model to examine intentions to use the new infrastructure. We obtained 337 valid data from the questionnaire and analysed them using partial least squares structural equation modelling. The results showed positive relationships between performance expectancy, perceived institutional support, perceived marketplace influence, effort expectancy, and facilitating conditions. The influence of psychological reactance was significantly negative. Finally, social interaction anxiety had a regulatory effect on performance expectancy, psychological reactance, perceived marketplace influence, and effort expectancy. Its effects on perceived institutional support and facilitating conditions were not significant. The results support the creation of inclusive smart cities by ensuring that the new public infrastructure is suitable for digitally disadvantaged groups. Meanwhile, this study presents new theoretical concepts of new public infrastructures, mixed physical and virtual spaces, which provides a forward-looking approach to studying digitally disadvantaged groups in this field and paves the way for subsequent scholars to explore the field in theory and literature.
The impact of small-scale green infrastructure on the affective wellbeing associated with urban sites

Economic inequalities and discontent in European cities

The appeal of cities may not wane due to the COVID-19 pandemic and remote working
Introduction.
Intelligent systems and modernisation have influenced the direction of people’s lives. With the help of continuously updated and iteratively advancing technology, modern urban construction has taken a ‘big step’ in its development. As China continues to construct smart cities, national investment in public infrastructure has steadily increased. Convenient and efficient public infrastructure has spread throughout the country, covering almost all aspects of residents’ lives and work (Guo et al. 2016 ). Previously, public infrastructure was primarily physical and located in physical spaces, but today, much of it is virtual. To achieve the goal of inclusive urban construction, the government has issued numerous relevant laws and regulations regarding public infrastructure. For example, the Chinese legislature solicited opinions from the community on the ‘Barrier-free environmental construction law of the People’s Republic of China (Draft)’.
Virtual space, based on internet technology, is a major factor in the construction of smart cities. Virtual space can be described as an interactive world built primarily on the internet (Shibusawa, 2000 ), and it has underpinned the development of national public infrastructure. In 2015, China announced its first national pilot list of smart cities, and the government began the process of building smart cities (Liu et al. 2017 ). With the continuous updating and popularisation of technologies such as the internet of things and artificial intelligence (AI) (Gu and Iop, 2020 ), virtual space is becoming widely accessible to the public. For example, in the field of government affairs, public infrastructure is now regularly developed in virtual spaces, such as on e-government platforms.
The construction of smart cities is heavily influenced by technological infrastructure (Nicolas et al. 2020 ). Currently, smart cities are being developed, and the integration of physical and virtual spaces has entered a significant stage. For example, when customers go to an offline bank to transact business, they are often asked by bank employees to use online banking software on their mobile phones, join a queue, or prove their identities. Situations such as these are neither purely virtual nor entirely physical, but in fields like banking, both options need to be considered. Therefore, we propose a new concept of mixed physical and virtual spaces in which individuals can interact, share, collaborate, coordinate with each other, and act.
Currently, new public infrastructure has emerged in mixed physical and virtual spaces, such as ‘Zheli Office’ and Alipay, in Zhejiang Province, China (as shown in Fig. 1 ). ‘Zheli Office’ is a comprehensive government application that integrates government services through digital technology, transferring some processes from offline to online and greatly improving the convenience, efficiency, and personalisation of government services. Due to its convenient payment facilities, Alipay is continuously supporting the integration of various local services, such as live payments and convenient services, and has gradually become Zhejiang’s largest living service platform. Zhejiang residents can handle almost all government and life affairs using these two applications. ‘Zheli Office’ and Alipay are key to the new public infrastructure in China, which is already leading the world in terms of a new public infrastructure that combines physical and virtual spaces; thus, China provided a valuable research context for this study.

This figure shows the new public infrastructure has emerged in mixed physical and virtual spaces.
There is no doubt that the mixing of physical and virtual spaces is a helpful trend that makes life easier for most people. However, mixed physical and virtual spaces still have a threshold for their use, which makes it difficult for some groups to use the new public infrastructure effectively. Within society, there are people whose living conditions are restricted for physiological reasons. They may be elderly people, people with disabilities, or people who lack certain abilities. According to the results of China’s seventh (2021) national population census, there are 264.02 million elderly people aged 60 years and over in China, accounting for 18.7 per cent of the total population. China is expected to have a predominantly ageing population by around 2035. In addition, according to data released by the China Disabled Persons’ Federation, the total number of people with disabilities in China is more than 85 million, which is equivalent to one person with a disability for every 16 Chinese people. In this study, we downplay the differences between these groups, focusing only on common characteristics that hinder their use of the new public infrastructure. We collectively refer to these groups as digitally disadvantaged groups who may have difficulty adapting to the new public infrastructure integrating mixed physical and virtual spaces. This gap not only makes the new public infrastructure inconvenient for these digitally disadvantaged groups, but also leads to their exclusion and isolation from the advancing digital trend.
In the current context, in which the virtual and the real mix, digitally disadvantaged groups resemble stones in a turbulent flowing river. Although they can move forward, they do so with difficulty and will eventually be left behind. Besides facing the inherent inconveniences of new public infrastructure that integrates mixed physical and virtual spaces, digitally disadvantaged groups encounter additional obstacles. Unlike the traditional public infrastructure, the new public infrastructure requires users to log on to terminals, such as mobile phones, to engage with mixed physical and virtual spaces. However, a significant proportion of digitally disadvantaged groups cannot use the new public infrastructure effectively due to economic costs or a lack of familiarity with the technology. In addition, the use of facilities in physical and virtual mixed spaces requires engagement with numerous interactive elements, which further hinders digitally disadvantaged groups with weak social or technical skills.
The United Nations (UN) has stated the creation of ‘sustainable cities and communities’ as one of its sustainable development goals, and the construction of smart cities can help achieve this goal (Blasi et al. 2022 ). Recent studies have pointed out that the spread of COVID-19 exacerbated the marginalisation of vulnerable groups, while the lack of universal service processes and virtual facilities has created significant obstacles for digitally disadvantaged groups (Narzt et al. 2016 ; C. H. J. Wang et al. 2021 ). It should be noted that smart cities result from coordinated progress between technology and society (Al-Masri et al. 2019 ). The development of society should not be at the expense of certain people, and improving inclusiveness is key to the construction of smart cities, which should rest on people-oriented development (Ji et al. 2021 ). This paper focuses on the new public infrastructure that integrates mixed physical and virtual spaces. In it, we aim to explore how improved inclusiveness can be achieved for digitally disadvantaged groups during the construction of smart cities, and we propose the following research questions:
RQ1 . In a situation where there is a mix of physical and virtual spaces, what factors affect digitally disadvantaged groups’ use of the new public infrastructure?
RQ2 . What requirements will enable digitally disadvantaged groups to participate fully in the new public infrastructure integrating mixed physical and virtual spaces?
To answer these questions, we built a research model based on the unified theory of acceptance and use of technology (UTAUT) to explore the construction of a new public infrastructure that integrates mixed physical and virtual spaces (Venkatesh et al. 2003 ). During the research process, we focused on the attitudes, willingness, and other behavioural characteristics of digitally disadvantaged groups in relation to mixed physical and virtual spaces, aiming to ultimately provide research support for the construction of highly inclusive smart cities. Compared to existing research, this study goes further in exploring the integration and interconnection of urban public infrastructure in the process of smart city construction. We conducted empirical research to delve more deeply into the factors that influence digitally disadvantaged groups’ use of the new public infrastructure integrating mixed physical and virtual spaces. The results of this study can provide valuable guidelines and a theoretical framework for the construction of new public infrastructure and the improvement of relevant systems in mixed physical and virtual spaces. We also considered the psychological characteristics of digitally disadvantaged groups, introduced psychological reactance into the model, and used social interaction anxiety as a moderator for the model, thereby further enriching the research results regarding mixed physical and virtual spaces. This study directs social and government attention towards the issues affecting digitally disadvantaged groups in the construction of inclusive smart cities, and it has practical implications for the future digitally inclusive development of cities in China and across the world.
Theoretical background and literature review
Theoretical background of utaut.
Currently, the theories used to explore user acceptance behaviour are mainly applied separately in the online and offline fields. Theories relating to people’s offline use behaviour include the theory of planned behaviour (TPB) and the theory of reasoned action (TRA). Theories used to explore users’ online use behaviour include the technology acceptance model (TAM). Unlike previous researchers, who focused on either physical or virtual space, we focused on both. This required us to consider the characteristics of both physical and virtual spaces based on a combination of user acceptance theories (TPB, TRA, and TAM) and UTAUT, which was proposed by Venkatesh et al. ( 2003 ) in 2003. These theories have mainly been used to study the factors affecting user acceptance and the application of information technology. UTAUT integrates user acceptance theories to examine eight online and offline scenarios, thereby meeting our need for a theoretical model for this study that could include both physical and virtual spaces. UTAUT includes four key factors that directly affect users’ acceptance and usage behaviours: performance expectancy, facilitating conditions, social influence, and effort expectancy. Compared to other models, UTAUT has better interpretation and prediction capabilities for user acceptance behaviour (Venkatesh et al. 2003 ). A review of previous research showed that UTAUT has mainly been used to explore usage behaviours in online environments (Hoque and Sorwar, 2017 ) and regarding technology acceptance (Heerink et al. 2010 ). Thus, UTAUT is effective for exploring acceptance and usage behaviours. We therefore based this study on the belief that UTAUT could be applied to people’s intentions to use the new public infrastructure that integrates mixed physical and virtual spaces.
In this paper, we refine and extend UTAUT based on the characteristics of digitally disadvantaged groups, and we propose a model to explore the willingness of digitally disadvantaged groups to use the new public infrastructure integrating mixed physical and virtual spaces. We categorised possible influences on digitally disadvantaged groups’ use of the new public infrastructure into three areas: user factors, social factors, and technical factors. Among the user factors, we explored the willingness of digitally disadvantaged groups to use the new public infrastructure based on their performance expectancy and psychological reactance, as performance expectations are one of the UTAUT variables. To consider situations in which some users resist using new technologies due to cognitive bias, we combined (Hoque and Sorwar, 2017 ) showing that resistance among elderly people is a key factor affecting their adoption of mobile medical services with the theory of psychological reactance and introduced psychological reactance as an independent variable (Miron and Brehm, 2006 ). Among the social factors, we expanded the UTAUT social influence variable to include perceived institutional support and perceived marketplace influence. The new public infrastructure cannot be separated from the relevant government policies and the economic development status of the society in which it is constructed. Therefore, we aimed to explore the willingness of digitally disadvantaged people to use the new public infrastructure in terms of perceived institutional support and perceived marketplace influence. Among the technical factors, we explored the intentions of digitally disadvantaged groups to use new public infrastructure based on effort expectancy and facilitating conditions—both variables taken from UTAUT. In addition, considering that users with different levels of social interaction anxiety may have different levels of intention to use the new public infrastructure, we drew on research regarding the moderating role of consumer technological anxiety in adopting mobile shopping and introduced social interaction anxiety as a moderating variable (Yang and Forney, 2013 ). Believing that these modifications would further improve the interpretive ability of UTAUT, we considered it helpful to study the intentions of digitally disadvantaged groups to use the new public infrastructure.
Intentions to use mixed physical and virtual spaces
Many scholars have researched the factors that affect users’ willingness to use intelligent facilities, which can be broadly divided into two categories: for-profit and public welfare facilities. In the traditional business field, modern information technologies, such as the internet of things and AI, have become important means by which businesses can reduce costs and expand production. Even in traditional industries, such as agriculture (Kadylak and Cotten, 2020 ) and aquaculture (Cai et al. 2023 ), virtual technology now plays a significant role. Operators hope to use advanced technology to change traditional production and marketing models and to keep pace with new developments. However, mixed physical and virtual spaces should be inclusive for all people. Already, technological development is making it clear that no one will be able to entirely avoid mixed physical and virtual spaces. The virtualisation of public welfare facilities has gradually emerged in many areas of daily life, such as electronic health (D. D. Lee et al. 2019 ) and telemedicine (Werner and Karnieli, 2003 ). Government affairs are increasingly managed jointly in both physical and virtual spaces, resulting in an increase in e-government research (Ahn and Chen, 2022 ).
A review of the literature over the past decade showed that users’ willingness to use both for-profit and public welfare facilities is influenced by three sets of factors: user factors, social factors, and technical factors. First, regarding user factors, Bélanger and Carter ( 2008 ) pointed out that consumer trust in the government and technology are key factors affecting people’s intentions to use technology. Research on older people has shown that self-perceived ageing can have a significant impact on emotional attachment and willingness to use technology (B. A. Wang et al. 2021 ). Second, social factors include consumers’ intentions to use, which may vary significantly in different market contexts (Chiu and Hofer, 2015 ). For example, research has shown that people’s willingness to use digital healthcare tools is influenced by the attitudes of the healthcare professionals they encounter (Thapa et al. 2021 ). Third, technical factors include appropriate technical designs that help consumers use facilities more easily. Yadav et al. ( 2019 ) considered technical factors, such as ease of use, quality of service provided, and efficiency parameters, in their experiments.
The rapid development of virtual technology has inevitably drawn attention away from the physical world. Most previous researchers have focused on either virtual or physical spaces. However, scholars have noted the increasing mixing of these two spaces and have begun to study the relationships between them (Aslesen et al. 2019 ; Cocciolo, 2010 ). Wang ( 2007 ) proposed enhancing virtual environments by inserting real entities. Existing research has shown that physical and virtual spaces have begun to permeate each other in both economic and public spheres, blurring the boundaries between them (K. F. Chen et al. 2024 ; Paköz et al. 2022 ). Jakonen ( 2024 ) pointed out that, currently, with the integration of digital technologies into city building, the role of urban space in various stakeholders’ lives needs to be fully considered. The intermingling of physical and virtual spaces began to occur in people’s daily work (J. Chen et al. 2024 ) during the COVID-19 pandemic, which enhanced the integration trend (Yeung and Hao, 2024 ). The intermingling of virtual and physical spaces is a sign of social progress, but it is a considerable challenge for digitally disadvantaged people. For example, people with disabilities experience infrastructure, access, regulatory, communication, and legislative barriers when using telehealth services (Annaswamy et al. 2020 ). However, from an overall perspective, few relevant studies have considered the mixing of virtual and physical spaces.
People who are familiar with information technology, especially Generation Z, generally consider the integration of physical and virtual spaces convenient. However, for digitally disadvantaged groups, such ‘science fiction’-type changes can be disorientating and may undermine their quality of life. The elderly are an important group among the digitally disadvantaged groups referred to in this paper, and they have been the primary target of previous research on issues of inclusivity. Many researchers have considered the factors influencing older people’s willingness to use emerging technologies. For example, for the elderly, ease of use is often a prerequisite for enjoyment (Dogruel et al. 2015 ). Iancu and Iancu ( 2020 ) explored the interaction of elderly with technology, with a particular focus on mobile device design. The study emphasised that elderly people’s difficulties with technology stem from usability issues that can be addressed through improved design and appropriate training (Iancu and Iancu, 2020 ). Moreover, people with disabilities are an important group among digitally disadvantaged groups and an essential concern for the inclusive construction of cities. The rapid development of emerging technologies offers convenience to people with disabilities and has spawned many physical accessibility facilities and electronic accessibility systems (Botelho, 2021 ; Perez et al. 2023 ). Ease of use, convenience, and affordability are also key elements for enabling disadvantaged groups to use these facilities (Mogaji et al. 2023 ; Mogaji and Nguyen, 2021 ). Zander et al. ( 2023 ) explored the facilitators of and barriers to the implementation of welfare technologies for elderly people and people with disabilities. Factors such as abilities, attitudes, values, and lifestyles must be considered when planning the implementation of welfare technology for older people and people with disabilities (Zander et al. 2023 ).
In summary, scholars have conducted extensive research on the factors influencing intentions to use virtual facilities. These studies have revealed the underlying logic behind people’s adoption of virtual technology and have laid the foundations for the construction of inclusive new public infrastructure. Moreover, scholars have proposed solutions to the problems experienced by digitally disadvantaged groups in adapting to virtual facilities, but most of these scholars have focused on the elderly. Furthermore, scholars have recently conducted preliminary explorations of the mixing of physical and virtual spaces. These studies provided insights for this study, enabling us to identify both relevant background factors and current developments in the integration of virtual spaces with reality. However, most researchers have viewed the development of technology from the perspective of either virtual space or physical space, and they have rarely explored technology from the perspective of mixed physical and virtual spaces. In addition, when focusing on designs for the inclusion of digitally disadvantaged groups, scholars have mainly provided suggestions for specific practices, such as improvements in technology, hardware facilities, or device interaction interfaces, while little consideration has been given to the psychological characteristics of digitally disadvantaged groups or to the overall impact of society on these groups. Finally, in studying inclusive modernisation, researchers have generally focused on the elderly or people with disabilities, with less exploration of behavioural differences caused by factors such as social anxiety. Therefore, based on UTAUT, we explored the willingness of digitally disadvantaged groups to use the new public infrastructure integrating mixed physical and virtual spaces in a Chinese context (as shown in Fig. 2 ).

This figure explores the willingness of digitally disadvantaged groups to use the new public infrastructure integrating mixed physical and virtual spaces in a Chinese context.
Research hypotheses
User factors.
Performance expectancy is defined as the degree to which an individual believes that using a system will help him or her achieve gains in job performance (Chao, 2019 ; Venkatesh et al. 2003 ). In this paper, performance expectancy refers to the extent to which digitally disadvantaged groups obtain tangible results from the use of the new public infrastructure. Since individuals have a strong desire to improve their work performance, they have strong intentions to use systems that can improve that performance. Previous studies in various fields have confirmed the view that high performance expectancy can effectively promote individuals’ sustained intentions to use technology (Abbad, 2021 ; Chou et al. 2010 ; S. W. Lee et al. 2019 ). For example, the role of performance expectancy was verified in a study on intentions to use e-government (Zeebaree et al. 2022 ). We believe that if digitally disadvantaged groups have confidence that the new public infrastructure will help them improve their lives or work performance, even in complex environments, such as mixed physical and virtual spaces, they will have a greater willingness to use it. Therefore, we developed the following hypothesis:
H1: Performance expectancy has a positive impact on digitally disadvantaged groups’ intentions to use the new public infrastructure integrating mixed physical and virtual spaces.
Brehm ( 1966 ) proposed the psychological reactance theory in 1966. According to this theory, when individuals perceive that their freedom to make their own choices is under threat, a motivational state to restore that freedom is awakened (Miron and Brehm, 2006 ). Psychological reactance manifests in an individual’s intentional or unintentional resistance to external factors. Previous studies have shown that when individuals are in the process of using systems or receiving information, they may have cognitive biases that lead to erroneous interpretations of the external environment, resulting in psychological reactance (Roubroeks et al. 2010 ). Surprisingly, cognitive biases may prompt individuals to experience psychological reactance, even when offered support with helpful intentions (Tian et al. 2020 ). In this paper, we define psychological resistance as the cognitive-level or psychological-level obstacles or resistance of digitally disadvantaged groups to the new public infrastructure. This resistance may be due to digitally disadvantaged groups misunderstanding the purpose or use of the new public infrastructure. For example, they may think that the new public infrastructure will harm their self-respect or personal interests. When digitally disadvantaged groups view the new public infrastructure as a threat to their status or freedom to make their own decisions, they may develop resistance to its use. Therefore, psychological reactance cannot be ignored as an important factor potentially affecting digitally disadvantaged groups’ intentions to use the new public infrastructure. Hence, we developed the following hypothesis:
H2: Psychological reactance has a negative impact on digitally disadvantaged groups’ intentions to use the new public infrastructure integrating mixed physical and virtual spaces.
Social factors
In many countries, the main providers of public infrastructure are government and public institutions (Susilawati et al. 2010 ). Government decision-making is generally based on laws or government regulations (Acharya et al. 2022 ). Government decision-making procedures affect not only the builders of infrastructure, but also the intentions of users. In life, individuals and social organisations tend to abide by and maintain social norms to ensure that their behaviours are socially attractive and acceptable (Bygrave and Minniti, 2000 ; Martins et al. 2019 ). For example, national financial policies influence the marketing effectiveness of enterprises (Chen et al. 2021 ). Therefore, we believe that perceived institutional support is a key element influencing the intentions of digitally disadvantaged groups to use the new public infrastructure. In this paper, perceived institutional support refers to digitally disadvantaged groups’ perceived policy state or government support for using the new public infrastructure, including institutional norms, laws, and regulations. Existing institutions have mainly been designed around public infrastructure that exists in physical space. We hope to explore whether perceived institutional support for digitally disadvantaged groups affects their intentions to use the new public infrastructure that integrates mixed physical and virtual spaces. Thus, we formulated the following hypothesis:
H3: Perceived institutional support has a positive impact on digitally disadvantaged groups’ intentions to use the new public infrastructure integrating mixed physical and virtual spaces.
Perceived marketplace influence is defined as actions or decisions that affect the market behaviour of consumers and organisations (Joshi et al. 2021 ; Leary et al. 2014 ). In this paper, perceived marketplace influence is defined as the behaviour of others using the new public infrastructure that affects the intentions of digitally disadvantaged groups to use it. Perceived marketplace influence increases consumers’ perceptions of market dynamics and their sense of control through the influence of other participants in the marketplace (Leary et al. 2019 ). Scholars have explored the impact of perceived marketplace influence on consumers’ purchase and use intentions in relation to fair trade and charity (Leary et al. 2019 ; Schneider and Leonard, 2022 ). Schneider and Leonard ( 2022 ) claimed that if consumers believe that their mask-wearing behaviour will motivate others around them to follow suit, then this belief will in turn motivate them to wear masks. Similarly, when digitally disadvantaged people see the people around them using the new public infrastructure, this creates an invisible market that influences their ability and motivation to try using the infrastructure themselves. Therefore, we developed the following hypotheses:
H4: Perceived marketplace influence has a positive impact on digitally disadvantaged groups’ intentions to use the new public infrastructure integrating mixed physical and virtual spaces.
Technical factors
Venkatesh et al. ( 2003 ) defined effort expectancy as the ease with which individuals can use a system. According to Tam et al. ( 2020 ), effort expectancy positively affects individuals’ performance expectancy and their sustained intentions to use mobile applications. In this paper, effort expectancy refers to the ease of use of the new public infrastructure for digitally disadvantaged groups: the higher the level of innovation and the more steps involved in using a facility, the poorer the user experience and the lower the utilisation rate (Venkatesh and Brown, 2001 ). A study on the use of AI devices for service delivery noted that the higher the level of anthropomorphism, the higher the cost of effort required by the customer to use a humanoid AI device (Gursoy et al. 2019 ). In mixed physical and virtual spaces, the design and use of new public infrastructure may become increasingly complex, negatively affecting the lives of digitally disadvantaged groups. We believe that the simpler the new public infrastructure, the more it will attract digitally disadvantaged groups to use it, while also enhancing their intentions to use it. Therefore, we formulated the following hypothesis:
H5: Effort expectancy has a positive impact on digitally disadvantaged groups’ intentions to use the new public infrastructure integrating mixed physical and virtual spaces.
Venkatesh et al. ( 2003 ) defined facilitating conditions as the degree to which an individual believes that an organisation and its technical infrastructure exist to support the use of a system. In this paper, facilitating conditions refer to the external conditions that support digitally disadvantaged groups in using the new public infrastructure, including resources, knowledge bases, skills, etc. According to Zhong et al. ( 2021 ), facilitating conditions can affect users’ attitudes towards the use of face recognition payment systems and, further, affect their intentions to use them. Moreover, scholars have shown that facilitating conditions significantly promote people’s intentions to use e-learning systems and e-government (Abbad, 2021 ; Purohit et al. 2022 ). Currently, the new public infrastructure involves mixed physical and virtual spaces, and external facilitating conditions, such as a ‘knowledge salon’ or a training session, can significantly promote digitally disadvantaged groups’ intentions and willingness to the infrastructure. Therefore, we developed the following hypothesis:
H6: Facilitating conditions have a positive impact on digitally disadvantaged groups’ intentions to use the new public infrastructure integrating a mixed physical and virtual spaces.
Moderator variable
Magee et al. ( 1996 ) claimed that social interaction anxiety is an uncomfortable emotion that some people experience in social situations, leading to avoidance, a desire for solitude, and a fear of criticism. In this paper, social interaction anxiety refers to the worries and fears of digitally disadvantaged groups about the social interactions they will be exposed to when using the new public infrastructure. Research has confirmed that people with high levels of dissatisfaction with their own bodies are more anxious in social situations (Li Mo and Bai, 2023 ). Moreover, people with high degrees of social interaction anxiety may feel uncomfortable in front of strangers or when observed by others (Zhu and Deng, 2021 ). Digitally disadvantaged groups usually have some physiological inadequacies and may be rejected by ‘normal’ groups. Previous studies have shown that the pain caused by social exclusion is positively correlated with anxiety (Davidson et al. 2019 ). Digitally disadvantaged groups may have higher degrees of dissatisfaction with their own physical abilities, which may exacerbate any social interaction anxiety they already have. We believe that high social interaction anxiety is a common characteristic of digitally disadvantaged groups, defining them as ‘different’ from other groups.
In mixed physical and virtual spaces, if the design of the new public infrastructure is not friendly and does not help digitally disadvantaged groups use it easily, their perceived social exclusion is likely to increase, resulting in a heightened sense of anxiety. However, compared with face-to-face and offline social communication, online platforms offer convenience in terms of both communication method and duration (Ali et al. 2020 ). Therefore, people with a high degree of social interaction anxiety frequently prefer and are likely to choose online social communication (Hutchins et al. 2021 ). However, digitally disadvantaged groups may be unable to avoid social interaction by using the facilities offered in virtual spaces. Therefore, we believe that influencing factors may have different effects on intentions to use the new public infrastructure, according to the different levels of social interaction anxiety experienced. Therefore, we predicted the following:
H7: Social interaction anxiety has a moderating effect on each path.
Research methodology
Research background and cases.
To better demonstrate the phenomenon of the new public infrastructure integrating mixed physical and virtual spaces, we considered the cases of ‘Zheli Office’ (as shown in Fig. 3 ) and Alipay (as shown in Fig. 4 ) to explain the two areas of government affairs and daily life affairs, which greatly affect the daily lives of residents. Examining the functions of ‘Zheli Office’ and Alipay in mixed physical and virtual spaces allowed us to provide examples of the new public infrastructure integrating mixed physical and virtual spaces.

This figure shows the ‘Zheli Office’, it is a comprehensive government application that integrates government services through digital technology, transferring some processes from offline to online and greatly improving the convenience, efficiency, and personalisation of government services.

This figure shows Alipay, it supports the integration of various local services, such as live payments and convenient services, and has gradually become Zhejiang’s largest living service platform.
‘Zheli Office’ provides Zhejiang residents with a channel to handle their tax affairs. Residents who need to manage their tax affairs can choose the corresponding tax department through ‘Zheli Office’ and schedule the date and time for offline processing. Residents can also upload tax-related materials directly to ‘Zheli Office’ to submit them to the tax department for preapproval. Residents only need to present the vouchers generated by ‘Zheli Office’ to the tax department at the scheduled time to manage tax affairs and undergo final review. By mitigating long waiting times and tedious tax material review steps through the transfer of processes from physical spaces to virtual spaces, ‘Zheli Office’ greatly optimises the tax declaration process and saves residents time and effort in tax declaration.
Alipay provides residents with a channel to rent shared bicycles. Residents who want to rent bicycles can enter their personal information on Alipay in advance and provide a guarantee (an Alipay credit score or deposit payment). When renting a shared bicycle offline, residents only need to scan the QR code on the bike through Alipay to unlock and use it. When returning the bike, residents can also click the return button to automatically lock the bike and pay the fee anytime and anywhere. By automating leasing procedures and fee settlement in virtual spaces, Alipay avoids the tedious operations that residents experience when renting bicycles in physical stores.
Through the preceding two examples, we demonstrate the specific performance of the integration of virtual spaces and physical spaces. The government/life affairs of residents, such as tax declarations, certificate processing, transportation, shopping, and various other affairs, all require public infrastructure support. With the emergence of new digital trends in residents’ daily lives, mixed physical and virtual spaces have produced a public infrastructure that can support residents’ daily activities in mixed physical and virtual spaces. Due to the essential differences between public infrastructure involving mixed physical and virtual spaces and traditional physical and virtual public infrastructures, we propose a new concept—new public infrastructure. This is defined as ‘a public infrastructure that supports residents in conducting daily activities in mixed physical and virtual spaces’. It is worth noting that the new public infrastructure may encompass not only the virtual spaces provided by digital applications but also the physical spaces provided by machines capable of receiving digital messages, such as smart screens, scanners, and so forth.
The UN Sustainable Development Goal Report highlights that human society needs to build sustainable cities and communities that do not sacrifice the equality of some people. Digitally disadvantaged groups should not be excluded from the sustainable development of cities due to the increasing digitalisation trend because everyone should enjoy the convenience of the new public infrastructure provided by cities. Hence, ensuring that digitally disadvantaged groups can easily and comfortably use the new public infrastructure will help promote the construction of smart cities, making them more inclusive and universal. It will also promote the development of smart cities in a more equal and sustainable direction, ensuring that everyone can enjoy the benefits of urban development. Therefore, in this article, we emphasise the importance of digitally disadvantaged groups in the construction of sustainable smart cities. Through their participation and feedback, we can build more inclusive and sustainable smart cities in the future.
Research design
The aim of this paper was to explore the specific factors that influence the intentions of digitally disadvantaged groups to use the new public infrastructure integrating mixed physical and virtual spaces, and to provide a rational explanation for the role of each factor. To achieve this goal, we first reviewed numerous relevant academic papers. This formed the basis of our research assumptions and helped determine the measurement items we included. Second, we collected data through a questionnaire survey and then analysed the data using partial least squares structural equation modelling (PLS-SEM) to explore the influence of the different factors on digitally disadvantaged groups’ intentions to use the new public infrastructure. Finally, we considered in depth the mechanisms by which the various factors influenced digitally disadvantaged groups’ intentions to use mixed physical and virtual spaces.
We distributed a structured questionnaire to collect data for the study. To ensure the reliability and validity of the questionnaire, we based the item development on the scales used in previous studies (as shown in Appendix A). The first part of the questionnaire concerned the participants’ intentions to use the new public infrastructure. Responses to this part of the questionnaire were given on a seven-point Likert scale to measure the participants’ agreement or disagreement with various statements, with 1 indicating ‘strong disagreement’ and 7 indicating ‘strong agreement’. In addition, we designed cumulative scoring questions to measure the participants’ social interaction anxiety according to Fergus’s Social Interaction Anxiety Scale (Fergus et al. 2012 ). The second part of the questionnaire concerned the demographic characteristics of the participants, including but not limited to gender, age, and education level. Participants were informed that completing the survey was voluntary and that they had the right to refuse or withdraw at any time. They were informed that the researchers would not collect any personal information that would make it possible to identify them. Only after we had obtained the participants’ consent did we commence the questionnaire survey and data collection. Since the new public infrastructure referred to in this study was quite abstract, it was not conducive to the understanding and perceptions of digitally disadvantaged groups. Therefore, to better enable the respondents to understand our concept of the new public infrastructure, we simplified it to ‘an accessible infrastructure’ and informed them about typical cases and the relevant context of this study before they began to complete the questionnaire.
Once the questionnaire design was finalised, we conducted a pretest to ensure that the questions met the basic requirements of reliability and validity and that the participants could accurately understand the questions. In the formal questionnaire survey stage, we distributed the online questionnaire to digitally disadvantaged groups based on the principle of simple random sampling and collected data through the Questionnaire Star platform. Our sampling principle was based on the following points: first, the respondents had to belong to digitally disadvantaged groups and have experienced digital divide problems; second, they had to own at least one smart device and have access to the new public infrastructure, such as via ‘Zheli Office’ or Alipay, and third, they must have used government or daily life services on ‘Zheli Office’ or Alipay at least once in the past three months. After eliminating any invalid questionnaires, 337 valid completed questionnaires remained. The demographic characteristics of the participants are shown in Table 1 . In terms of gender, 54.30% of the participants were male, and 45.70% were female. In terms of age, 64.09% of the participants were aged 18–45 years. In terms of social interaction anxiety, the data showed that 46.59% of the participants had low social interaction anxiety, and 53.41% had high social interaction anxiety.
Data analysis
PLS-SEM imposes few restrictions on the measurement scale, sample size, and residual distribution (Ringle et al. 2012 ). However, the environment in which the research object was located was relatively new, so we added two special variables—psychological reactance and perceived institutional support—to the model. The PLS-SEM model was considered suitable for conducting exploratory research on the newly constructed theory and research framework. Building on previous experience, the data analysis was divided into two stages: 1) the measurement model was used to evaluate the reliability and validity of the experiment, and 2) the structural model was used to test the study hypotheses by examining the relationships between the variables.
Measurement model
First, we tested the reliability of the model by evaluating the reliability of the constructs. As shown in Table 2 , the Cronbach’s alpha (CA) range for this study was 0.858–0.901, so both extremes were higher than the acceptable threshold (Jöreskog, 1971 ). The composite reliability (CR) scores ranged from 0.904 to 0.931; therefore, both extremes were above the threshold of 0.7 (Bagozzi and Phillips, 1982 ) (see Table 2 ).
We then assessed the validity. The test for structural validity included convergent validity and discriminant validity. Convergent validity was mainly verified by the average variance extracted (AVE) value. The recommended value for AVE is 0.5 (Kim and Park, 2013 ). In this study, the AVE values for all structures far exceeded this value (the minimum AVE value was 0.702; see Table 2 ). This result showed that the structure of this model was reliable. The Fornell–Larcker criterion is commonly used to evaluate discriminant validity; that is, the square root of the AVE should be far larger than the correlations for other constructs, meaning that each construct best explains the variance of its own construct (Hair et al. 2014 ), as shown in Table 3 . The validity of the measurement model was further evaluated by calculating the cross-loading values of the reflection construct. It can clearly be seen from Table 4 that compared with other constructs included in the structural model, the indicators of the reflection metric model had the highest loading on their potential constructs (Hair et al. 2022 ), indicating that all inspection results met the evaluation criterion for cross-loading.
In addition, we used the heterotrait-monotrait (HTMT) ratio of correlations to analyse discriminant validity (Henseler et al. 2015 ). Generally, an HTMT value greater than 0.85 indicates that there are potential discriminant validity risks (Hair et al. 2022 ), but Table 5 shows that the HTMT ratios of the correlations in this study were all lower than this value (the maximum value was 0.844).
Structural model
Figure 5 presents the evaluation results for the structural model for the whole sample. The R 2 value for the structural model in this study was 0.740; that is, the explanatory power of the model regarding intention to use was 74.00%. The first step was to ensure that there was no significant collinearity between the predicted value structures, otherwise there would be redundancy in the analysis (Hair et al. 2019 ). All VIF values in this study were between 1.743 and 2.869 and were therefore lower than the 3.3 threshold value for the collinearity test (Hair et al. 2022 ), which proved that the path coefficient had not deviated. This also proves that the model had a low probability of common method bias.

This figure shows the evaluation results for the structural model.
As shown in Fig. 5 , performance expectation ( β = 0.505, p < 0.001), perceived institutional support ( β = 0.338, p < 0.001), perceived marketplace influence ( β = 0.190, p < 0.001), effort expectation ( β = 0.176, p < 0.001) and facilitating conditions ( β = 0.108, p < 0.001) all had significant and positive effects on intention to use. Moreover, the results showed that the relationship between psychological reaction ( β = −0.271, p < 0.001) and intention to use was negative and significant. Therefore, all the paths in this paper, except for the moderator variables, have been verified.
Multi-group analysis
To study the moderating effect between the independent variables and the dependent variables, Henseler et al. ( 2009 ) recommended using a multigroup analysis (MGA). In this study, we used MGA to analyse the moderating effect of different levels of social interaction anxiety. We designed six items for social interaction anxiety (as shown in Appendix A). According to the subjects’ responses to these six items and based on the principle of accumulation, questionnaires with scores of 6–20 indicated low social interaction anxiety, while questionnaires with scores of 28–42 indicated high social interaction anxiety. Questionnaires with scores of 21–27 were considered neutral and eliminated from the analysis involving social interaction anxiety. Based on multigroup validation factor analysis, we determined the component invariance, the configurable invariance, and the equality between compound variance and mean (Hair et al. 2019 ). As shown in Formula 1 , we used an independent sample t -test as a significance test, and a p -value below 0.05 indicated the significance of the parameters.
As shown in Table 6 , under social factors, the p -value for perceived institutional support in relation to intention to use was 0.335, which failed the significance test. This showed that there were no differences between the different degrees of social interaction anxiety. For technical factors, the p -value for facilitating conditions in relation to intention to use was 0.054, which again failed the test. This showed that there were no differences between the different levels of social interaction anxiety. However, the p -values for performance expectancy, psychological reaction, perceived marketplace influence, and effort expectancy in relation to intention to use were all less than 0.05; therefore, they passed the test for significance. This revealed that different degrees of social interaction anxiety had significant effects on these factors and that social interaction anxiety moderated some of the independent variables.
Next, we considered the path coefficients and p- values for the high and low social anxiety groups, as shown in Table 6 . First, with different levels of social anxiety, performance expectation had significantly different effects on intention to use, with low social anxiety ( β = −0.129, p = 0.394) failing the test and high social anxiety ( β = 0.202, p = 0.004) passing the test. This shows that high social anxiety levels had a greater influence of performance expectations on intention to use than low social anxiety levels. Second, psychological reactance showed significant differences in its effect on intention to use under different degrees of social anxiety, with low social anxiety ( β = 0.184, p = 0.065) failing the test and high social anxiety ( β = −0.466, p = 0.000) passing the test. Third, with different levels of social anxiety, perceived marketplace influence had significantly different effects on intention to use. Of these, perceived marketplace influence had a significant effect with low social anxiety levels ( β = 0.312, p = 0.001) but not with high social anxiety levels ( β = 0.085, p = 0.189). Finally, with differing degrees of social anxiety, expected effort had significantly different effects on intention to use. Of these, expected effort was insignificant at a low social anxiety level ( β = −0.058, p = 0.488), but it was significant at a high social anxiety level ( β = 0.326, p = 0.000). Therefore, different degrees of social interaction anxiety had significantly different effects on performance expectation, psychological reactance, perceived marketplace influence, and effort expectation.
Compared with previous studies, this study constituted a preliminary but groundbreaking exploration of mixed physical and virtual spaces. Moreover, we focused on the inclusivity problems encountered by digitally disadvantaged groups in these mixed physical and virtual spaces. We focused on performance expectancy, psychological reactance, perceived institutional support, perceived marketplace influence, effort expectancy, and facilitating conditions as the six factors, with intention to use being the measure of the perceived value of the new public infrastructure. However, digitally disadvantaged groups, depending on their own characteristics or social influences, can provoke different responses from the general population in their social interactions. Therefore, we added social interaction anxiety to the model as a moderating variable, in line with the assumed psychological characteristics of digitally disadvantaged groups. The empirical results revealed a strong correlation between influencing factors and intention to use. This shows that this model has good applicability for mixed physical and virtual spaces.
According to the empirical results, performance expectancy has a significant and positive impact on intention to use, suggesting that the mixing of the virtual and the real will create usage issues and cognitive difficulties for digitally disadvantaged groups. However, if the new public infrastructure can capitalise on the advantages of blended virtual and physical spaces, it could help users build confidence in its use, which would improve their intentions to use it. Furthermore, users’ intentions to use and high social interaction anxiety are likely to be promoted by performance expectancy. In most cases, social interaction anxiety stems from self-generated avoidance, isolation, and fear of criticism (Schultz and Heimberg, 2008 ). This may result in highly anxious digitally disadvantaged groups being reluctant to engage with others when using public facilities (Mulvale et al. 2019 ; Schou and Pors, 2019 ). However, the new public infrastructure is often unattended, which could be an advantage for users with high social anxiety. Therefore, the effect of performance expectancy in promoting intentions to use would be more significant in this group.
We also found that the psychological reactance of digitally disadvantaged groups had a reverse impact on their intentions to use technology in mixed physical and virtual spaces. However, social interaction anxiety had a moderating effect on this, such that the negative effect of psychological reactance on intention to use the new public infrastructure was more pronounced in the group with high social interaction anxiety. Facilities involving social or interactive factors may make users with high social interaction anxiety think that their autonomy is, to some extent, being violated, thus triggering subconscious resistance. The communication anxiety of digitally disadvantaged groups stems not only from the new public infrastructure itself but also from the environment in which it is used (Fang et al. 2019 ). Complex, mixed physical and virtual spaces can disrupt the habits that digitally disadvantaged groups have developed in purely physical spaces, resulting in greater anxiety (Hu et al. 2022 ), while groups with high levels of social anxiety tend to remain independent because they prefer to maintain their independence. Therefore, a high degree of social interaction anxiety will induce psychological reactance towards using the new public infrastructure.
The results of this paper shed further light on the role of social factors. In particular, the relationship between perceived institutional support and intention to use reflects the fact that perceived institutional support plays a role in promoting digitally disadvantaged groups’ intentions to use the new public infrastructure. This indicates that promotion measures need to be introduced by the government and public institutions if digitally disadvantaged groups are to accept the new public infrastructure. The development of a new public infrastructure integrating mixed physical and virtual spaces requires a high level of involvement from government institutions to facilitate the inclusive development of sustainable smart cities (Khan et al. 2020 ). An interesting finding of this study was that there were no significant differences between the effects of either high or low levels of social interaction anxiety on perceived institutional support and intention to use. This may be because social interaction anxiety mainly occurs in individuals within their close microenvironments. The policies and institutional norms of perceived institutional support tend to act at the macro level (Chen and Zhang, 2021 ; Mora et al. 2023 ), so levels of social interaction anxiety do not differ insignificantly between perceived institutional support and intentions to use the new public infrastructure.
We also found that digitally disadvantaged groups with low social interaction anxiety were more influenced by perceived marketplace influence. Consequently, they were more willing to use the new public infrastructure. When the market trend is to aggressively build a new public infrastructure, companies will accelerate their infrastructure upgrades to keep up with the trend (Hu et al. 2023 ; Liu and Zhao, 2022 ). Companies are increasingly incorporating virtual objects into familiar areas, forcing users to embrace mixed physical and virtual spaces. In addition, it is inevitable that digitally disadvantaged groups will have to use the new public infrastructure due to the market influence of people around them using this infrastructure to manage their government or life issues. When digitally disadvantaged groups with low levels of social interaction anxiety use the new public infrastructure, they are less likely to feel fearful and excluded (Kaihlanen et al. 2022 ) and will tend to be positively influenced by the use behaviours of others to use the new public infrastructure themselves (Troisi et al. 2022 ). The opposite is true for groups with high social interaction anxiety, which leads to significant differences in perceived marketplace influence and intentions to use among digitally disadvantaged groups with different levels of social interaction anxiety.
Existing mixed physical and virtual spaces exhibit exceptional technical complexity, and the results of this study affirm the importance of technical factors in affecting intentions to use. In this paper, we emphasised effort expectancy as the ease of use of the new public infrastructure (Venkatesh et al. 2003 ), which had a significant effect on digitally disadvantaged groups with high levels of social interaction anxiety but no significant effect on those with low levels of social interaction anxiety. Digitally disadvantaged groups with high levels of social interaction anxiety are likely to have a stronger sense of rejection due to environmental pressures if the new public infrastructure is too cumbersome to run or operate; they may therefore prefer using simple facilities and services. Numerous scholars have proven in educational (Hu et al. 2022 ), medical (Bai and Guo, 2022 ), business (Susanto et al. 2018 ), and other fields that good product design promotes users’ intentions to use technology (Chen et al. 2023 ). For digitally disadvantaged groups, accessible and inclusive product designs can more effectively incentivise their intentions to use the new public infrastructure (Hsu and Peng, 2022 ).
Facilitating conditions are technical factors that represent facility-related support services. The study results showed a significant positive effect of facilitating conditions on intention to use. This result is consistent with the results of previous studies regarding physical space. Professional consultation (Vinnikova et al. 2020 ) and training (Yang et al. 2023 ) on products in conventional fields can enhance users’ confidence, which can then be translated into intentions to use (Saparudin et al. 2020 ). Although the form of the new public infrastructure has changed in the direction of integration, its target object is still the user in physical space. Therefore, better facilitating conditions can enhance users’ sense of trust and promote their intentions to use (Alalwan et al. 2017 ; Mogaji et al. 2021 ). Concerning integration, because the new public infrastructure can assume multiple forms, it is difficult for digitally disadvantaged groups to know whether a particular infrastructure has good facilitating conditions. It is precisely such uncertainties that cause users with high social interaction anxiety to worry that they will be unable to use the facilities effectively. They may then worry that they will be burdened by scrutiny from strangers, causing resistance. Even when good facilitating conditions exist, groups with high social interaction anxiety do not necessarily intend to use them. Therefore, there were no significant differences between the different levels of social interaction anxiety in terms of facilitating conditions and intention to use them.
Theoretical value
In this study, we mainly examined the factors influencing digitally disadvantaged groups’ intentions to use the new public infrastructure consisting of mixed physical and virtual spaces. The empirical results of this paper make theoretical contributions to the inclusive construction of mixed spaces in several areas.
First, based on an understanding of urban development involving a deep integration of physical space with virtual space, we contextualise virtual space within the parameters of public infrastructure to shape the concept of a new public infrastructure. At the same time, by including the service system, the virtual community, and other non-physical factors in the realm where the virtual and the real are integrated, we form a concept of mixed physical and virtual spaces, which expands the scope of research related to virtual and physical spaces and provides new ideas for relevant future research.
Second, this paper makes a preliminary investigation of inclusion in the construction of the new public infrastructure and innovatively examines the factors that affect digitally disadvantaged groups’ willingness to use the mixed infrastructure, considering them in terms of individual, social, and technical factors. Moreover, holding that social interaction anxiety is consistent with the psychological characteristics of digitally disadvantaged groups, we introduce social interaction anxiety into the research field and distinguish between the performance of subjects with high social interaction anxiety and the performance of those with low social interaction anxiety. From the perspective of digitally disadvantaged groups, this shows the regulatory effect of social interaction anxiety on users’ psychology and behaviours. These preliminary findings may lead to greater attention being paid to digitally disadvantaged groups and prompt more studies on inclusion.
In addition, while conducting background research, we visited public welfare organisations and viewed government service lists to obtain first-hand information about digitally disadvantaged groups. Through our paper, we encourage the academic community to pay greater attention to theoretical research on digitally disadvantaged groups in the hope that deepening and broadening such research will promote the inclusion of digitally disadvantaged groups in the design of public infrastructure.
Practical value
Based on a large quantity of empirical research data, we explored the digital integration factors that affect users’ intentions to use the new public infrastructure. To some extent, this provides new ideas and development directions for inclusive smart city construction. Inclusion in existing cities mainly concerns the improvement of specific technologies, but the results of this study show that technological factors are only part of the picture. The government should introduce relevant policies to promptly adapt the new public infrastructure to digitally disadvantaged groups, and the legislature should enact appropriate laws. In addition, the study results can guide the design of mixed physical and virtual spaces for the new public infrastructure. Enterprises can refer to the results of this study to identify inconveniences in their existing facilities, optimise their service processes, and improve the inclusiveness of urban institutions. Furthermore, attention should be paid to the moderating role of social interaction anxiety in the process. Inclusive urban construction should not only be physical but should closely consider the inner workings of digitally disadvantaged groups. The government and enterprises should consider the specific requirements of people with high social interaction anxiety, such as by simplifying the enquiry processes in their facilities or inserting psychological comfort measures into the processes.
Limitations and future research
Due to resource and time limitations, this paper has some shortcomings. First, we considered a broad range of digitally disadvantaged groups and conducted a forward-looking exploratory study. Since we collected data through an online questionnaire, there were restrictions on the range of volunteers who responded. Only if participants met at least one of the conditions could they be identified as members of digitally disadvantaged groups and participate in a follow-up survey. To reduce the participants’ introspection and painful recollections of their disabilities or related conditions, and to avoid expected deviations from the data obtained through the survey, we made no detailed distinction between the participants’ degrees of impairment or the reasons for impairment. We adopted a twofold experimental approach.: first, a questionnaire that was too detailed might have infringed on the participants’ privacy rights, and second, since little research has been conducted on inclusiveness in relation to mixed physical and virtual spaces, this work was pioneering. Therefore, we paid greater attention to digitally disadvantaged groups’ intentions to use the new public infrastructure. In future research, we could focus on digitally disadvantaged individuals who exhibit the same deficiencies, or further increase the sample size to investigate the participants’ intentions to use the new public infrastructure in more detail.
Second, different countries have different economic development statuses and numbers of digitally disadvantaged groups. Our study mainly concerned the willingness of digitally disadvantaged groups to use the new public infrastructure in China. Therefore, in the future, the intentions of digitally disadvantaged groups to use new public infrastructures involving mixed physical and virtual spaces can be further explored in different national contexts. Furthermore, in addition to the effects of social interaction anxiety examined in this paper, future researchers could consider other moderators associated with individual differences, such as age, familiarity with technology, and disability status. We also call for more scholars to explore digitally disadvantaged groups’ use of the new public infrastructure to promote inclusive smart city construction and sustainable social development.
Previous researchers have explored users’ intentions to use virtual technology services and have analysed the factors that influence those intentions (Akdim et al. 2022 ; Liébana-Cabanillas et al. 2020 ; Nguyen and Dao, 2024 ). However, researchers have mainly focused on single virtual or physical spaces (Scavarelli et al. 2021 ; Zhang et al. 2020 ), and the topic has rarely been discussed in relation to mixed physical and virtual spaces. In addition, previous studies have mainly considered the technology perspective (Buckingham et al. 2022 ; Carney and Kandt, 2022 ), and the influence of digitally disadvantaged groups’ psychological characteristics and the effect of the overall social environment on their intentions to use have largely been ignored. To fill this gap, we constructed a UTAUT-based model for intentions to use the new public infrastructure that involved a mixing of physical and virtual spaces. We considered the mechanisms influencing digitally disadvantaged groups’ use of the new public infrastructure, considering them from the perspectives of individual, social, and technical factors. We processed and analysed 337 valid samples using PLS-SEM. The results showed that there were significant correlations between the six user factor variables and intention to use the new public infrastructure. In addition, for digitally disadvantaged groups, different degrees of social interaction anxiety had significantly different effects on the impacts of performance expectancy, psychological reactance, perceived marketplace influence, and effort expectancy on intention to use, while there were no differences in the impacts of perceived institutional support and facilitating conditions on intention to use.
In the theoretical value, we build on previous scholarly research on the conceptualisation of new public infrastructures, mixed physical and virtual spaces (Aslesen et al. 2019 ; Cocciolo, 2010 ), arguing for user, social and technological dimensions influencing the use of new public infrastructures by digitally disadvantaged groups in mixed physical and virtual spaces, and for the moderating role of social interaction anxiety. Meanwhile, this study prospectively explores the new phenomenon of digitally disadvantaged groups using new public infrastructures in mixed physical and virtual spaces, which paves the way for future scholars to explore the field both in theory and literature. In the practical value, the research findings will be helpful in promoting effective government policies and corporate designs and in prompting the development of a new public infrastructure that better meets the needs of digitally disadvantaged groups. Moreover, this study will help to direct social and government attention to the problems that exist in the use of new public infrastructures by digitally disadvantaged groups. It will have a significant implication for the future development of smart cities and urban digital inclusiveness in China and worldwide.
Data availability
The datasets generated during and/or analysed during the current study are not publicly available due to the confidentiality of the respondents’ information but are available from the corresponding author upon reasonable request for academic purposes only.
Abbad MMM (2021) Using the UTAUT model to understand students’ usage of e-learning systems in developing countries. Educ. Inf. Technol. 26(6):7205–7224. https://doi.org/10.1007/s10639-021-10573-5
Article Google Scholar
Acharya B, Lee J, Moon H (2022) Preference heterogeneity of local government for implementing ICT infrastructure and services through public-private partnership mechanism. Socio-Economic Plan. Sci. 79(9):101103. https://doi.org/10.1016/j.seps.2021.101103
Ahn MJ, Chen YC (2022) Digital transformation toward AI-augmented public administration: the perception of government employees and the willingness to use AI in government. Gov. Inf. Q. 39(2):101664. https://doi.org/10.1016/j.giq.2021.101664
Akdim K, Casalo LV, Flavián C (2022) The role of utilitarian and hedonic aspects in the continuance intention to use social mobile apps. J. Retail. Consum. Serv. 66:102888. https://doi.org/10.1016/j.jretconser.2021.102888
Al-Masri AN, Ijeh A, Nasir M (2019) Smart city framework development: challenges and solutions. Smart Technologies and Innovation for a Sustainable Future, Cham
Google Scholar
Alalwan AA, Dwivedi YK, Rana NP (2017) Factors influencing adoption of mobile banking by Jordanian bank customers: extending UTAUT2 with trust. Int. J. Inf. Manag. 37(3):99–110. https://doi.org/10.1016/j.ijinfomgt.2017.01.002
Ali A, Li C, Hussain A, Bakhtawar (2020) Hedonic shopping motivations and obsessive–compulsive buying on the internet. Glob. Bus. Rev. 25(1):198–215. https://doi.org/10.1177/0972150920937535
Ali U, Mehmood A, Majeed MF, Muhammad S, Khan MK, Song HB, Malik KM (2019) Innovative citizen’s services through public cloud in Pakistan: user’s privacy concerns and impacts on adoption. Mob. Netw. Appl. 24(1):47–68. https://doi.org/10.1007/s11036-018-1132-x
Almaiah MA, Alamri MM, Al-Rahmi W (2019) Applying the UTAUT model to explain the students’ acceptance of mobile learning system in higher education. IEEE Access 7:174673–174686. https://doi.org/10.1109/access.2019.2957206
Annaswamy TM, Verduzco-Gutierrez M, Frieden L (2020) Telemedicine barriers and challenges for persons with disabilities: COVID-19 and beyond. Disabil Health J 13(4):100973. https://doi.org/10.1016/j.dhjo.2020.100973.3
Article PubMed PubMed Central Google Scholar
Aslesen HW, Martin R, Sardo S (2019) The virtual is reality! On physical and virtual space in software firms’ knowledge formation. Entrepreneurship Regional Dev. 31(9-10):669–682. https://doi.org/10.1080/08985626.2018.1552314
Bagozzi RP, Phillips LW (1982) Representing and testing organizational theories: a holistic construal. Adm. Sci. Q. 27(3):459–489. https://doi.org/10.2307/2392322
Bai B, Guo ZQ (2022) Understanding users’ continuance usage behavior towards digital health information system driven by the digital revolution under COVID-19 context: an extended UTAUT model. Psychol. Res. Behav. Manag. 15:2831–2842. https://doi.org/10.2147/prbm.S364275
Bélanger F, Carter L (2008) Trust and risk in e-government adoption. J. Strategic Inf. Syst. 17(2):165–176. https://doi.org/10.1016/j.jsis.2007.12.002
Blasi S, Ganzaroli A, De Noni I (2022) Smartening sustainable development in cities: strengthening the theoretical linkage between smart cities and SDGs. Sustain. Cities Soc. 80:103793. https://doi.org/10.1016/j.scs.2022.103793
Botelho FHF (2021) Accessibility to digital technology: virtual barriers, real opportunities. Assistive Technol. 33:27–34. https://doi.org/10.1080/10400435.2021.1945705
Brehm, JW (1966). A theory of psychological reactance . Academic Press
Buckingham SA, Walker T, Morrissey K, Smartline Project T (2022) The feasibility and acceptability of digital technology for health and wellbeing in social housing residents in Cornwall: a qualitative scoping study. Digital Health 8:20552076221074124. https://doi.org/10.1177/20552076221074124
Bygrave W, Minniti M (2000) The social dynamics of entrepreneurship. Entrepreneurship Theory Pract. 24(3):25–36. https://doi.org/10.1177/104225870002400302
Cai Y, Qi W, Yi FM (2023) Smartphone use and willingness to adopt digital pest and disease management: evidence from litchi growers in rural China. Agribusiness 39(1):131–147. https://doi.org/10.1002/agr.21766
Carney F, Kandt J (2022) Health, out-of-home activities and digital inclusion in later life: implications for emerging mobility services. Journal of Transport & Health 24:101311. https://doi.org/10.1016/j.jth.2021.101311
Chao CM (2019) Factors determining the behavioral intention to use mobile learning: an application and extension of the UTAUT model. Front. Psychol. 10:1652. https://doi.org/10.3389/fpsyg.2019.01652
Chen HY, Chen HY, Zhang W, Yang CD, Cui HX (2021) Research on marketing prediction model based on Markov Prediction. Wirel. Commun. Mob. Comput. 2021(9):4535181. https://doi.org/10.1155/2021/4535181
Chen J, Cui MY, Levinson D (2024) The cost of working: measuring physical and virtual access to jobs. Int. J. Urban Sci. 28(2):318–334. https://doi.org/10.1080/12265934.2023.2253208
Chen JX, Wang T, Fang ZY, Wang HT (2023) Research on elderly users’ intentions to accept wearable devices based on the improved UTAUT model. Front. Public Health 10(12):1035398. https://doi.org/10.3389/fpubh.2022.1035398
Chen KF, Guaralda M, Kerr J, Turkay S (2024) Digital intervention in the city: a conceptual framework for digital placemaking. Urban Des. Int. 29(1):26–38. https://doi.org/10.1057/s41289-022-00203-y
Chen L, Zhang H (2021) Strategic authoritarianism: the political cycles and selectivity of China’s tax-break policy. Am. J. Political Sci. 65(4):845–861. https://doi.org/10.1111/ajps.12648
Chiu YTH, Hofer KM (2015) Service innovation and usage intention: a cross-market analysis. J. Serv. Manag. 26(3):516–538. https://doi.org/10.1108/josm-10-2014-0274
Chou SW, Min HT, Chang YC, Lin CT (2010) Understanding continuance intention of knowledge creation using extended expectation-confirmation theory: an empirical study of Taiwan and China online communities. Behav. Inf. Technol. 29(6):557–570. https://doi.org/10.1080/01449290903401986
Cocciolo A (2010) Alleviating physical space constraints using virtual space? A study from an urban academic library. Libr. Hi Tech. 28(4):523–535. https://doi.org/10.1108/07378831011096204
Davidson CA, Willner CJ, van Noordt SJR, Banz BC, Wu J, Kenney JG, Johannesen JK, Crowley MJ (2019) One-month stability of cyberball post-exclusion ostracism distress in Adolescents. J. Psychopathol. Behav. Assess. 41(3):400–408. https://doi.org/10.1007/s10862-019-09723-4
Dogruel L, Joeckel S, Bowman ND (2015) The use and acceptance of new media entertainment technology by elderly users: development of an expanded technology acceptance model. Behav. Inf. Technol. 34(11):1052–1063. https://doi.org/10.1080/0144929x.2015.1077890
Fang ML, Canham SL, Battersby L, Sixsmith J, Wada M, Sixsmith A (2019) Exploring privilege in the digital divide: implications for theory, policy, and practice. Gerontologist 59(1):E1–E15. https://doi.org/10.1093/geront/gny037
Article PubMed Google Scholar
Fergus TA, Valentiner DP, McGrath PB, Gier-Lonsway SL, Kim HS (2012) Short forms of the social interaction anxiety scale and the social phobia scale. J. Personal. Assess. 94(3):310–320. https://doi.org/10.1080/00223891.2012.660291
Garone A, Pynoo B, Tondeur J, Cocquyt C, Vanslambrouck S, Bruggeman B, Struyven K (2019) Clustering university teaching staff through UTAUT: implications for the acceptance of a new learning management system. Br. J. Educ. Technol. 50(5):2466–2483. https://doi.org/10.1111/bjet.12867
Gu QH, Iop (2020) Frame-based conceptual model of smart city’s applications in China. International Conference on Green Development and Environmental Science and Technology (ICGDE), Changsha, CHINA
Book Google Scholar
Guo MJ, Liu YH, Yu HB, Hu BY, Sang ZQ (2016) An overview of smart city in China. China Commun. 13(5):203–211. https://doi.org/10.1109/cc.2016.7489987
Gursoy D, Chi OHX, Lu L, Nunkoo R (2019) Consumers acceptance of artificially intelligent (AI) device use in service delivery. Int. J. Inf. Manag. 49:157–169. https://doi.org/10.1016/j.ijinfomgt.2019.03.008
Hair, JF, Hult, GTM, Ringle, CM, & Sarstedt, M (2022). A primer on partial least squares structural equation modeling (PLS-SEM) (Third edition. ed.). SAGE Publications, Inc
Hair Jr JF, Sarstedt M, Hopkins L, Kuppelwieser VG (2014) Partial least squares structural equation modeling (PLS-SEM): an emerging tool in business research. Eur. Bus. Rev. 26(2):106–121. https://doi.org/10.1108/ebr-10-2013-0128
Hair JF, Risher JJ, Sarstedt M, Ringle CM (2019) When to use and how to report the results of PLS-SEM. Eur. Bus. Rev. 31(1):2–24. https://doi.org/10.1108/ebr-11-2018-0203
Heerink M, Kröse B, Evers V, Wielinga B (2010) Assessing acceptance of assistive social agent technology by older adults: the almere model. Int. J. Soc. Robot. 2(4):361–375. https://doi.org/10.1007/s12369-010-0068-5
Henseler J, Ringle CM, Sarstedt M (2015) A new criterion for assessing discriminant validity in variance-based structural equation modeling. J. Acad. Mark. Sci. 43(1):115–135. https://doi.org/10.1007/s11747-014-0403-8
Henseler, J, Ringle, CM, & Sinkovics, RR (2009). The use of partial least squares path modeling in international marketing. In RR Sinkovics & PN Ghauri (Eds.), New Challenges to International Marketing (Vol. 20, pp. 277-319). Emerald Group Publishing Limited. https://doi.org/10.1108/S1474-7979 (2009)0000020014
Hoque R, Sorwar G (2017) Understanding factors influencing the adoption of mHealth by the elderly: an extension of the UTAUT model. Int. J. Med. Inform. 101:75–84. https://doi.org/10.1016/j.ijmedinf.2017.02.002
Hsu CW, Peng CC (2022) What drives older adults’ use of mobile registration apps in Taiwan? An investigation using the extended UTAUT model. Inform. Health Soc. Care 47(3):258–273. https://doi.org/10.1080/17538157.2021.1990299
Hu J, Zhang H, Irfan M (2023) How does digital infrastructure construction affect low-carbon development? A multidimensional interpretation of evidence from China. J. Clean. Prod. 396(9):136467. https://doi.org/10.1016/j.jclepro.2023.136467
Hu TF, Guo RS, Chen C (2022) Understanding mobile payment adaption with the integrated model of UTAUT and MOA model. 2022 Portland International Conference on Management of Engineering and Technology (PICMET), Portland, OR, USA
Hutchins N, Allen A, Curran M, Kannis-Dymand L (2021) Social anxiety and online social interaction. Aust. Psychologist 56(2):142–153. https://doi.org/10.1080/00050067.2021.1890977
Iancu I, Iancu B (2020) Designing mobile technology for elderly. A theoretical overview. Technol. Forecast. Soc. Change 155(9):119977. https://doi.org/10.1016/j.techfore.2020.119977
Jakonen, OI (2024). Smart cities, virtual futures? - Interests of urban actors in mediating digital technology and urban space in Tallinn, Estonia. Urban Studies , 17. https://doi.org/10.1177/00420980241245871
Ji TT, Chen JH, Wei HH, Su YC (2021) Towards people-centric smart city development: investigating the citizens’ preferences and perceptions about smart-city services in Taiwan. Sustain. Cities Soc. 67(14):102691. https://doi.org/10.1016/j.scs.2020.102691
Jöreskog KG (1971) Simultaneous factor analysis in several populations. Psychometrika 36(4):409–426. https://doi.org/10.1007/BF02291366
Joshi Y, Uniyal DP, Sangroya D (2021) Investigating consumers’ green purchase intention: examining the role of economic value, emotional value and perceived marketplace influence. J. Clean. Prod. 328(8):129638. https://doi.org/10.1016/j.jclepro.2021.129638
Kadylak T, Cotten SR (2020) United States older adults’ willingness to use emerging technologies. Inf. Commun. Soc. 23(5):736–750. https://doi.org/10.1080/1369118x.2020.1713848
Kaihlanen AM, Virtanen L, Buchert U, Safarov N, Valkonen P, Hietapakka L, Hörhammer I, Kujala S, Kouvonen A, Heponiemi T (2022) Towards digital health equity-a qualitative study of the challenges experienced by vulnerable groups in using digital health services in the COVID-19 era. BMC Health Services Research 22(1):188. https://doi.org/10.1186/s12913-022-07584-4
Khan HH, Malik MN, Zafar R, Goni FA, Chofreh AG, Klemes JJ, Alotaibi Y (2020) Challenges for sustainable smart city development: a conceptual framework. Sustain. Dev. 28(5):1507–1518. https://doi.org/10.1002/sd.2090
Kim S, Park H (2013) Effects of various characteristics of social commerce (s-commerce) on consumers’ trust and trust performance. Int. J. Inf. Manag. 33(2):318–332. https://doi.org/10.1016/j.ijinfomgt.2012.11.006
Leary RB, Vann RJ, Mittelstaedt JD (2019) Perceived marketplace influence and consumer ethical action. J. Consum. Aff. 53(3):1117–1145. https://doi.org/10.1111/joca.12220
Leary RB, Vann RJ, Mittelstaedt JD, Murphy PE, Sherry JF (2014) Changing the marketplace one behavior at a time: perceived marketplace influence and sustainable consumption. J. Bus. Res. 67(9):1953–1958. https://doi.org/10.1016/j.jbusres.2013.11.004
Lee DD, Arya LA, Andy UU, Sammel MD, Harvie HS (2019) Willingness of women with pelvic floor disorders to use mobile technology to communicate with their health care providers. Female Pelvic Med. Reconstructive Surg. 25(2):134–138. https://doi.org/10.1097/spv.0000000000000668
Lee SW, Sung HJ, Jeon HM (2019) Determinants of continuous intention on food delivery apps: extending UTAUT2 with information quality. Sustainability 11(11):3141. https://doi.org/10.3390/su11113141 . 15
Li Mo QZ, Bai BY (2023) Height dissatisfaction and loneliness among adolescents: the chain mediating role of social anxiety and social support. Curr. Psychol. 42(31):27296–27304. https://doi.org/10.1007/s12144-022-03855-9
Liébana-Cabanillas F, Japutra A, Molinillo S, Singh N, Sinha N (2020) Assessment of mobile technology use in the emerging market: analyzing intention to use m-payment services in India. Telecommun. Policy 44(9):102009. https://doi.org/10.1016/j.telpol.2020.102009 . 17
Liu HD, Zhao HF (2022) Upgrading models, evolutionary mechanisms and vertical cases of service-oriented manufacturing in SVC leading enterprises: product-development and service-innovation for industry 4.0. Humanities Soc. Sci. Commun. 9(1):387. https://doi.org/10.1057/s41599-022-01409-9 . 24
Liu ZL, Wang Y, Xu Q, Yan T, Iop (2017) Study on smart city construction of Jiujiang based on IOT technology. 3rd International Conference on Advances in Energy, Environment and Chemical Engineering (AEECE), Chengdu, CHINA
Magee WJ, Eaton WW, Wittchen H-U, McGonagle KA, Kessler RC (1996) Agoraphobia, simple phobia, and social phobia in the National Comorbidity Survey. Arch. Gen. Psychiatry 53(2):159–168
Article CAS PubMed Google Scholar
Martins R, Oliveira T, Thomas M, Tomás S (2019) Firms’ continuance intention on SaaS use - an empirical study. Inf. Technol. People 32(1):189–216. https://doi.org/10.1108/itp-01-2018-0027
Miron AM, Brehm JW (2006) Reactance theory - 40 Years later. Z. Fur Sozialpsychologie 37(1):9–18. https://doi.org/10.1024/0044-3514.37.1.9
Mogaji E, Balakrishnan J, Nwoba AC, Nguyen NP (2021) Emerging-market consumers’ interactions with banking chatbots. Telematics and Informatics 65:101711. https://doi.org/10.1016/j.tele.2021.101711
Mogaji E, Bosah G, Nguyen NP (2023) Transport and mobility decisions of consumers with disabilities. J. Consum. Behav. 22(2):422–438. https://doi.org/10.1002/cb.2089
Mogaji E, Nguyen NP (2021) Transportation satisfaction of disabled passengers: evidence from a developing country. Transportation Res. Part D.-Transp. Environ. 98:102982. https://doi.org/10.1016/j.trd.2021.102982
Mora L, Gerli P, Ardito L, Petruzzelli AM (2023) Smart city governance from an innovation management perspective: theoretical framing, review of current practices, and future research agenda. Technovation 123:102717. https://doi.org/10.1016/j.technovation.2023.102717
Mulvale G, Moll S, Miatello A, Robert G, Larkin M, Palmer VJ, Powell A, Gable C, Girling M (2019) Codesigning health and other public services with vulnerable and disadvantaged populations: insights from an international collaboration. Health Expectations 22(3):284–297. https://doi.org/10.1111/hex.12864
Narzt W, Mayerhofer S, Weichselbaum O, Pomberger G, Tarkus A, Schumann M (2016) Designing and evaluating barrier-free travel assistance services. 3rd International Conference on HCI in Business, Government, and Organizations - Information Systems (HCIBGO) Held as Part of 18th International Conference on Human-Computer Interaction (HCI International), Toronto, CANADA
Nguyen GD, Dao THT (2024) Factors influencing continuance intention to use mobile banking: an extended expectation-confirmation model with moderating role of trust. Humanities Soc. Sci. Commun. 11(1):276. https://doi.org/10.1057/s41599-024-02778-z
Nicolas C, Kim J, Chi S (2020) Quantifying the dynamic effects of smart city development enablers using structural equation modeling. Sustain. Cities Soc. 53:101916. https://doi.org/10.1016/j.scs.2019.101916
Paköz MZ, Sözer C, Dogan A (2022) Changing perceptions and usage of public and pseudo-public spaces in the post-pandemic city: the case of Istanbul. Urban Des. Int. 27(1):64–79. https://doi.org/10.1057/s41289-020-00147-1
Perez AJ, Siddiqui F, Zeadally S, Lane D (2023) A review of IoT systems to enable independence for the elderly and disabled individuals. Internet Things 21:100653. https://doi.org/10.1016/j.iot.2022.100653
Purohit S, Arora R, Paul J (2022) The bright side of online consumer behavior: continuance intention for mobile payments. J. Consum. Behav. 21(3):523–542. https://doi.org/10.1002/cb.2017
Ringle CM, Sarstedt M, Straub DW (2012) Editor’s Comments: A Critical Look at the Use of PLS-SEM in “MIS Quarterly”. MIS Q. 36(1):III–XIV
Roubroeks MAJ, Ham JRC, Midden CJH (2010) The dominant robot: threatening robots cause psychological reactance, especially when they have incongruent goals. 5th International Conference on Persuasive Technology, Copenhagen, DENMARK
Saparudin M, Rahayu A, Hurriyati R, Sultan MA, Ramdan AM, Ieee (2020) Consumers’ continuance intention use of mobile banking in Jakarta: extending UTAUT models with trust. 5th International Conference on Information Management and Technology (ICIMTech), Bandung, Indonesia
Scavarelli A, Arya A, Teather RJ (2021) Virtual reality and augmented reality in social learning spaces: a literature review. Virtual Real. 25(1):257–277. https://doi.org/10.1007/s10055-020-00444-8
Schneider AB, Leonard B (2022) From anxiety to control: mask-wearing, perceived marketplace influence, and emotional well-being during the COVID-19 pandemic. J. Consum. Aff. 56(1):97–119. https://doi.org/10.1111/joca.12412
Schou J, Pors AS (2019) Digital by default? A qualitative study of exclusion in digitalised welfare. Soc. Policy Adm. 53(3):464–477. https://doi.org/10.1111/spol.12470
Schultz LT, Heimberg RG (2008) Attentional focus in social anxiety disorder: potential for interactive processes. Clin. Psychol. Rev. 28(7):1206–1221. https://doi.org/10.1016/j.cpr.2008.04.003
Shibusawa H (2000) Cyberspace and physical space in an urban economy. Pap. Regional Sci. 79(3):253–270. https://doi.org/10.1007/pl00013610
Susanto A, Mahadika PR, Subiyakto A, Nuryasin, Ieee (2018) Analysis of electronic ticketing system acceptance using an extended unified theory of acceptance and use of technology (UTAUT). 6th International Conference on Cyber and IT Service Management (CITSM), Parapat, Indonesia
Susilawati C, Wong J, Chikolwa B (2010) Public participation, values and interests in the procurement of infrastructure projects in Australia: a review and future research direction. 2010 International Conference on Construction and Real Estate Management, Brisbane, Australia
Tam C, Santos D, Oliveira T (2020) Exploring the influential factors of continuance intention to use mobile Apps: extending the expectation confirmation model. Inf. Syst. Front. 22(1):243–257. https://doi.org/10.1007/s10796-018-9864-5
Teo T, Zhou MM, Fan ACW, Huang F (2019) Factors that influence university students’ intention to use Moodle: a study in Macau. EtrD-Educ. Technol. Res. Dev. 67(3):749–766. https://doi.org/10.1007/s11423-019-09650-x
Thapa S, Nielsen JB, Aldahmash AM, Qadri FR, Leppin A (2021) Willingness to use digital health tools in patient care among health care professionals and students at a university hospital in Saudi Arabia: quantitative cross-sectional survey. JMIR Med. Educ. 7(1):e18590. https://doi.org/10.2196/18590
Tian X, Solomon DH, Brisini KS (2020) How the comforting process fails: psychological reactance to support messages. J. Commun. 70(1):13–34. https://doi.org/10.1093/joc/jqz040
Troisi O, Fenza G, Grimaldi M, Loia F (2022) Covid-19 sentiments in smart cities: the role of technology anxiety before and during the pandemic. Computers in Human Behavior 126:106986. https://doi.org/10.1016/j.chb.2021.106986
Venkatesh V, Brown SA (2001) A longitudinal investigation of personal computers in homes: adoption determinants and emerging challenges. MIS Q. 25(1):71–102. https://doi.org/10.2307/3250959
Venkatesh V, Morris MG, Davis GB, Davis FD (2003) User acceptance of information technology: toward a unified view. MIS Q. 27(3):425–478. https://doi.org/10.2307/30036540
Vinnikova A, Lu LD, Wei JC, Fang GB, Yan J (2020) The Use of smartphone fitness applications: the role of self-efficacy and self-regulation. International Journal of Environmental Research and Public Health 17(20):7639. https://doi.org/10.3390/ijerph17207639
Wang BA, Zhang R, Wang Y (2021) Mechanism influencing older people’s willingness to use intelligent aged-care products. Healthcare 9(7):864. https://doi.org/10.3390/healthcare9070864
Wang CHJ, Steinfeld E, Maisel JL, Kang B (2021) Is your smart city inclusive? Evaluating proposals from the US department of transportation’s smart city challenge. Sustainable Cities and Society 74:103148. https://doi.org/10.1016/j.scs.2021.103148
Wang XY (2007) Mutually augmented virtual environments for architecural design and collaboration. 12th Computer-Aided Architectural Design Futures Conference, Sydney, Australia
Werner P, Karnieli E (2003) A model of the willingness to use telemedicine for routine and specialized care. J. Telemed. Telecare 9(5):264–272. https://doi.org/10.1258/135763303769211274
Yadav J, Saini AK, Yadav AK (2019) Measuring citizens engagement in e-Government projects - Indian perspective. J. Stat. Manag. Syst. 22(2):327–346. https://doi.org/10.1080/09720510.2019.1580908
Yang CC, Liu C, Wang YS (2023) The acceptance and use of smartphones among older adults: differences in UTAUT determinants before and after training. Libr. Hi Tech. 41(5):1357–1375. https://doi.org/10.1108/lht-12-2021-0432
Yang K, Forney JC (2013) The moderating role of consumer technology anxiety in mobile shopping adoption: differential effects of facilitating conditions and social influences. J. Electron. Commer. Res. 14(4):334–347
Yeung HL, Hao P (2024) Telecommuting amid Covid-19: the Governmobility of work-from-home employees in Hong Kong. Cities 148:104873. https://doi.org/10.1016/j.cities.2024.104873
Zander V, Gustafsson C, Stridsberg SL, Borg J (2023) Implementation of welfare technology: a systematic review of barriers and facilitators. Disabil. Rehabilitation-Assistive Technol. 18(6):913–928. https://doi.org/10.1080/17483107.2021.1938707
Zeebaree M, Agoyi M, Agel M (2022) Sustainable adoption of e-government from the UTAUT perspective. Sustainability 14(9):5370. https://doi.org/10.3390/su14095370
Zhang YX, Liu HX, Kang SC, Al-Hussein M (2020) Virtual reality applications for the built environment: Research trends and opportunities. Autom. Constr. 118:103311. https://doi.org/10.1016/j.autcon.2020.103311
Zhong YP, Oh S, Moon HC (2021) Service transformation under industry 4.0: investigating acceptance of facial recognition payment through an extended technology acceptance model. Technology in Society 64:101515. https://doi.org/10.1016/j.techsoc.2020.101515
Zhu DH, Deng ZZ (2021) Effect of social anxiety on the adoption of robotic training partner. Cyberpsychology Behav. Soc. Netw. 24(5):343–348. https://doi.org/10.1089/cyber.2020.0179
Download references
Acknowledgements
This research was supported by the National Social Science Foundation of China, grant number 22BGJ037; the Fundamental Research Funds for the Provincial Universities of Zhejiang, grant number GB202301004; and the Zhejiang Province University Students Science and Technology Innovation Activity Program, grant numbers 2023R403013, 2023R403010 & 2023R403086.
Author information
These authors contributed equally: Chengxiang Chu, Zhenyang Shen, Hanyi Xu.
Authors and Affiliations
School of Management, Zhejiang University of Technology, Hangzhou, China
Chengxiang Chu, Zhenyang Shen, Qizhi Wei & Cong Cao
Law School, Zhejiang University of Technology, Hangzhou, China
You can also search for this author in PubMed Google Scholar
Contributions
Conceptualisation: C.C., CX.C. and ZY.S.; Methodology: CX.C. and HY.X.; Validation: ZY.S. and QZ.W.; Formal analysis: HY.X.; Investigation: CX.C., ZY.S. and HY.X.; Resources: C.C.; Data curation: CX.C. and HY.X.; Writing–original draft preparation: CX.C, ZY.S., HY.X. and QZ.W.; Writing–review & editing: CX.C and C.C.; Visualisation: ZY.S. and HY.X.; Supervision: C.C.; Funding acquisition: C.C., CX.C. and ZY.S.; all authors approved the final manuscript to be submitted.
Corresponding author
Correspondence to Cong Cao .
Ethics declarations
Ethical approval.
Ethical approval for the involvement of human subjects in this study was granted by Institutional Review Board of School of Management, Zhejiang University of Technology, China, Reference number CC-2023-1-0008-0005-SOM-ZJUT.
Informed consent
Informed consent was obtained from all individual participants included in the study.
Competing interests
The authors declare no competing interests.
Additional information
Publisher’s note Springer Nature remains neutral with regard to jurisdictional claims in published maps and institutional affiliations.
Appendix A. Measurement items
Factors | Items | Source |
|---|---|---|
Performance Expectancy | 1. Use of ‘accessibility infrastructure’ helps me to handle affairs quickly and efficiently. | Ali et al. ( ) |
2. ‘Accessibility infrastructure’ ensures the accessibility and availability of facilities for handling my affairs. | ||
3. ‘Accessibility infrastructure’ save time in handling my affairs. | ||
4. ‘Accessibility infrastructure’ saves effort in handling my affairs. | ||
Psychological Reactance | 1. The existence or sudden intervention of ‘accessibility infrastructure’ makes me feel angry. | Tian et al. ( ) |
2. The existence or sudden intervention of ‘accessibility infrastructure’ makes me feel irritated. | ||
3. I criticised its existence while using the ‘accessibility infrastructure’. | ||
4. When using the ‘accessibility infrastructure’, I preferred the original state. | ||
Perceived Institutional Support | 1. My country helps me use the ‘accessibility infrastructure’. | Almaiah et al. ( ); Garone et al. ( ) |
2. Public institutions that are important to me think that I should use the ‘accessibility infrastructure’. | ||
3. I believe that my country supports the use of the ‘accessibility infrastructure’. | ||
Perceived Marketplace Influence | 1. I believe that many people in my country use the ‘accessibility infrastructure’. | Almaiah et al. ( ); Garone et al. ( ) |
2. I believe that many people in my country desire to use the ‘accessibility infrastructure’. | ||
3. I believe that many people in my country approve of using the ‘accessibility infrastructure’. | ||
Effort Expectancy | 1. My interactions with the ‘accessibility infrastructure’ are clear and understandable. | Venkatesh et al. ( ) |
2. It is easy for me to become skilful in using the ‘accessibility infrastructure’. | ||
3. Learning to operate the ‘accessibility infrastructure’ is easy for me. | ||
Facilitating Conditions | 1. I have the resources necessary to use the ‘accessibility infrastructure’. | Venkatesh et al. ( ) |
2. I have the knowledge necessary to use the ‘accessibility infrastructure’. | ||
3. The ‘accessibility infrastructure’ is not compatible with other infrastructure I use. | ||
4. A specific person (or group) is available to assist me with ‘accessibility infrastructure’ difficulties. | ||
Social Interaction Anxiety | 1. I feel tense if talk about myself or my feelings. | Fergus et al. ( ) |
2. I tense up if meet an acquaintance in the street. | ||
3. I feel tense if I am alone with one other person. | ||
4. I feel nervous mixing with people I don’t know well. | ||
5. I worry about being ignored when in a group. | ||
6. I feel tense mixing in a group. | ||
Intention to Use | 1. If I had access to the ‘accessibility infrastructure’, I would intend to use it. | Teo et al. ( ) |
2. If I had access to the ‘accessibility infrastructure’ in the coming months, I believe that I would use it rather than taking other measures. | ||
3. I expect that I will use the ‘accessibility infrastructure’ in my daily life in the future. | ||
4. I plan to use the ‘accessibility infrastructure’ in my daily life in the future. |
Rights and permissions
Open Access This article is licensed under a Creative Commons Attribution 4.0 International License, which permits use, sharing, adaptation, distribution and reproduction in any medium or format, as long as you give appropriate credit to the original author(s) and the source, provide a link to the Creative Commons licence, and indicate if changes were made. The images or other third party material in this article are included in the article’s Creative Commons licence, unless indicated otherwise in a credit line to the material. If material is not included in the article’s Creative Commons licence and your intended use is not permitted by statutory regulation or exceeds the permitted use, you will need to obtain permission directly from the copyright holder. To view a copy of this licence, visit http://creativecommons.org/licenses/by/4.0/ .
Reprints and permissions
About this article
Cite this article.
Chu, C., Shen, Z., Xu, H. et al. How to avoid sinking in swamp: exploring the intentions of digitally disadvantaged groups to use a new public infrastructure that combines physical and virtual spaces. Humanit Soc Sci Commun 11 , 1135 (2024). https://doi.org/10.1057/s41599-024-03684-0
Download citation
Received : 28 October 2023
Accepted : 29 August 2024
Published : 04 September 2024
DOI : https://doi.org/10.1057/s41599-024-03684-0
Share this article
Anyone you share the following link with will be able to read this content:
Sorry, a shareable link is not currently available for this article.
Provided by the Springer Nature SharedIt content-sharing initiative
Quick links
- Explore articles by subject
- Guide to authors
- Editorial policies

A study of the effect of viewing online health popular science information on users' willingness to change health behaviors – based on the psychological distance perspective
- Published: 05 September 2024
Cite this article

- Jingfang Liu 1 &
- Shiqi Wang 1
Along with increased health awareness and the advent of the information age, online health popular science information (OHPSI) has received more attention. However, it is unknown how the lots of online health information influences users to change unhealthy behavioral habits. Therefore, based on the psychological distance perspective, our research investigated the effect of viewing online health information on users' willingness to change their health behaviors in the future. In addition, this study also introduced the protection motivation theory to further investigate the mediating effect of protection motivation in the mechanisms of psychological distance in online health information. The data of the study were obtained by the research method of questionnaire survey and the proposed hypotheses were validated using Smartpls software. 87.28% of the respondents in this study's survey sample were aged 18–40 years old, and people in this age group have higher pressure from study and work, and live a fast-paced life with less free time, which makes them more likely to pay attention to OHPSI to improve their health. Therefore, the age group of the sample of this study is in line with the research purpose of this paper, which is conducive to enhancing the authenticity and reliability of the conclusions of this study. The conclusions of the study showed that the temporal, social, hypothetical and experiential distances in psychological distance can positively influence users' self-protection motivation. And protection motivation has a positive effect on users' willingness to change health behaviors. In addition, protection motivation can completely mediate the influence of psychological distance on users' willingness to change health behaviors after viewing online health information. The research not only expands the scope of application of construal level theory and protection motivation theory, but also has significant impact for creators of OHPSI and public health departments.
This is a preview of subscription content, log in via an institution to check access.
Access this article
Subscribe and save.
- Get 10 units per month
- Download Article/Chapter or eBook
- 1 Unit = 1 Article or 1 Chapter
- Cancel anytime
Price includes VAT (Russian Federation)
Instant access to the full article PDF.
Rent this article via DeepDyve
Institutional subscriptions
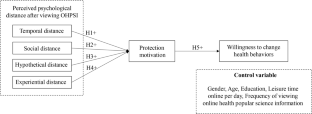
Explore related subjects
- Artificial Intelligence
Data availability
Data sharing not applicable to this article as privacy and ethical restrictions.
Abbreviations
- Online health popular science information
- Construal level theory
Protection motivation theory
Temporal distance
Social distance
Hypothetical distance
Experiential distance
- Protection motivation
Willingness to change health behaviors
Partial least squares
Composite reliability
Average variance extracted
Akhtar, N., Siddiqi, U. I., & Islam, T. (2023). Do perceived threats to psychological distance influence tourists' reactance and online Airbnb booking intentions during COVID-19? Kybernetes . https://doi.org/10.1108/k-03-2023-0508
Bar-Anan, Y., Liberman, N., & Trope, Y. (2006). The association between psychological distance and construal level: Evidence from an implicit association test. Journal of Experimental Psychology: General, 135 (4), 609–622. https://doi.org/10.1037/0096-3445.135.4.609
Article PubMed Google Scholar
Blauza, S., Heuckmann, B., Kremer, K., & Buessing, A. G. (2023). Psychological distance towards COVID-19: Geographical and hypothetical distance predict attitudes and mediate knowledge [Article]. Current Psychology, 42 (10), 8632–8643. https://doi.org/10.1007/s12144-021-02415-x
Boss, S. R., Galletta, D. F., Lowry, P. B., Moody, G. D., & Polak, P. (2015a). What do systems users have to fear? Using fear appeals to engender threats and fear that motivate protective security behaviors. MIS Quarterly, 39 (4), 837–864.
Article Google Scholar
Boss, S. R., Galletta, D. F., Lowry, P. B., Moody, G. D., & Polak, P. (2015b). What do systems users have to fear? Using fear appeals to engender threats and fear that motivate protective security behaviors. MIS Quarterly, 39 (4), 837-U461. https://doi.org/10.25300/misq/2015/39.4.5
Brust, M., Gebhardt, W. A., van der Voorde, N. A. E., Numans, M. E., & Kiefte-de Jong, J. C. (2022). The development and validation of scales to measure the presence of a teachable moment following a cardiovascular disease event. Preventive Medicine Reports, 28 , 101876. https://doi.org/10.1016/j.pmedr.2022.101876
Article PubMed PubMed Central Google Scholar
Bujnowska-Fedak, M. M., & Wegierek, P. (2020). The impact of online health information on patient health behaviours and making decisions concerning health. International Journal of Environmental Research and Public Health, 17 (3), 880. https://doi.org/10.3390/ijerph17030880
Chen, F., Dai, S., Zhu, Y., & Xu, H. (2019). Will concerns for ski tourism promote pro-environmental behaviour? An implication of protection motivation theory. International Journal of Tourism Research, 22 (3), 303–313. https://doi.org/10.1002/jtr.2336
Chen, X. (2023). Online health communities influence people's health behaviors in the context of COVID-19. Plos One, 18 (4). https://doi.org/10.1371/journal.pone.0282368
Choi, J., Nelson, D., & Almanza, B. (2018). Food safety risk for restaurant management: Use of restaurant health inspection report to predict consumers’ behavioral intention. Journal of Risk Research, 22 (11), 1443–1457. https://doi.org/10.1080/13669877.2018.1501590
Diviani, N., van den Putte, B., Giani, S., & van Weert, J. C. M. (2015). Low health literacy and evaluation of online health information: A systematic review of the literature. Journal of Medical Internet Research, 17 (5), e112. https://doi.org/10.2196/jmir.4018
Dong, W., Lei, X., & Liu, Y. (2022). The mediating role of patients’ trust between web-based health information seeking and patients’ uncertainty in China: Cross-sectional web-based survey. Journal of Medical Internet Research, 24 (3), e25275. https://doi.org/10.2196/25275
Farooq, A., Laato, S., Islam, A., & Isoaho, J. (2021). Understanding the impact of information sources on COVID-19 related preventive measures in Finland. Technology in Society, 65 , 101573. https://doi.org/10.1016/j.techsoc.2021.101573
Fiedler, K. (2007). Construal level theory as an integrative framework for behavioral decision-making research and consumer psychology. Journal of Consumer Psychology, 17 (2), 101–106. https://doi.org/10.1016/s1057-7408(07)70015-3
Fornell, C., & Larcker, D. F. (1981). Evaluating structural equation models with unobservable variables and measurement error. Journal of Marketing Research, 18 (1), 39–50.
Gefen, D., & Straub, D. (2005). A practical guide to factorial validity using PLS-Graph: Tutorial and annotated example. Communications of the Association for Information Systems, 16 (1), 5.
Google Scholar
Hair, J. F., Sarstedt, M., Ringle, C. M., & Mena, J. A. (2012). An assessment of the use of partial least squares structural equation modeling in marketing research. Journal of the Academy of Marketing Science, 40 (3), 414–433. https://doi.org/10.1007/s11747-011-0261-6
Hale, T. M. (2013). Is there such a thing as an online health lifestyle?: Examining the relationship between social status, Internet access, and health behaviors. Information Communication & Society, 16 (4), 501–518. https://doi.org/10.1080/1369118x.2013.777759
Han, D., Duhachek, A., & Agrawal, N. (2016). Coping and construal level matching drives health message effectiveness via response efficacy or self-efficacy enhancement. Journal of Consumer Research, 43 (3), 429–447.
Hodges, P. W., Hall, L., Setchell, J., French, S., Kasza, J., Bennell, K., Hunter, D., Vicenzino, B., Crofts, S., & Dickson, C. (2021). Effect of a consumer-focused website for low back pain on health literacy, treatment choices, and clinical outcomes: Randomized controlled trial. Journal of Medical Internet Research, 23 (6), e27860.
Jones, C., Hine, D. W., & Marks, A. D. (2017). The future is now: Reducing psychological distance to increase public engagement with climate change. Risk Analysis, 37 (2), 331–341. https://doi.org/10.1111/risa.12601
Kim, S., & Jin, Y. (2020). Organizational threat appraisal by publics: The effects of perceived temporal distance on health crisis outcomes. International Journal of Communication, 14 , 4075–4095. <Go to ISI>://WOS:000616658300105
Kim, D. H., & Song, D. (2019). Can brand experience shorten consumers’ psychological distance toward the brand? The effect of brand experience on consumers’ construallevel. Journal of Brand Management, 26 (3), 255–267. https://doi.org/10.1057/s41262-018-0134-0
Lahiri, A., Jha, S. S., Chakraborty, A., Dobe, M., & Dey, A. (2021). Role of threat and coping appraisal in protection motivation for adoption of preventive behavior during COVID-19 pandemic. Frontiers in Public Health, 9 , 678566. https://doi.org/10.3389/fpubh.2021.678566
Li, Y. F., Song, Y. Y., Zhao, W., Guo, X. T., Ju, X. F., & Vogel, D. (2019). Exploring the role of online health community information in patients’ decisions to switch from online to offline medical services. International Journal of Medical Informatics, 130 , 103951. https://doi.org/10.1016/j.ijmedinf.2019.08.011
Liberman, N., & Trope, Y. (1998). The role of feasibility and desirability considerations in near and distant future decisions: A test of temporal construal theory. Journal of Personality and Social Psychology, 75 (1), 5–18. https://doi.org/10.1037/0022-3514.75.1.5
Liu, F., Fang, M., Cai, L., Su, M., & Wang, X. (2021). Consumer motivations for adopting omnichannel retailing: A safety-driven perspective in the context of COVID-19. Frontiers in Public Health, 9 , 708199. https://doi.org/10.3389/fpubh.2021.708199
Mao, Y., Chen, H., Wang, Y., Chen, S., Gao, J., Dai, J., Jia, Y., Xiao, Q., Zheng, P., & Fu, H. (2021). How can the uptake of preventive behaviour during the COVID-19 outbreak be improved? An online survey of 4827 Chinese residents. BMJ Open, 11 (2), e042954. https://doi.org/10.1136/bmjopen-2020-042954
Massara, F., & Severino, F. (2013). Psychological distance in the heritage experience. Annals of Tourism Research, 42 , 108–129. https://doi.org/10.1016/j.annals.2013.01.005
Negrone, A. J., Caldwell, P. H., & Scott, K. M. (2023). COVID-19 and Dr. Google: Parents’ changing experience using online health information about their children’s health during the pandemic. Journal of Paediatrics and Child Health, 59 (3), 512–518. https://doi.org/10.1111/jpc.16339
Rogers, R. W. (1975). A protection motivation theory of fear appeals and attitude change1. The Journal of Psychology, 91 (1), 93–114.
Shanshan, S., Chenhui, D., & Lijuan, L. (2022). Metaphor and board writing matter: The mediating roles of psychological distance and immersion in video lectures [Article]. Computers & Education, 191 , 104630. https://doi.org/10.1016/j.compedu.2022.104630
Shin, M., Kim, Y., & Park, S. (2020). Effect of psychological distance on intention in self-affirmation theory. Psychological Reports, 123 (6), 2101–2124. https://doi.org/10.1177/0033294119856547
Soroya, S. H., Nazir, M., & Faiola, A. (2022). Impact of health-related internet use on disease management behavior of chronic patients: Mediating role of perceived credibility of online information. Information Development . https://doi.org/10.1177/02666669221144622
Sousa, P., Martinho, R., Reis, C. I., Dias, S. S., Gaspar, P. J. S., Dixe, M. D., Luis, L. S., & Ferreira, R. (2020). Controlled trial of an mHealth intervention to promote healthy behaviours in adolescence (TeenPower): Effectiveness analysis. Journal of Advanced Nursing, 76 (4), 1057–1068. https://doi.org/10.1111/jan.14301
Spence, A., Poortinga, W., & Pidgeon, N. (2012). The psychological distance of climate change. Risk Analysis, 32 (6), 957–972. https://doi.org/10.1111/j.1539-6924.2011.01695.x
Wang, S., Hurlstone, M. J., Leviston, Z., Walker, I., & Lawrence, C. (2019b). Climate change from a distance: An analysis of construal level and psychological distance from climate change. Frontiers in Psychology, 10 , 230. https://doi.org/10.3389/fpsyg.2019.00230
Wang, X., Duan, X., Li, S., & Bu, T. (2022). Effects of message framing, psychological distance, and risk perception on exercise attitude in Chinese adolescents. Frontiers in Pediatrics, 10 , 991419. https://doi.org/10.3389/fped.2022.991419
Wang, J., Liu-Lastres, B., Ritchie, B. W., & Mills, D. J. (2019a). Travellers' self-protections against health risks: An application of the full protection motivation theory. Annals of Tourism Research, 78 . https://doi.org/10.1016/j.annals.2019.102743
Weiss, K., & Konig, L. M. (2023). Does the medium matter? Comparing the effectiveness of videos, podcasts and online articles in nutrition communication. Applied Psychology-Health and Well Being, 15 (2), 669–685. https://doi.org/10.1111/aphw.12404
White, A. E., Johnson, K. A., & Kwan, V. S. Y. (2014). Four ways to infect me: Spatial, temporal, social, and probability distance influence evaluations of disease threat. Social Cognition, 32 (3), 239–255. https://doi.org/10.1521/soco.2014.32.3.239
Yan, J., Wei, J., Zhao, D., Vinnikova, A., Li, L., & Wang, S. (2018). Communicating online diet-nutrition information and influencing health behavioral intention: The role of risk perceptions, problem recognition, and situational motivation. Journal of Health Communication, 23 (7), 624–633. https://doi.org/10.1080/10810730.2018.1500657
Zhang, J., Xie, C., Lin, Z., & Huang, S. (2023). Effects of risk messages on tourists’ travel intention: Does distance matter? Journal of Hospitality and Tourism Management, 55 , 169–184. https://doi.org/10.1016/j.jhtm.2023.03.020
Zhao, S., Ye, B., Wang, W., & Zeng, Y. (2022). The intolerance of uncertainty and “untact” buying behavior: The mediating role of the perceived risk of COVID-19 variants and protection motivation. Frontiers in Psychology, 13 , 807331. https://doi.org/10.3389/fpsyg.2022.807331
Zhonglin, W., & Baojuan, Y. (2014). Analyses of mediating effects: The development of methods and models. Advances in Psychological Science, 22 (5), 731–745. https://doi.org/10.3724/sp.J.1042.2014.00731
Zhou, P., Zhao, Y., Xiao, S., & Zhao, K. (2022). The impact of online health community engagement on lifestyle changes: A serially mediated model. Frontiers in Public Health, 10 . https://doi.org/10.3389/fpubh.2022.987331
Zhou, J. J., & Fan, T. T. (2019). Understanding the factors influencing patient e-health literacy in Online Health Communities (OHCs): A social cognitive theory perspective. International Journal of Environmental Research and Public Health, 16 (14), 2455. https://doi.org/10.3390/ijerph16142455
Zhu, Z., Zhao, Y., & Wang, J. (2022). The impact of destination online review content characteristics on travel intention: Experiments based on psychological distance perspectives. Aslib Journal of Information Management . https://doi.org/10.1108/ajim-06-2022-0293
Zou, X., Chen, Q., Zhang, Y. Y., & Evans, R. (2023). Predicting COVID-19 vaccination intentions: The roles of threat appraisal, coping appraisal, subjective norms, and negative affect. BMC Public Health, 23 (1), 230. https://doi.org/10.1186/s12889-023-15169-x
Download references
This research received no external funding.
Author information
Authors and affiliations.
School of Management, Shanghai University, Shanghai, 201800, China
Jingfang Liu & Shiqi Wang
You can also search for this author in PubMed Google Scholar
Contributions
Conceptualization, J.L. and S.W.; methodology, J.L. and S.W.; software, S.W.; validation, S.W.; formal analysis and S.W.; investigation, S.W.; resources, S.W.; data curation, S.W.; writing—original draft preparation, S.W.; writing—review and editing, S.W.; visualization, S.W. All authors have read and agreed to the published version of the manuscript.
Corresponding author
Correspondence to Shiqi Wang .
Ethics declarations
Ethical approval.
This project received ethical approval from the Ethics Committee of Shanghai University, with ethics approval number ECSHU 2023–072.
Informed consent
Not applicable.
Conflicts of interest
On behalf of all authors, the corresponding author states that there is no conflict of interest.
Additional information
Publisher's note.
Springer Nature remains neutral with regard to jurisdictional claims in published maps and institutional affiliations.
Rights and permissions
Springer Nature or its licensor (e.g. a society or other partner) holds exclusive rights to this article under a publishing agreement with the author(s) or other rightsholder(s); author self-archiving of the accepted manuscript version of this article is solely governed by the terms of such publishing agreement and applicable law.
Reprints and permissions
About this article
Liu, J., Wang, S. A study of the effect of viewing online health popular science information on users' willingness to change health behaviors – based on the psychological distance perspective. Curr Psychol (2024). https://doi.org/10.1007/s12144-024-06582-5
Download citation
Accepted : 15 August 2024
Published : 05 September 2024
DOI : https://doi.org/10.1007/s12144-024-06582-5
Share this article
Anyone you share the following link with will be able to read this content:
Sorry, a shareable link is not currently available for this article.
Provided by the Springer Nature SharedIt content-sharing initiative
- Willingness to change health behavior
- Psychological distance
- Find a journal
- Publish with us
- Track your research
Want to create or adapt books like this? Learn more about how Pressbooks supports open publishing practices.
12.4 Bias and cultural considerations
Learning objectives.
Learners will be able to…
- Identify the logic behind survey design as it relates to nomothetic causal explanations and quantitative methods
- Discuss sources of bias and error in surveys
- Apply criticisms of survey design to ensure more equitable research
The logic of survey design
It’s helpful to spell out the underlying logic behind survey design and how well it meets the criteria for nomothetic causal explanations. Because we are trying to isolate the association between our dependent and independent variable, we must try to control for as many possible confounding factors as possible. Researchers using survey design do this in multiple ways:
- Using well-established, valid, and reliable measures of key variables, including triangulating variables using multiple measures
- Measuring control variables and including them in their statistical analysis
- Avoiding biased wording, presentation, or procedures that might influence the sample to respond differently
- Pilot testing questionnaires, preferably with people similar to the sample
In other words, survey researchers go through a lot of trouble to make sure they are not the ones causing the changes they observe in their study. Of course, every study falls a little short of this ideal bias-free design, and some studies fall far short of it. This section is all about how bias and error can inhibit the ability of survey results to meaningfully tell us about causal relationships in the real world.
Bias in questionnaires, questions, and response options
[ SOME OF THE FOLLOWING CONTENT MAY BELONG IN THE MEASUREMENT CHAPTER, FIGURE OUT HOW BEST TO ORGANIZE SO THAT MEASUREMENT CONCERNS ARE IN THAT CHAPTER WHILE CONCERNS RELATED SPECIFIC TO SURVEY DESIGN ARE IN THIS CHAPTER; I’M THINKING THERE COULD BE A BRIEF “RECALL THE TYPES OF MEASUREMENT BIAS/ERROR WE DISCUSSED IN CHAPTER xx AND THEN MOVE ON TO THE OTHER BIASES ]
The use of surveys is based on methodological assumptions common to research in the postpositivist paradigm. Figure 12.1 presents a model the methodological assumptions behind survey design—what researchers assume is the cognitive processes that people engage in when responding to a survey item (Sudman, Bradburn, & Schwarz, 1996) . [1] Respondents must interpret the question, retrieve relevant information from memory, form a tentative judgment, convert the tentative judgment into one of the response options provided (e.g., a rating on a 1-to-7 scale), and finally edit their response as necessary.
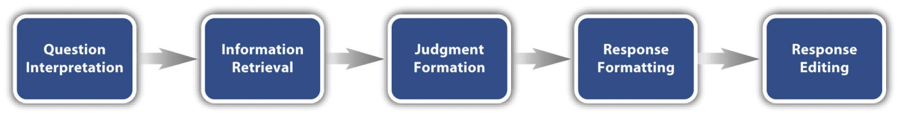
Consider, for example, the following questionnaire item:
- How many alcoholic drinks do you consume in a typical day?
- a lot more than average
- somewhat more than average
- somewhat less than average
- much less than average
Although this item at first seems straightforward, it poses several difficulties for respondents. First, they must interpret the question. For example, they must decide whether “alcoholic drinks” include beer and wine (as opposed to just hard liquor) and whether a “typical day” is a typical weekday, typical weekend day, or both . Even though Chang and Krosnick (2003) [2] found that asking about “typical” behavior has been shown to be more valid than asking about “past” behavior, their study compared “typical week” to “past week” and may be different when considering typical weekdays or weekend days) .
Once respondents have interpreted the question, they must retrieve relevant information from memory to answer it. But what information should they retrieve, and how should they go about retrieving it? They might think vaguely about some recent occasions on which they drank alcohol, they might carefully try to recall and count the number of alcoholic drinks they consumed last week, or they might retrieve some existing beliefs that they have about themselves (e.g., “I am not much of a drinker”). Then they must use this information to arrive at a tentative judgment about how many alcoholic drinks they consume in a typical day. For example, this mental calculation might mean dividing the number of alcoholic drinks they consumed last week by seven to come up with an average number per day. Then they must format this tentative answer in terms of the response options actually provided. In this case, the options pose additional problems of interpretation. For example, what does “average” mean, and what would count as “somewhat more” than average? Finally, they must decide whether they want to report the response they have come up with or whether they want to edit it in some way. For example, if they believe that they drink a lot more than average, they might not want to report that for fear of looking bad in the eyes of the researcher, so instead, they may opt to select the “somewhat more than average” response option.
At first glance, this question is clearly worded and includes a set of mutually exclusive, exhaustive, and balanced response options. However, it is difficult to follow the logic of what is truly being asked. Again, this complexity can lead to unintended influences on respondents’ answers. Confounds like this are often referred to as context effects because they are not related to the content of the item but to the context in which the item appears (Schwarz & Strack, 1990) . [3] For example, there is an item-order effect when the order in which the items are presented affects people’s responses. One item can change how participants interpret a later item or change the information that they retrieve to respond to later items. For example, researcher Fritz Strack and his colleagues asked college students about both their general life satisfaction and their dating frequency (Strack, Martin, & Schwarz, 1988) . [4] When the life satisfaction item came first, the correlation between the two was only −.12, suggesting that the two variables are only weakly related. But when the dating frequency item came first, the correlation between the two was +.66, suggesting that those who date more have a strong tendency to be more satisfied with their lives. Reporting the dating frequency first made that information more accessible in memory so that they were more likely to base their life satisfaction rating on it.
The response options provided can also have unintended effects on people’s responses (Schwarz, 1999) . [5] For example, when people are asked how often they are “really irritated” and given response options ranging from “less than once a year” to “more than once a month,” they tend to think of major irritations and report being irritated infrequently. But when they are given response options ranging from “less than once a day” to “several times a month,” they tend to think of minor irritations and report being irritated frequently. People also tend to assume that middle response options represent what is normal or typical. So if they think of themselves as normal or typical, they tend to choose middle response options (i.e., fence-sitting). For example, people are likely to report watching more television when the response options are centered on a middle option of 4 hours than when centered on a middle option of 2 hours. To mitigate against order effects, rotate questions and response items when there is no natural order. Counterbalancing or randomizing the order of presentation of the questions in online surveys are good practices for survey questions and can reduce response order effects that show that among undecided voters, the first candidate listed in a ballot receives a 2.5% boost simply by virtue of being listed first! [6]
Other context effects that can confound the causal relationship under examination in a survey include social desirability bias, recall bias, and common method bias. As we discussed in Chapter 10, social desirability bias occurs when we create questions that lead respondents to answer in ways that don’t reflect their genuine thoughts or feelings to avoid being perceived negatively. With negative questions such as, “do you think that your project team is dysfunctional?”, “is there a lot of office politics in your workplace?”, or “have you ever illegally downloaded music files from the Internet?”, the researcher may not get truthful responses. This tendency among respondents to “spin the truth” in order to portray themselves in a socially desirable manner is called social desirability bias, which hurts the validity of responses obtained from survey research. There is practically no way of overcoming social desirability bias in a questionnaire survey outside of wording questions using nonjudgmental language. However, in a quantitative interview, a researcher may be able to spot inconsistent answers and ask probing questions or use personal observations to supplement respondents’ comments.
As you can see, participants’ responses to survey questions often depend on their motivation, memory, and ability to respond. Particularly when dealing with events that happened in the distant past, respondents may not adequately remember their own motivations or behaviors, or perhaps their memory of such events may have evolved with time and are no longer retrievable. This phenomenon is know as recall bias . For instance, if a respondent is asked to describe their utilization of computer technology one year ago, their response may not be accurate due to difficulties with recall. One possible way of overcoming the recall bias is by anchoring the respondent’s memory in specific events as they happened, rather than asking them to recall their perceptions and motivations from memory.

Response Rate
The percentage or proportion of members of a sample who respond to a questionnaire is the response rate. Response rates have been declining for a long time. It’s rare that 100% of your sampled population will reply to your questionnaire. There are multiple factors that impact respondents’ ability to respond. Respondents could be busy with competing priorities, they have recently heard of scams that are happening in the area, have received too many robocalls and/or they may think that their confidentiality is not protected. With these known concerns, a researcher should tailor their recruitment measures to fit their desired population to increase the likelihood of getting responses. A researcher usually has a desired or anticipated response rate to run their desired statistical analysis. It is recommended to start with a large sample size because the response rate may be low.
The lower the response rate, the lower the likelihood that the sample is representative of the overall population; however, it is not impossible. A random sample taken from your randomly selected sample should still produce a randomized data report (National Social Norms Center, 2014) [7] [8] . Just because there is a small response rate doesn’t mean its not representative. A researcher can investigate this by locating a known fact about their population (i.e., race or gender) and compare to their sample to assess if there is a “reasonably close match”. Reasonable is defined as what the researcher is comfortable with to move forward with their study.
A few examples of low response rates that still yielded a representative sample to the greater population are as follows:
One early example of a finding was reported by Visser, Krosnick, Marquette and Curtin (2000) [9] who showed that surveys with lower response rates (near 20%) yielded more accurate measurements than did surveys with higher response rates (near 60 or 70%). In another study, Keeter et al. (2006) [10] compared results of a 5-day survey employing the Pew Research Center’s usual methodology (with a 25% response rate) with results from a more rigorous survey conducted over a much longer field period and achieving a higher response rate of 50%. In 77 out of 84 comparisons, the two surveys yielded results that were statistically indistinguishable. Among the items that manifested significant differences across the two surveys, the differences in proportions of people giving a particular answer ranged from 4 percentage points to 8 percentage points.
A study by Curtin et al. (2000) [11] tested the effect of lower response rates on estimates of the Index of Consumer Sentiment (ICS). They assessed the impact of excluding respondents who initially refused to cooperate (which reduces the response rate 5–10 percentage points), respondents who required more than five calls to complete the interview (reducing the response rate about 25 percentage points), and those who required more than two calls (a reduction of about 50 percentage points). They found no effect of excluding these respondent groups on estimates of the ICS using monthly samples of hundreds of respondents. For yearly estimates, based on thousands of respondents, the exclusion of people who required more calls (though not of initial refusers) had a very small one.
Holbrook et al. (2005) [12] assessed whether lower response rates are associated with less unweighted demographic representativeness of a sample. By examining the results of 81 national surveys with response rates varying from 5 percent to 54 percent, they found that surveys with much lower response rates decreased demographic representativeness within the range examined, but not by much.
Though there is not a clear answer on what constitutes a good response rate, a researcher may want to consider the following when accepting the results and how this may impact their field of practice.
- Are these results believable? We all know how influential perceptions are. Will your audience believe that your survey data truly represents them?
- Have I considered the subgroups of my population? A researcher may have to plan on smaller scale surveys specifically for those groups, if they want to track changes in perception, use, and negative outcomes for those high-risk groups.
- Bias: the lower the response rate, the more chance that the respondent group is biased in some way. It can make longitudinal differences particularly difficult to interpret: If there is a change from the previous survey years, is that a real change or due to some bias in the response group (particularly if the respondents are not representative in terms of exposure to the intervention or risk).
- Do I have a demographic representativeness? Even with a high response rate, it is important for a researcher to still consider if there was a response from specific groups within their responses (i.e., race, gender, age)?
Bias in recruitment and response to surveys
So far, we have discussed errors that researchers make when they design questionnaires that accidentally influence participants to respond one way or another. However, even well designed questionnaires can produce biased results when administered to survey respondents because of the biases in who actually responds to your survey.
Survey research is notorious for its low response rates. A response rate of 15-20% is typical in a mail survey, even after two or three reminders. If the majority of the targeted respondents fail to respond to a survey, then a legitimate concern is whether non-respondents are not responding due to a systematic reason, which may raise questions about the validity and generalizability of the study’s results, especially as this relates to the representativeness of the sample. This is known as non-response bias . For instance, dissatisfied customers tend to be more vocal about their experience than satisfied customers, and are therefore more likely to respond to satisfaction questionnaires. Hence, any respondent sample is likely to have a higher proportion of dissatisfied customers than the underlying population from which it is drawn. [13] In this instance, the results would not be generalizable beyond this one biased sample. Here are several strategies for addressing non-response bias:
- Advance notification: A short letter sent in advance to the targeted respondents soliciting their participation in an upcoming survey can prepare them and improve likelihood of response. The letter should state the purpose and importance of the study, mode of data collection (e.g., via a phone call, a survey form in the mail, etc.), and appreciation for their cooperation. A variation of this technique may request the respondent to return a postage-paid postcard indicating whether or not they are willing to participate in the study.
- Ensuring that content is relevant: If a survey examines issues of relevance or importance to respondents, then they are more likely to respond.
- Creating a respondent-friendly questionnaire: Shorter survey questionnaires tend to elicit higher response rates than longer questionnaires. Furthermore, questions that are clear, inoffensive, and easy to respond to tend to get higher response rates.
- Having the project endorsed: For organizational surveys, it helps to gain endorsement from a senior executive attesting to the importance of the study to the organization. Such endorsements can be in the form of a cover letter or a letter of introduction, which can improve the researcher’s credibility in the eyes of the respondents.
- Providing follow-up requests: Multiple follow-up requests may coax some non-respondents to respond, even if their responses are late.
- Ensuring that interviewers are properly trained: Response rates for interviews can be improved with skilled interviewers trained on how to request interviews, use computerized dialing techniques to identify potential respondents, and schedule callbacks for respondents who could not be reached.
- Providing incentives: Response rates, at least with certain populations, may increase with the use of incentives in the form of cash or gift cards, giveaways such as pens or stress balls, entry into a lottery, draw or contest, discount coupons, the promise of contribution to charity, and so forth.
- Providing non-monetary incentives: Organizations in particular are more prone to respond to non-monetary incentives than financial incentives. An example of a non-monetary incentive can include sharing trainings and other resources based on the results of a project with a key stakeholder.
- Making participants fully aware of confidentiality and privacy: Finally, assurances that respondents’ private data or responses will not fall into the hands of any third party may help improve response rates.
Nonresponse bias impairs the ability of the researcher to generalize from the total number of respondents in the sample to the overall sampling frame. Of course, this assumes that the sampling frame is itself representative and generalizable to the larger target population. Sampling bias is present when the people in our sampling frame or the approach we use to sample them results in a sample that does not represent our population in some way. Telephone surveys conducted by calling a random sample of publicly available telephone numbers will systematically exclude people with unlisted telephone numbers, mobile phone numbers, and will include a disproportionate number of respondents who have land-line telephone service and stay home during much of the day, such as people who are unemployed, disabled, or of advanced age. Likewise, online surveys tend to include a disproportionate number of students and younger people who are more digitally connected, and systematically exclude people with limited or no access to computers or the Internet, such as the poor and the elderly. A different kind of sampling bias relates to generalizing from key informants to a target population, such as asking teachers (or parents) about the academic learning of their students (or children) or asking CEOs about operational details in their company. These sampling frames may provide a clearer picture of what key informants think and feel, rather than the target population.

Common Method Bias
Cross-sectional and retrospective surveys are particularly vulnerable to recall bias as well as common method bias. Common method bias can occur when measuring both the independent and dependent variables at the same time from the same person using the same instrument. For example, the fact that subjects are asked to report their own perceptions or impressions on two or more constructs in the same survey is likely to produce spurious correlations among the items measuring these constructs owing to response styles, social desirability, priming effects which are independent from the true correlations among the constructs being measured. In such cases, the phenomenon under investigation may not be adequately separated from measurement artifacts. Statistical tests such as Harmon’s single-factor test or Lindell and Whitney’s (2001) [14] market variable technique are available to test for common method bias (Podsakoff et al. 2003), [15] ,
Common method bias can be potentially avoided if the independent and dependent variables are measured at different points in time, using a longitudinal survey design, or if these variables are measured using different data sources, such as medical or student records rather than self-report questionnaires. Phillip Podsakoff et al. (2003) [16] made the following recommendations:
- Separate the independent and dependent variables temporarily by creating a short time lag between the measurements.
- Create an interesting study to separate the IV and DV psychologically such that the respondents may not perceive the measurement of the IV to be related or connected to the DV.
- Proximal technology is when a researcher separates the measure under which respondents complete the measurement of the IV and DV. For example, in a survey question, the researcher can use a Likert scale for the IV and a semantic differential for the DV. The goal is to reduce measure association.
- Measurement of the IV and DV can be obtained from different sources.
Cultural bias ( provide a definition: a prejudice or difference in viewpoint which favors one culture over another. )
The acknowledgement that most research in social work and other adjacent fields is overwhelmingly based on so-called WEIRD (Western, educated, industrialized, rich and democratic) populations—a topic we discussed in Chapter 10 —has given way to intensified research funding, publication, and visibility of collaborative cross-cultural studies across the social sciences that expand the geographical range of study populations. Many of the so-called non-WEIRD communities who increasingly participate in research are Indigenous, from low- and middle-income countries in the global South, live in post-colonial contexts, and/or are marginalized within their political systems, revealing and reproducing power differentials between researchers and researched (Whiteford & Trotter, 2008). [17] Cross-cultural research has historically been rooted in racist, capitalist ideas and motivations (Gordon, 1991). [18] Scholars have long debated whether research aiming to standardize cross-cultural measurements and analysis is tacitly engaged and/or continues to be rooted in colonial and imperialist practices (Kline et al., 2018; Stearman, 1984). [19] Given this history, it is critical that scientists reflect upon these issues and be accountable to their participants and colleagues for their research practices. We argue that cross-cultural research be grounded in the recognition of the historical, political, sociological and cultural forces acting on the communities and individuals of focus. These perspectives are often contrasted with ‘science’; here we argue that they are necessary as a foundation for the study of human behavior.
We stress that our goal is not to review the literature on colonial or neo-colonial research practices, to provide a comprehensive primer on decolonizing approaches to field research, nor to identify or admonish past harms in these respects—harms to which many of the authors of this piece would readily admit. Furthermore, we acknowledge that we ourselves are writing from a place of privilege as researchers educated and trained in disciplines with colonial pasts and presents. Our goal is simply to help students understand the broader issues in cross-cultural studies for appropriate consideration of diverse communities and culturally appropriate methodologies for research projects.
Equivalence of measures across cultures
Data collection methods largely stemming from WEIRD intellectual traditions are being exported to a range of cultural contexts. This is often done with insufficient consideration of the translatability (e.g. equivalence or applicability) or implementation of such concepts and methods in different contexts, as already well documented (e.g., Hruschka et al., 2018). [20] For example, in a developmental psychology study conducted by Broesch and colleagues (2011), [21] the research team exported a task to examine the development and variability of self-recognition in children across cultures. Typically, this milestone is measured by surreptitiously placing a mark on a child’s forehead and allowing them to discover their reflective image and the mark in a mirror. While self-recognition in WEIRD contexts typically manifests in children by 18 months of age, the authors tested found that only 2 out of 82 children (aged 1–6 years) ‘passed’ the test by removing the mark using the reflected image. The authors’ interpretation of these results was that the test produced false negatives and instead measured implicit compliance to the local authority figure who placed the mark on the child. This raises the possibility that the mirror test may lack construct validity in cross-cultural contexts—in other words, that it may not measure the theoretical construct it was designed to measure.
As we discussed previously, survey researchers want to make sure everyone receives the same questionnaire, but how can we be sure everyone understands the questionnaire in the same way? Cultural equivalence means that a measure produces comparable data when employed in different cultural populations (Van de Vijver & Poortinga, 1992). [22] If concepts differ in meaning across cultures, cultural bias may better explain what is going on with your key variables better than your hypotheses. Cultural bias may result because of poor item translation, inappropriate content of items, and unstandardized procedures (Waltz et al., 2010). [23] Of particular importance is construct bias , or “when the construct measured is not identical across cultures or when behaviors that characterize the construct are not identical across cultures” (Meiring et al., 2005, p. 2) [24] Construct bias emerges when there is: a) disagreement about the appropriateness of content, b) inadequate sampling, c) underrepresentation of the construct, and d) incomplete overlap of the construct across cultures (Van de Vijver & Poortinga, 1992). [25]

Addressing cultural bias
To address these issues, we propose careful scrutiny of (a) study site selection, (b) community involvement and (c) culturally appropriate research methods. Particularly for those initiating collaborative cross-cultural projects, we focus here on pragmatic and implementable steps. It is important for researchers to be aware of these issues and assess for them in the strengths and limitations of your own study, though the degree to which you can feasibly implement some of these measures will be impaired by a lack of resources.
Study site selection
Researchers are increasingly interested in cross-cultural research applicable outside of WEIRD contexts., but this has sometimes led to an uncritical and haphazard inclusion of ‘non-WEIRD’ populations in cross-cultural research without further regard for why specific populations should be included (Barrett, 2020). [26] One particularly egregious example is the grouping of all non-Western populations as a comparative sample to the cultural West (i.e. the ‘West versus rest’ approach) is often unwittingly adopted by researchers performing cross-cultural research (Henrich, 2010). [27] Other researcher errors include the exoticization of particular cultures or viewing non-Western cultures as a window into the past rather than cultures that have co-evolved over time.
Thus, some of the cultural biases in survey research emerge when researchers fail to identify a clear theoretical justification for inclusion of any subpopulation—WEIRD or not—based on knowledge of the relevant cultural and/or environmental context (see Tucker, 2017 [28] for a good example). For example, a researcher asking about satisfaction with daycare must acquire the relevant cultural and environmental knowledge about a daycare that caters exclusively to Orthodox Jewish families. Simply including this study site without doing appropriate background research and identifying a specific aspect of this cultural group that is of theoretical interest in your study (e.g., spirituality and parenthood) indicates a lack of rigor in research. It undercuts the validity and generalizability of your findings by introducing sources of cultural bias that are unexamined in your study.
Sampling decisions are also important as they involve unique ethical and social challenges. For example, foreign researchers (as sources of power, information and resources) represent both opportunities for and threats to community members. These relationships are often complicated by power differentials due to unequal access to wealth, education and historical legacies of colonization. As such, it is important that investigators are alert to the possible bias among individuals who initially interact with researchers, to the potential negative consequences for those excluded, and to the (often unspoken) power dynamics between the researcher and their study participants (as well as among and between study participants).
We suggest that a necessary first step is to carefully consult existing resources outlining best practices for ethical principles of research before engaging in cross-cultural research. Many of these resources have been developed over years of dialogue in various academic and professional societies (e.g. American Anthropological Association, International Association for Cross Cultural Psychology, International Union of Psychological Science). Furthermore, communities themselves are developing and launching research-based codes of ethics and providing carefully curated open-access materials such as those from the Indigenous Peoples’ Health Research Centre , often written in consultation with ethicists in low- to middle-income countries (see Schroeder et al., 2019 ). [29]
Community involvement
Too often researchers engage in ‘extractive’ research, whereby a researcher selects a study community and collects the necessary data to exclusively further their own scientific and/or professional goals without benefiting the community. This reflects a long history of colonialism in social science. Extractive methods lead to methodological flaws and alienate participants from the scientific process, poisoning the well of scientific knowledge on a macro level. Many researchers are associated with institutions tainted with colonial, racist and sexist histories, sentiments and in some instances perpetuating into the present. Much cross-cultural research is carried out in former or contemporary colonies, and in the colonial language. Explicit and implicit power differentials create ethical challenges that can be acknowledged by researchers and in the design of their study (see Schuller, 2010 [30] for an example in which the power and politics of various roles played by researchers).
An understanding of cultural norms may ensure that data collection and questionnaire design are culturally and linguistically relevant. This can be achieved by implementing several complementary strategies. A first step may be to collaborate with members of the study community to check the relevance of the instruments being used. Incorporating perspectives from the study community from the outset can reduce the likelihood of making scientific errors in measurement and inference (First Nations Information Governance Centre, 2014). [31]
An additional approach is to use mixed methods in data collection, such that each method ‘checks’ the data collected using the other methods. A recent paper by Fisher and Poortinga (2018) [32] provides suggestions for a rigorous methodological approach to conducting cross-cultural comparative psychology, underscoring the importance of using multiple methods with an eye towards a convergence of evidence. A mixed-method approach can incorporate a variety of qualitative methods over and on top of a quantitative survey including open-ended questions, focus groups, and interviews.
Research design and methods
It is critical that researchers translate the language, technological references and stimuli as well as examine the underlying cultural context of the original method for assumptions that rely upon WEIRD epistemologies (Hrushcka, 2020). [33] This extends to non-complex visual aids, attempting to ensure that even scales measure what the researcher is intending (see Purzycki and Lang, 2019 [34] for discussion on the use of a popular economic experiment in small-scale societies).
For more information on assessing cultural equivalence, consult this free training from RTI International, a well-regarded non-profit research firm, entitled “ The essential role of language in survey design ” and this free training from the Center for Capacity Building in Survey Methods and Statistics entitled “ Questionnaire design: For surveys in 3MC (multinational, multiregional, and multi cultural) contexts . These trainings guide researchers using survey design through the details of evaluating and writing survey questions using culturally sensitive language. Moreover, if you are planning to conduct cross-cultural research, you should consult this guide for assessing measurement equivalency and bias across cultures , as well.
Key Takeaways
- Bias can come from both how questionnaire items are presented to participants as well as how participants are recruited and respond to surveys.
- Cultural bias emerges from the differences in how people think and behave across cultures.
- Cross-cultural research requires a theoretically-informed sampling approach, evaluating measurement equivalency across cultures, and generalizing findings with caution.
Post-awareness check (Emotion)
How have the contents of this chapter impacted your level of motivation to continue to research your target population? Should you make any adjustments to your research question or study design?
TRACK 1 (IF YOU ARE CREATING A RESEARCH PROPOSAL FOR THIS CLASS):
Review your questionnaire and assess it for potential sources of bias.
- Make any changes to your questionnaire (or sampling approach) you think would reduce the potential for bias in your study.
Create a first draft of your limitations section by identifying sources of bias in your survey.
- Write a bulleted list or paragraph or the potential sources of bias in your study.
- Remember that all studies, especially student-led studies, have limitations. To the extent you can address these limitations now and feasibly make changes, do so. But keep in mind that your goal should be more to correctly describe the bias in your study than to collect bias-free results. Ultimately, your study needs to get done!
TRACK 2 (IF YOU AREN’T CREATING A RESEARCH PROPOSAL FOR THIS CLASS):
You are interested in understanding more about the needs of unhoused individuals in rural communities, including how these needs vary based on demographic characteristics and personal identities.
- What types of bias might you encounter when attempting to answer your working research question using a cross-sectional survey design?
- What strategies might you employ to reduce the impact of these biases?
- Sudman, S., Bradburn, N. M., & Schwarz, N. (1996). Thinking about answers: The application of cognitive processes to survey methodology . San Francisco, CA: Jossey-Bass. ↵
- Chang, L., & Krosnick, J.A. (2003). Measuring the frequency of regular behaviors: Comparing the ‘typical week’ to the ‘past week’. Sociological Methodology, 33 , 55-80. ↵
- Schwarz, N., & Strack, F. (1990). Context effects in attitude surveys: Applying cognitive theory to social research. In W. Stroebe & M. Hewstone (Eds.), European review of social psychology (Vol. 2, pp. 31–50). Chichester, UK: Wiley. ↵
- Strack, F., Martin, L. L., & Schwarz, N. (1988). Priming and communication: The social determinants of information use in judgments of life satisfaction. European Journal of Social Psychology, 18 , 429–442. ↵
- Schwarz, N. (1999). Self-reports: How the questions shape the answers. American Psychologist, 54 , 93–105. ↵
- Miller, J.M. & Krosnick, J.A. (1998). The impact of candidate name order on election outcomes. Public Opinion Quarterly, 62 (3), 291-330. ↵
- null ↵
- National Social Norms Center. (2014). What is an acceptable response rate? https://socialnorms.org/what-is-an-acceptable-survey-response-rate/ ↵
- Visser, P.S., Krosnick, J.A., Marquette, J. & Curtin, M. (2000). Improving election forecasting: Allocation of undecided respondents, identification of likely voters, and response order effects. In P. Lavrakas & M. Traugott (Eds.). Election polls, the news media, and democracy. New York, NY: Chatham House. ↵
- Keeter, S., Kennedy, C., Dimock, M., Best, J., & Craighill, P. (2006). Gauging the impact of growing nonresponse on estimates from a national RDD telephone survey. Public Opinion Quarterly, 70 (5), 759-779. https://doi.org/10.1093/poq/nfl035 ↵
- Curtin, R., Presser, S., & Singer, E. (2000). The effects of response rate changes on the Index of Consumer Sentiment. Public Opinion Quarterly, 64( 4), 413-428. https://doi.org/10.1086/318638 ↵
- Holbrook, A. L., Krosnick, J., & Pfent, A. (2005). The causes and consequences of response rates in surveys by the news media and government contractor survey research firms. In M. Lepkowski, et al. (Eds.) Advances in Telephone Survey Methodology. https://doi.org/10.1002/9780470173404.ch23 ↵
- This is why my ratemyprofessor.com score is so low. Or that's what I tell myself. ↵
- Lindell, M. K., & Whitney, D. J. (2001). Accounting for common method variance in cross-sectional research designs. Journal of Applied Psychology, 86 (1), 114. ↵
- Podsakoff, P. M., MacKenzie, S. B., Lee, J. Y., & Podsakoff, N. P. (2003). Common method biases in behavioral research: a critical review of the literature and recommended remedies. Journal of Applied Psychology, 88 (5), 879. ↵
- Podsakoff, P. M., MacKenzie, S. B., Lee, J. Y., & Podsakoff, N. P. (2003). Common method biases in behavioral research: A critical review of the literature and recommended remedies. Journal of Applied Psychology, 88 (5), 879–03. https://doi.apa.org/doiLanding?doi=10.1037%2F0021-9010.88.5.879 ↵
- Whiteford, L. M., & Trotter II, R. T. (2008). Ethics for anthropological research and practice . Waveland Press. ↵
- Gordon, E. T. (1991). Anthropology and liberation. In F V Harrison (ed.) Decolonizing anthropology: Moving further toward an anthropology for liberation (pp. 149-167). Arlington, VA: American Anthropological Association. ↵
- Kline, M. A., Shamsudheen, R., & Broesch, T. (2018). Variation is the universal: Making cultural evolution work in developmental psychology. Philosophical Transactions of the Royal Society B: Biological Sciences , 373 (1743), 20170059. Stearman, A. M. (1984). The Yuquí connection: Another look at Sirionó deculturation. American Anthropologist , 86 (3), 630-650. ↵
- Hruschka, D. J., Munira, S., Jesmin, K., Hackman, J., & Tiokhin, L. (2018). Learning from failures of protocol in cross-cultural research. Proceedings of the National Academy of Sciences , 115 (45), 11428-11434. ↵
- Broesch, T., Callaghan, T., Henrich, J., Murphy, C., & Rochat, P. (2011). Cultural variations in children’s mirror self-recognition. Journal of Cross-Cultural Psychology , 42 (6), 1018-1029. ↵
- Van de Vijver, F. J., & Poortinga, Y. H. (1992). Testing in culturally heterogeneous populations: When are cultural loadings undesirable?. European Journal of Psychological Assessment . ↵
- Waltz, C. F., Strickland, O. L., & Lenz, E. R. (Eds.). (2010). Measurement in nursing and health research (4th ed.) . Springer. ↵
- Meiring, D., Van de Vijver, A. J. R., Rothmann, S., & Barrick, M. R. (2005). Construct, item and method bias of cognitive and personality tests in South Africa. SA Journal of Industrial Psychology , 31 (1), 1-8. ↵
- Van de Vijver, F. J., & Poortinga, Y. H. (1992). Testing in culturally heterogeneous populations: When are cultural loadings undesirable?. European Journal of Psychological Assessment . ↵
- Barrett, H. C. (2020). Deciding what to observe: Thoughts for a post-WEIRD generation. Evolution and Human Behavior , 41 (5), 445-453. ↵
- Henrich, J., Heine, S. J., & Norenzayan, A. (2010). Beyond WEIRD: Towards a broad-based behavioral science. Behavioral and Brain Sciences , 33 (2-3), 111. ↵
- Tucker, B. (2017). From risk and time preferences to cultural models of causality: on the challenges and possibilities of field experiments, with examples from rural Southwestern Madagascar. Impulsivity , 61-114. ↵
- Schroeder, D., Chatfield, K., Singh, M., Chennells, R., & Herissone-Kelly, P. (2019). Equitable research partnerships: a global code of conduct to counter ethics dumping . Springer Nature. ↵
- Schuller, M. (2010). From activist to applied anthropologist to anthropologist? On the politics of collaboration. Practicing Anthropology , 32 (1), 43-47. ↵
- First Nations Information Governance Centre. (2014). Ownership, control, access and possession (OCAP): The path to First Nations information governance. ↵
- Fischer, R., & Poortinga, Y. H. (2018). Addressing methodological challenges in culture-comparative research. Journal of Cross-Cultural Psychology , 49 (5), 691-712. ↵
- Hruschka, D. J. (2020). What we look with” is as important as “What we look at. Evolution and Human Behavior , 41 (5), 458-459. ↵
- Purzycki, B. G., & Lang, M. (2019). Identity fusion, outgroup relations, and sacrifice: a cross-cultural test. Cognition , 186 , 1-6. ↵
unintended influences on respondents’ answers because they are not related to the content of the item but to the context in which the item appears.
when the order in which the items are presented affects people’s responses
Social desirability bias occurs when we create questions that lead respondents to answer in ways that don't reflect their genuine thoughts or feelings to avoid being perceived negatively.
When respondents have difficult providing accurate answers to questions due to the passage of time.
If the majority of the targeted respondents fail to respond to a survey, then a legitimate concern is whether non-respondents are not responding due to a systematic reason, which may raise questions about the validity of the study’s results, especially as this relates to the representativeness of the sample.
Sampling bias is present when our sampling process results in a sample that does not represent our population in some way.
Common method bias refers to the amount of spurious covariance shared between independent and dependent variables that are measured at the same point in time.
the concept that scores obtained from a measure are similar when employed in different cultural populations
spurious covariance between your independent and dependent variables that is in fact caused by systematic error introduced by culturally insensitive or incompetent research practices
"when the construct measured is not identical across cultures or when behaviors that characterize the construct are not identical across cultures" (Meiring et al., 2005, p. 2)
Doctoral Research Methods in Social Work Copyright © by Mavs Open Press. All Rights Reserved.
Share This Book
IMAGES
VIDEO
COMMENTS
Identify the steps one should take to write effective survey questions. Describe some of the ways that survey questions might confuse respondents and how to overcome that possibility. Apply mutual exclusivity and exhaustiveness to writing closed-ended questions. Define fence-sitting and floating. Describe the steps involved in constructing a ...
Interview schedules- a researcher poses questions verbally to respondents. Longitudinal surveys- surveys in which a researcher to make observations over some extended period of time. Panel survey- describes how people in a specific group change over time, asking the same people each time the survey is administered.
Designing questionnaires. Based on your work in the previous section, you should have a first draft of the questions and response options for the key variables in your study. Now, you'll also need to think about how to present your written questions and response options to survey respondents. ... Social research methods: Qualitative and ...
In survey research, social desirability refers to the idea that respondents will try to answer questions in a way that will present them in a favorable light. (You may recall we covered social desirability bias in Chapter 9.) Let's go back to our example about transitioning to college to explore this concept further.
Basically, researchers use questionnaires as part of survey research. Questionnaires are the tool. Surveys are one research design for using that tool. ... Social work researchers look for the most favorable choices in design and methodology, as there are no perfect projects. If you are planning to conduct a survey of people with second-hand ...
The term "survey" is used in research design and involves asking questions and collecting and using tools to analyze data. [2] Specifically, the term "survey" denotes the overall strategy or approach to answering questions. Conversely, the term questionnaire is the actual tool that collects data.
Research methods for social work. Belmont, CA: Brooks/Cole. This book includes chapters, with an excellent introduction to sampling methods with easy-to-follow examples. A chapter called "Survey Research" essentially refers to survey (or questionnaire) administration methods (interviews, self-administered Internet, telephone).
Questionnaires, on the other hand, offer a written or verbal set of questions designed to gather standardized information from respondents. Both surveys and questionnaires provide a scalable approach, allowing social work practitioners to collect data from a large number of participants efficiently. ... In the realm of social work research ...
Survey research is defined as "the collection of information from a sample of individuals through their responses to questions" (Check & Schutt, 2012, p. 160). This type of research allows for a variety of methods to recruit participants, collect data, and utilize various methods of instrumentation. Survey research can use quantitative research ...
Writing a good research question is an art and a science. It is a science because you have to make sure it is clear, concise, and well-developed. It is an art because often your language needs "wordsmithing" to perfect and clarify the meaning. This is an exciting part of the research process; however, it can also be one of the most stressful.
Revised on June 22, 2023. A questionnaire is a list of questions or items used to gather data from respondents about their attitudes, experiences, or opinions. Questionnaires can be used to collect quantitative and/or qualitative information. Questionnaires are commonly used in market research as well as in the social and health sciences.
Social work researchers will send out a survey, receive responses, aggregate the results, analyze the data, and form conclusions based on trends. Surveys are one of the most common research methods social workers use — and for good reason. They tend to be relatively simple and are usually affordable.
Quantitative methods emphasize objective measurements and the statistical, mathematical, or numerical analysis of data collected through polls, questionnaires, and surveys, or by manipulating pre-existing statistical data using computational techniques.Quantitative research focuses on gathering numerical data and generalizing it across groups of people or to explain a particular phenomenon.
Social Work Toolbox: 37 Questions, Assessments, & Resources. 1 Mar 2022 by Jeremy Sutton, Ph.D. Scientifically reviewed by Jo Nash, Ph.D. Undoubtedly, the role of the social worker is a challenging one. This may be because of its unlikely position, balanced between "the individual and society, the powerful and the excluded" (Davies, 2013, p ...
Some methods of administering surveys can be cost effective. In a study of older people's experiences in the workplace, researchers were able to mail a written questionnaire to around 500 people who lived throughout the state of Maine at a cost of just over $1,000. This cost included printing copies of a seven-page survey, printing a cover ...
Social work is acknowledged to be a high-stress profession that involves working with people in distressing circumstances and complex life situations such as those experiencing abuse, domestic violence, substance misuse, and crime (Stanley & Mettilda, 2016).It has been observed that important sources of occupational stress for social workers include excessive workload, working overtime ...
Echoing Vostanis (2006) and O'Neill (2018) regarding use of the SDQ in social work, we maintain that these indicators are meant as an input to-not a substitute for-the social worker's professional ...
Survey research means collecting information about a group of people by asking them questions and analyzing the results. To conduct an effective survey, follow these six steps: Determine who will participate in the survey. Decide the type of survey (mail, online, or in-person) Design the survey questions and layout.
This guide is dedicated to using databases at Boston University to conduct specialized research in the field of social work. Why Do We Use Databases? You can use the BU Libraries Search box to connect to information across databases that you have access to. However, by choosing to start your search within a database, you can ensure that it ...
According to the subjects' responses to these six items and based on the principle of accumulation, questionnaires with scores of 6-20 indicated low social interaction anxiety, while ...
Figure 9.2 provides an example of an interview guide that uses questions rather than topics. Figure 9.2 Interview guide displaying questions rather than topics. As you might have guessed, interview guides do not appear out of thin air. They are the result of thoughtful and careful work on the part of a researcher.
The data of the study were obtained by the research method of questionnaire survey and the proposed hypotheses were validated using Smartpls software. 87.28% of the respondents in this study's survey sample were aged 18-40 years old, and people in this age group have higher pressure from study and work, and live a fast-paced life with less ...
The acknowledgement that most research in social work and other adjacent fields is overwhelmingly based on so-called WEIRD (Western, educated, industrialized, rich and democratic) populations—a topic we discussed in Chapter 10 —has given way to intensified research funding, publication, and visibility of collaborative cross-cultural studies ...