- IELTS Scores
- Life Skills Test
- Find a Test Centre
- Alternatives to IELTS
- All Lessons
- General Training
- IELTS Tests
- Academic Word List
- Topic Vocabulary
- Collocation
- Phrasal Verbs
- Writing eBooks
- Reading eBook
- All eBooks & Courses
- Task 1 Lessons & Tips
- Ielts Pie Chart

How to Write an IELTS Pie Chart
This lesson will provide you with tips and advice on how to write an IELTS pie chart for task 1.
To begin, take a look at the pie chart below, and then answer the quiz questions.
If you prefer or if you want extra tips you can also view this lesson in a video ( but don't forget afterwards to do the quizzes on this page that give you the language practice ! ):
You should spend about 20 minutes on this task .
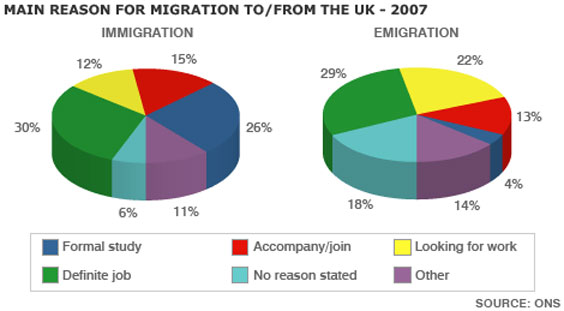
The pie charts show the main reasons for migration to and from the UK in 2007.
Summarise the information by selecting and reporting the main features and make comparisons where relevant.
Write at least 150 words.
Answer these questions about the IELTS pie chart:
Now take a look at a model answer:

The pie charts illustrate the primary reasons that people came to and left the UK in 2007. At first glance it is clear that the main factor influencing this decision was employment.
Having a definite job accounted for 30 per cent of immigration to the UK, and this figure was very similar for emigration, at 29%. A large number of people, 22%, also emigrated because they were looking for a job, though the proportion of people entering the UK for this purpose was noticeably lower at less than a fifth.
Another major factor influencing a move to the UK was for formal study, with over a quarter of people immigrating for this reason. However, interestingly, only a small minority, 4%, left for this.
The proportions of those moving to join a family member were quite similar for immigration and emigration, at 15% and 13% respectively. Although a significant number of people (32%) gave ‘other’ reasons or did not give a reason why they emigrated, this accounted for only 17% with regards to immigration.
(173 words)
Choose the most important points to write about first
These will usually be the largest ones. As you can see in the model answer, definite job, looking for work , and formal study were all written about first, in order of importance, as these are the main reasons that were chosen for moving.
Items such as ‘other ’ are usually less important and account for small amounts, so can be left till the end.
Make it easy to read
When you write a task 1, you should always group information in a logical way to make it easy to follow and read.
With an IELTS pie chart, the most logical thing to do is usually to compare categories together across the charts, focusing on similarities and differences, rather than writing about each chart separately.
If you write about each one separately, the person reading it will have to keep looking between the paragraphs in order to see how each category differs.
Vary your language
As with any task 1, this is important. You should not keep repeating the same structures. The key language when you write about pie charts is proportions and percentages .
Common phrases to see are " the proportion of… " or " the percentage of… "
However, you can also use other words and fractions. These are some examples from the model answer:
- A large number of people
- over a quarter of people
- a small minority
- A significant number of people
- less than a fifth
This table presents some examples of how you can change percentages to fractions or ratios:
You can improve your flexibility in using these words or test your knowledge of them in this percentage and proportions quiz .
If the percentages are not exact as above, then you can use qualifiers to make sure your description remains accurate. Here are some examples:
This table presents some examples of how you can change percentages to other phrases:
The words above are interchangeable, though number is for countable nouns and amount is for uncountable nouns .
You can practice or test yourself with the language used to approximate figures in this online quiz .
More Task 1 Academic Lessons:
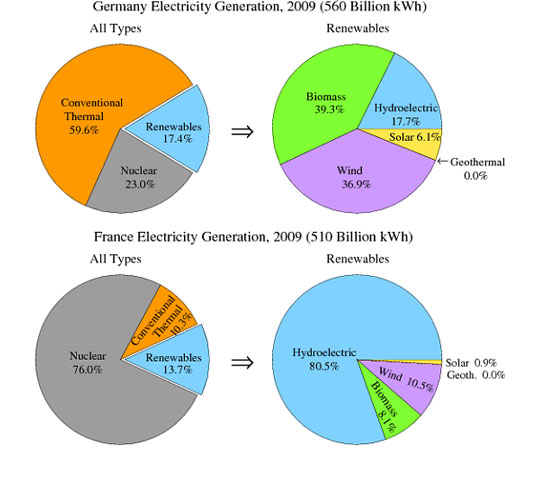
IELTS Sample Pie Chart: Describing four pie charts together
View a sample pie chart for the IELTS test on electricity generation, with a model answer. In a pie chart you have to use language connected to proportions and percentages.
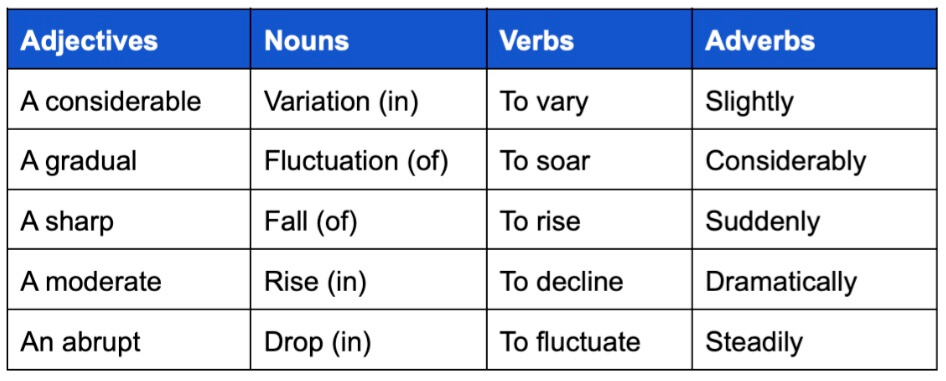
Useful Language for IELTS Graphs
This useful language for IELTS graphs looks at phrases for introducing graphs and describing changes
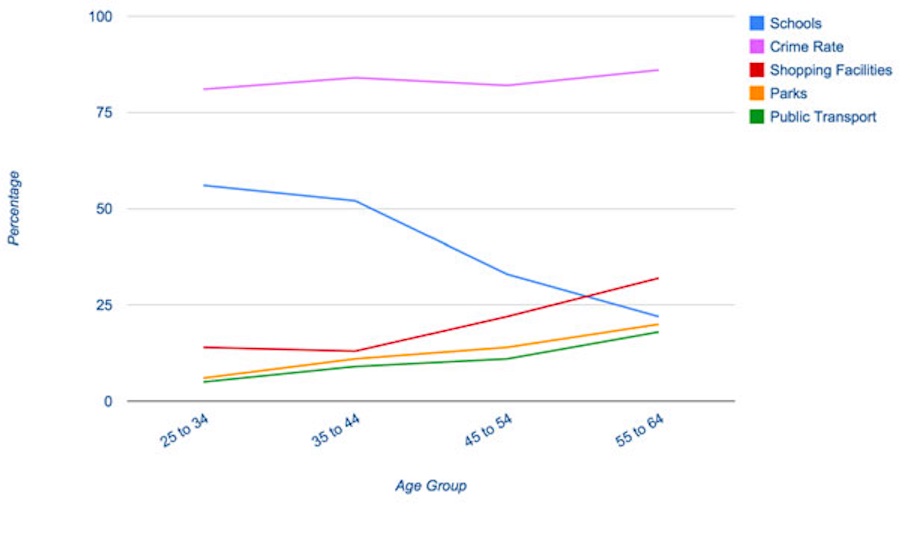
IELTS Task 1 Line Graph Structure Using Groups
For an IELTS Task 1 Line Graph there are different ways to organise your answer. Grouping information is a good way to get a logically structured response.
IELTS Table: Tips and techniques for a high score.
IELTS Table advice for a high score. Learn how to describe an IELTS table, which is just another way to present data.
Tips for Organising an IELTS Line Graph
Organising an IELTS Line Graph - This lesson shows you have to improve the coherency of your graph in order to achieve a high band score.
Writing Tips for a Graph in the Future in IELTS Academic
Graph in the future: Sometimes graphs in IELTS refer to a future time. You must know the language to write about these. In this lesson, learn how to write about an IELTS graph in the future. Getting the tenses right is an important part of the IELTS writing task 1.
Describing IELTS Graphs: Tips to avoid a common mistake
IELTS Graphs: A common mistake In IELTS graphs is to get the subject of the graph wrong. This lesson explains how this mistake is made and show you what you need to do to avoid it. There is a also a practice exercise.
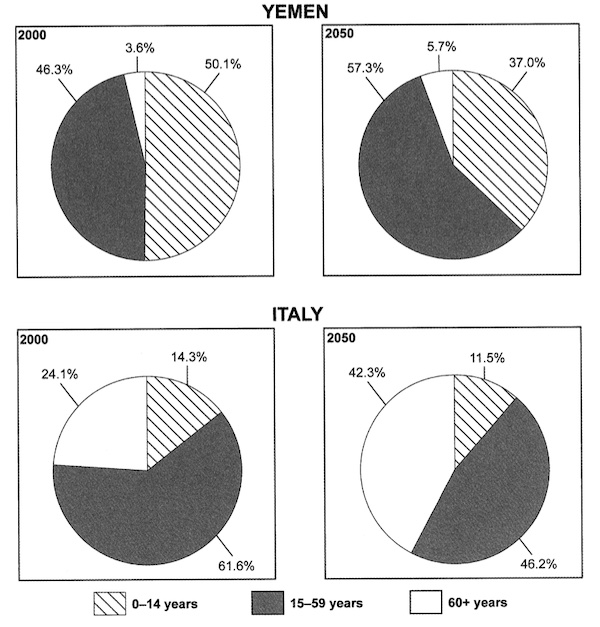
Task 1 Pie Chart: Using the past and future tenses
Task 1 pie chart for IELTS with model answer and tips on how to develop a high-scoring response to this type of chart. You need to use past and future tenses.
Which Tenses for IELTS are the Most Important?
Candidates often ask which tenses for IELTS are needed in order to do well in the exam. This lesson goes through the grammar tenses and how they apply to the test.

Take an IELTS Quiz to test your IELTS knowledge
IELTS Quizzes to test and train you on the writing task and task 2 of the IELTS test. Gap fills and multiple choice.
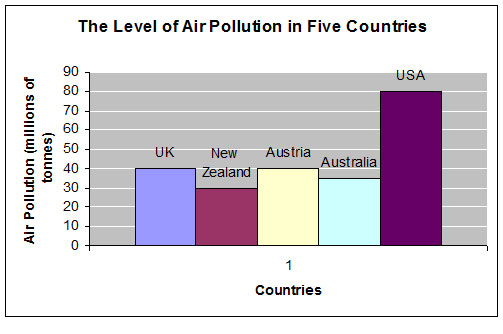
Learn Compare and Contrast Language for IELTS Graphs
Compare and Contrast Language: In the academic IELTS task 1, you have to know the right language if you want to get a band 7 or higher. Practice your IELTS language for bar charts in this task 1 writing lesson.
IELTS Pie Chart Exercise: Improve your language flexibility
With this IELTS pie chart exercise you can Improve your language and grammar for writing about Task One charts. The focus is on comparing and on 'proportions'.

Lesson on Writing IELTS Line Graphs
This lesson on writing IELTS line graphs provides you with the skills to write a high scoring graph.

How to Describe an IELTS Academic Writing Task 1 Graph
IELTS Academic Writing Task 1: This lesson describes in a simple way how you should describe a graph for the academic part of the test for task 1. You need an introduction, overview and body paragraphs. These simple steps will show you how, and how to get a high score.
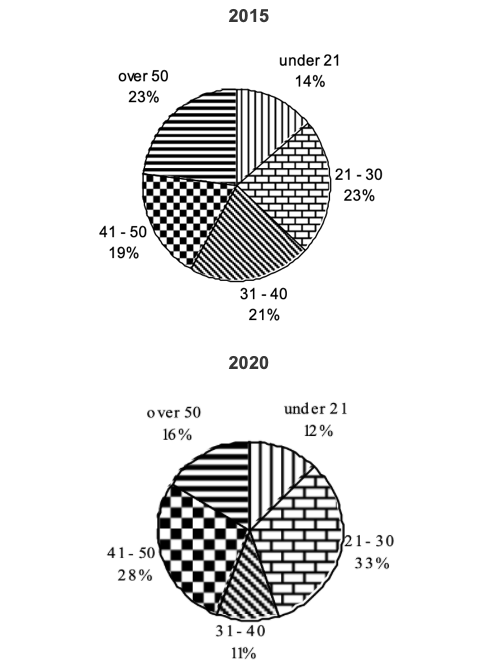
Writing Task 1 Pie Chart: Describing two pie charts over time
Writing Task 1 Pie Chart: This sample chart compares the structure of a company in terms of the ages of the workforce.
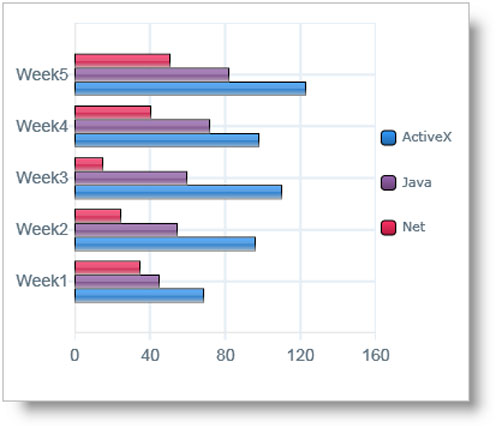
Describing an IELTS task 1 graph over time
This lesson shows you how to write an IELTS task 1 graph or chart that is over time.
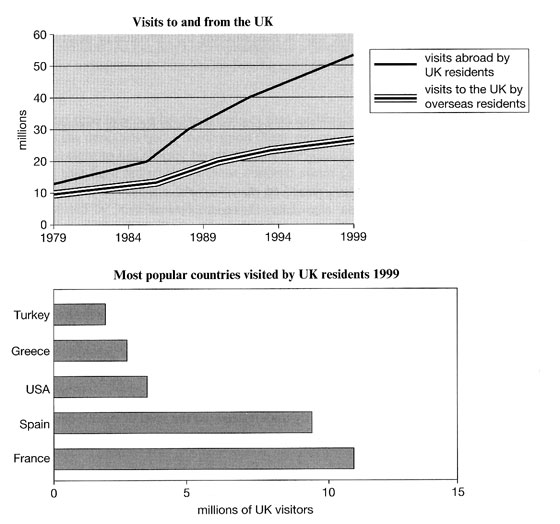
IELTS Bar and Line Graph: How to describe two graphs together
This Bar and Line Graph example shows you how you can write about two charts together in the IELTS test for task 1, with strategies and techniques.
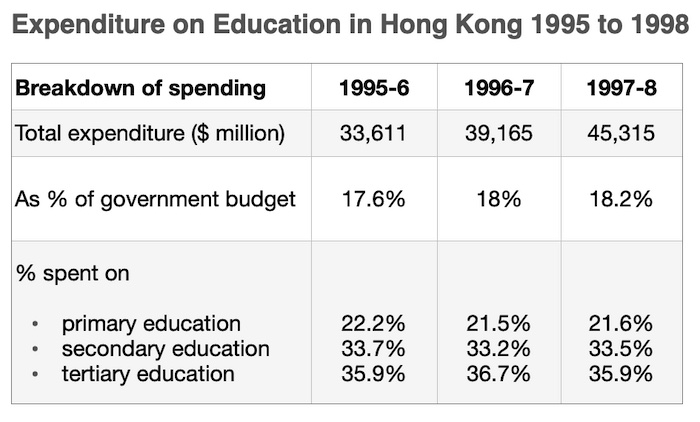
Describing Graph Trends Using the Language of Change
Describing graph trends: In IELTS you must know how to describe the trends that you see in the graph you are given. This lesson provides practice with some common language used to describe trends.
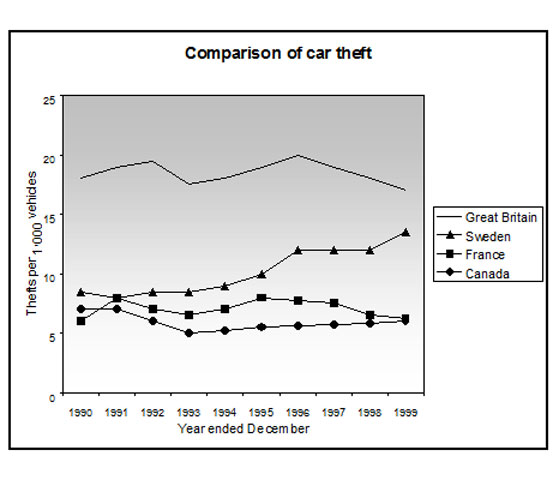
Prepositions in Graphs Quiz: Between; from; to; at; of; in; with; by
Prepositions in Graphs: Practice using prepositions in the IELTS test. View a model answer and practice using a gap fill.
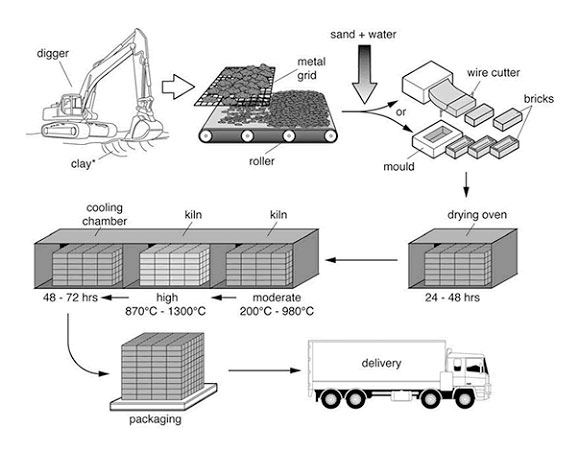
IELTS Process Diagram Strategies and Tips
IELTS Process Diagram: In task 1 of IELTS writing you usually have to describe some kind of graph or chart. But sometimes you get a process. It is therefore crucial that you know how to do this. This easy to follow lesson explains how.
Any comments or questions about this page or about IELTS? Post them here. Your email will not be published or shared.
Band 7+ eBooks
"I think these eBooks are FANTASTIC!!! I know that's not academic language, but it's the truth!"
Linda, from Italy, Scored Band 7.5

Bargain eBook Deal! 30% Discount

All 4 Writing eBooks for just $25.86 Find out more >>
IELTS Modules:
Other resources:.
- Band Score Calculator
- Writing Feedback
- Speaking Feedback
- Teacher Resources
- Free Downloads
- Recent Essay Exam Questions
- Books for IELTS Prep
- Useful Links

Recent Articles
Online IELTS Listening Test Section 4
Nov 14, 24 02:35 AM
IELTS Podcasts
Nov 10, 24 04:25 PM
Improve Coherence and Cohesion in IELTS Writing
Oct 27, 24 07:24 AM

Important pages
IELTS Writing IELTS Speaking IELTS Listening IELTS Reading All Lessons Vocabulary Academic Task 1 Academic Task 2 Practice Tests
Connect with us
Podcast

Before you go...
30% discount - just $25.86 for all 4 writing ebooks.
Copyright © 2022- IELTSbuddy All Rights Reserved
IELTS is a registered trademark of University of Cambridge, the British Council, and IDP Education Australia. This site and its owners are not affiliated, approved or endorsed by the University of Cambridge ESOL, the British Council, and IDP Education Australia.
Free IELTS lessons signup

- Academic practice
- General practice
- Task 1 Academic
- Task 1 General
- Task 2 (essay)
IELTS Academic Writing Task 1. Sample 1
You should spend about 20 minutes on this task.
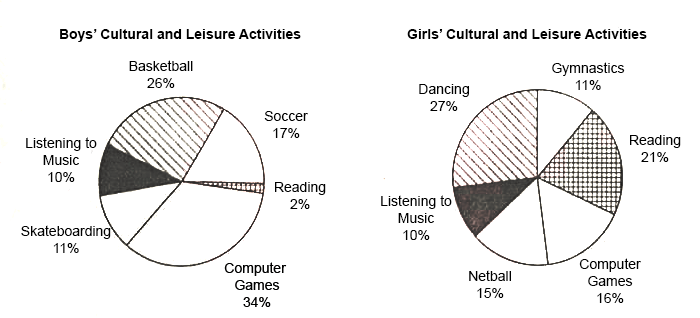
The pie graphs below show the result of a survey of children's activities. The first graph shows the cultural and leisure activities that boys participate in, whereas the second graph shows the activities in which the girls participate.
Write a report describing the information shown in the two pie graphs.
Write at least 150 words.
How to answer this task?
Introduce the pie charts.
Write what do they summarize.
Write a general overview.
Write in brief the main trends.
Describe the first chart.
Tell about the activities on the boys' chart and their popularity. Use linking structures and vocabulary to describe graphs .
Describe the second chart.
Tell about the activities on the girls' chart and their popularity. Use words from academic wordlist .
Model answer
The two pie charts draw the conclusion of a survey of boys' and girls' cultural and leisure activities.
Overall, equal quantities of both sexes enjoyed listening to music, but a dramatically larger number of girls liked reading. There were also many differences in terms of the children's preferred sports.
Turning to the first chart, we can observe that boys prefer playing computer games (34% participation rate) than taking other activities. Playing basketball comes as the second most popular leisure, practiced by almost a third of male children. Basketball is followed by soccer, which is exercised by 17%. Skateboarding and listening to music are less preferable activities, chosen by 11% and 10% of boys respectively. Reading, the least popular cultural activity among boys, represents only two percent.
Taking a closer look at the second chart, we can see that girls' most preferred activity is dancing, being 27% of the total. In contrast to the boys' preferences, reading is chosen by more than a fifth of all girls. Although percentage of female children who play computer games is roughly twice less than that of boys (16%), this activity is third most popular on the girls' chart. With a slight difference between computer games and netball, the latter is practiced at 15% rate. Similarly to skateboarding popularity among boys, 11% of girls go in for gymnastics. Listening to music comes as the least popular leisure, with a proportion of 10%, equal to those on the first chart.
(244 words)

IMAGES
VIDEO