A Step-by-Step Guide to the Data Analysis Process
Like any scientific discipline, data analysis follows a rigorous step-by-step process. Each stage requires different skills and know-how. To get meaningful insights, though, it’s important to understand the process as a whole. An underlying framework is invaluable for producing results that stand up to scrutiny.
In this post, we’ll explore the main steps in the data analysis process. This will cover how to define your goal, collect data, and carry out an analysis. Where applicable, we’ll also use examples and highlight a few tools to make the journey easier. When you’re done, you’ll have a much better understanding of the basics. This will help you tweak the process to fit your own needs.
Here are the steps we’ll take you through:
- Defining the question
- Collecting the data
- Cleaning the data
- Analyzing the data
- Sharing your results
- Embracing failure
On popular request, we’ve also developed a video based on this article. Scroll further along this article to watch that.
Ready? Let’s get started with step one.

1. Step one: Defining the question
The first step in any data analysis process is to define your objective. In data analytics jargon, this is sometimes called the ‘problem statement’.
Defining your objective means coming up with a hypothesis and figuring how to test it. Start by asking: What business problem am I trying to solve? While this might sound straightforward, it can be trickier than it seems. For instance, your organization’s senior management might pose an issue, such as: “Why are we losing customers?” It’s possible, though, that this doesn’t get to the core of the problem. A data analyst’s job is to understand the business and its goals in enough depth that they can frame the problem the right way.
Let’s say you work for a fictional company called TopNotch Learning. TopNotch creates custom training software for its clients. While it is excellent at securing new clients, it has much lower repeat business. As such, your question might not be, “Why are we losing customers?” but, “Which factors are negatively impacting the customer experience?” or better yet: “How can we boost customer retention while minimizing costs?”
Now you’ve defined a problem, you need to determine which sources of data will best help you solve it. This is where your business acumen comes in again. For instance, perhaps you’ve noticed that the sales process for new clients is very slick, but that the production team is inefficient. Knowing this, you could hypothesize that the sales process wins lots of new clients, but the subsequent customer experience is lacking. Could this be why customers don’t come back? Which sources of data will help you answer this question?
Tools to help define your objective
Defining your objective is mostly about soft skills, business knowledge, and lateral thinking. But you’ll also need to keep track of business metrics and key performance indicators (KPIs). Monthly reports can allow you to track problem points in the business. Some KPI dashboards come with a fee, like Databox and DashThis . However, you’ll also find open-source software like Grafana , Freeboard , and Dashbuilder . These are great for producing simple dashboards, both at the beginning and the end of the data analysis process.
2. Step two: Collecting the data
Once you’ve established your objective, you’ll need to create a strategy for collecting and aggregating the appropriate data. A key part of this is determining which data you need. This might be quantitative (numeric) data, e.g. sales figures, or qualitative (descriptive) data, such as customer reviews. All data fit into one of three categories: first-party, second-party, and third-party data. Let’s explore each one.
What is first-party data?
First-party data are data that you, or your company, have directly collected from customers. It might come in the form of transactional tracking data or information from your company’s customer relationship management (CRM) system. Whatever its source, first-party data is usually structured and organized in a clear, defined way. Other sources of first-party data might include customer satisfaction surveys, focus groups, interviews, or direct observation.
What is second-party data?
To enrich your analysis, you might want to secure a secondary data source. Second-party data is the first-party data of other organizations. This might be available directly from the company or through a private marketplace. The main benefit of second-party data is that they are usually structured, and although they will be less relevant than first-party data, they also tend to be quite reliable. Examples of second-party data include website, app or social media activity, like online purchase histories, or shipping data.
What is third-party data?
Third-party data is data that has been collected and aggregated from numerous sources by a third-party organization. Often (though not always) third-party data contains a vast amount of unstructured data points (big data). Many organizations collect big data to create industry reports or to conduct market research. The research and advisory firm Gartner is a good real-world example of an organization that collects big data and sells it on to other companies. Open data repositories and government portals are also sources of third-party data .
Tools to help you collect data
Once you’ve devised a data strategy (i.e. you’ve identified which data you need, and how best to go about collecting them) there are many tools you can use to help you. One thing you’ll need, regardless of industry or area of expertise, is a data management platform (DMP). A DMP is a piece of software that allows you to identify and aggregate data from numerous sources, before manipulating them, segmenting them, and so on. There are many DMPs available. Some well-known enterprise DMPs include Salesforce DMP , SAS , and the data integration platform, Xplenty . If you want to play around, you can also try some open-source platforms like Pimcore or D:Swarm .
Want to learn more about what data analytics is and the process a data analyst follows? We cover this topic (and more) in our free introductory short course for beginners. Check out tutorial one: An introduction to data analytics .
3. Step three: Cleaning the data
Once you’ve collected your data, the next step is to get it ready for analysis. This means cleaning, or ‘scrubbing’ it, and is crucial in making sure that you’re working with high-quality data . Key data cleaning tasks include:
- Removing major errors, duplicates, and outliers —all of which are inevitable problems when aggregating data from numerous sources.
- Removing unwanted data points —extracting irrelevant observations that have no bearing on your intended analysis.
- Bringing structure to your data —general ‘housekeeping’, i.e. fixing typos or layout issues, which will help you map and manipulate your data more easily.
- Filling in major gaps —as you’re tidying up, you might notice that important data are missing. Once you’ve identified gaps, you can go about filling them.
A good data analyst will spend around 70-90% of their time cleaning their data. This might sound excessive. But focusing on the wrong data points (or analyzing erroneous data) will severely impact your results. It might even send you back to square one…so don’t rush it! You’ll find a step-by-step guide to data cleaning here . You may be interested in this introductory tutorial to data cleaning, hosted by Dr. Humera Noor Minhas.
Carrying out an exploratory analysis
Another thing many data analysts do (alongside cleaning data) is to carry out an exploratory analysis. This helps identify initial trends and characteristics, and can even refine your hypothesis. Let’s use our fictional learning company as an example again. Carrying out an exploratory analysis, perhaps you notice a correlation between how much TopNotch Learning’s clients pay and how quickly they move on to new suppliers. This might suggest that a low-quality customer experience (the assumption in your initial hypothesis) is actually less of an issue than cost. You might, therefore, take this into account.
Tools to help you clean your data
Cleaning datasets manually—especially large ones—can be daunting. Luckily, there are many tools available to streamline the process. Open-source tools, such as OpenRefine , are excellent for basic data cleaning, as well as high-level exploration. However, free tools offer limited functionality for very large datasets. Python libraries (e.g. Pandas) and some R packages are better suited for heavy data scrubbing. You will, of course, need to be familiar with the languages. Alternatively, enterprise tools are also available. For example, Data Ladder , which is one of the highest-rated data-matching tools in the industry. There are many more. Why not see which free data cleaning tools you can find to play around with?
4. Step four: Analyzing the data
Finally, you’ve cleaned your data. Now comes the fun bit—analyzing it! The type of data analysis you carry out largely depends on what your goal is. But there are many techniques available. Univariate or bivariate analysis, time-series analysis, and regression analysis are just a few you might have heard of. More important than the different types, though, is how you apply them. This depends on what insights you’re hoping to gain. Broadly speaking, all types of data analysis fit into one of the following four categories.
Descriptive analysis
Descriptive analysis identifies what has already happened . It is a common first step that companies carry out before proceeding with deeper explorations. As an example, let’s refer back to our fictional learning provider once more. TopNotch Learning might use descriptive analytics to analyze course completion rates for their customers. Or they might identify how many users access their products during a particular period. Perhaps they’ll use it to measure sales figures over the last five years. While the company might not draw firm conclusions from any of these insights, summarizing and describing the data will help them to determine how to proceed.
Learn more: What is descriptive analytics?
Diagnostic analysis
Diagnostic analytics focuses on understanding why something has happened . It is literally the diagnosis of a problem, just as a doctor uses a patient’s symptoms to diagnose a disease. Remember TopNotch Learning’s business problem? ‘Which factors are negatively impacting the customer experience?’ A diagnostic analysis would help answer this. For instance, it could help the company draw correlations between the issue (struggling to gain repeat business) and factors that might be causing it (e.g. project costs, speed of delivery, customer sector, etc.) Let’s imagine that, using diagnostic analytics, TopNotch realizes its clients in the retail sector are departing at a faster rate than other clients. This might suggest that they’re losing customers because they lack expertise in this sector. And that’s a useful insight!
Predictive analysis
Predictive analysis allows you to identify future trends based on historical data . In business, predictive analysis is commonly used to forecast future growth, for example. But it doesn’t stop there. Predictive analysis has grown increasingly sophisticated in recent years. The speedy evolution of machine learning allows organizations to make surprisingly accurate forecasts. Take the insurance industry. Insurance providers commonly use past data to predict which customer groups are more likely to get into accidents. As a result, they’ll hike up customer insurance premiums for those groups. Likewise, the retail industry often uses transaction data to predict where future trends lie, or to determine seasonal buying habits to inform their strategies. These are just a few simple examples, but the untapped potential of predictive analysis is pretty compelling.
Prescriptive analysis
Prescriptive analysis allows you to make recommendations for the future. This is the final step in the analytics part of the process. It’s also the most complex. This is because it incorporates aspects of all the other analyses we’ve described. A great example of prescriptive analytics is the algorithms that guide Google’s self-driving cars. Every second, these algorithms make countless decisions based on past and present data, ensuring a smooth, safe ride. Prescriptive analytics also helps companies decide on new products or areas of business to invest in.
Learn more: What are the different types of data analysis?
5. Step five: Sharing your results
You’ve finished carrying out your analyses. You have your insights. The final step of the data analytics process is to share these insights with the wider world (or at least with your organization’s stakeholders!) This is more complex than simply sharing the raw results of your work—it involves interpreting the outcomes, and presenting them in a manner that’s digestible for all types of audiences. Since you’ll often present information to decision-makers, it’s very important that the insights you present are 100% clear and unambiguous. For this reason, data analysts commonly use reports, dashboards, and interactive visualizations to support their findings.
How you interpret and present results will often influence the direction of a business. Depending on what you share, your organization might decide to restructure, to launch a high-risk product, or even to close an entire division. That’s why it’s very important to provide all the evidence that you’ve gathered, and not to cherry-pick data. Ensuring that you cover everything in a clear, concise way will prove that your conclusions are scientifically sound and based on the facts. On the flip side, it’s important to highlight any gaps in the data or to flag any insights that might be open to interpretation. Honest communication is the most important part of the process. It will help the business, while also helping you to excel at your job!
Tools for interpreting and sharing your findings
There are tons of data visualization tools available, suited to different experience levels. Popular tools requiring little or no coding skills include Google Charts , Tableau , Datawrapper , and Infogram . If you’re familiar with Python and R, there are also many data visualization libraries and packages available. For instance, check out the Python libraries Plotly , Seaborn , and Matplotlib . Whichever data visualization tools you use, make sure you polish up your presentation skills, too. Remember: Visualization is great, but communication is key!
You can learn more about storytelling with data in this free, hands-on tutorial . We show you how to craft a compelling narrative for a real dataset, resulting in a presentation to share with key stakeholders. This is an excellent insight into what it’s really like to work as a data analyst!
6. Step six: Embrace your failures
The last ‘step’ in the data analytics process is to embrace your failures. The path we’ve described above is more of an iterative process than a one-way street. Data analytics is inherently messy, and the process you follow will be different for every project. For instance, while cleaning data, you might spot patterns that spark a whole new set of questions. This could send you back to step one (to redefine your objective). Equally, an exploratory analysis might highlight a set of data points you’d never considered using before. Or maybe you find that the results of your core analyses are misleading or erroneous. This might be caused by mistakes in the data, or human error earlier in the process.
While these pitfalls can feel like failures, don’t be disheartened if they happen. Data analysis is inherently chaotic, and mistakes occur. What’s important is to hone your ability to spot and rectify errors. If data analytics was straightforward, it might be easier, but it certainly wouldn’t be as interesting. Use the steps we’ve outlined as a framework, stay open-minded, and be creative. If you lose your way, you can refer back to the process to keep yourself on track.
In this post, we’ve covered the main steps of the data analytics process. These core steps can be amended, re-ordered and re-used as you deem fit, but they underpin every data analyst’s work:
- Define the question —What business problem are you trying to solve? Frame it as a question to help you focus on finding a clear answer.
- Collect data —Create a strategy for collecting data. Which data sources are most likely to help you solve your business problem?
- Clean the data —Explore, scrub, tidy, de-dupe, and structure your data as needed. Do whatever you have to! But don’t rush…take your time!
- Analyze the data —Carry out various analyses to obtain insights. Focus on the four types of data analysis: descriptive, diagnostic, predictive, and prescriptive.
- Share your results —How best can you share your insights and recommendations? A combination of visualization tools and communication is key.
- Embrace your mistakes —Mistakes happen. Learn from them. This is what transforms a good data analyst into a great one.
What next? From here, we strongly encourage you to explore the topic on your own. Get creative with the steps in the data analysis process, and see what tools you can find. As long as you stick to the core principles we’ve described, you can create a tailored technique that works for you.
To learn more, check out our free, 5-day data analytics short course . You might also be interested in the following:
- These are the top 9 data analytics tools
- 10 great places to find free datasets for your next project
- How to build a data analytics portfolio
Your Modern Business Guide To Data Analysis Methods And Techniques

Table of Contents
1) What Is Data Analysis?
2) Why Is Data Analysis Important?
3) What Is The Data Analysis Process?
4) Types Of Data Analysis Methods
5) Top Data Analysis Techniques To Apply
6) Quality Criteria For Data Analysis
7) Data Analysis Limitations & Barriers
8) Data Analysis Skills
9) Data Analysis In The Big Data Environment
In our data-rich age, understanding how to analyze and extract true meaning from our business’s digital insights is one of the primary drivers of success.
Despite the colossal volume of data we create every day, a mere 0.5% is actually analyzed and used for data discovery , improvement, and intelligence. While that may not seem like much, considering the amount of digital information we have at our fingertips, half a percent still accounts for a vast amount of data.
With so much data and so little time, knowing how to collect, curate, organize, and make sense of all of this potentially business-boosting information can be a minefield – but online data analysis is the solution.
In science, data analysis uses a more complex approach with advanced techniques to explore and experiment with data. On the other hand, in a business context, data is used to make data-driven decisions that will enable the company to improve its overall performance. In this post, we will cover the analysis of data from an organizational point of view while still going through the scientific and statistical foundations that are fundamental to understanding the basics of data analysis.
To put all of that into perspective, we will answer a host of important analytical questions, explore analytical methods and techniques, while demonstrating how to perform analysis in the real world with a 17-step blueprint for success.
What Is Data Analysis?
Data analysis is the process of collecting, modeling, and analyzing data using various statistical and logical methods and techniques. Businesses rely on analytics processes and tools to extract insights that support strategic and operational decision-making.
All these various methods are largely based on two core areas: quantitative and qualitative research.
To explain the key differences between qualitative and quantitative research, here’s a video for your viewing pleasure:
Gaining a better understanding of different techniques and methods in quantitative research as well as qualitative insights will give your analyzing efforts a more clearly defined direction, so it’s worth taking the time to allow this particular knowledge to sink in. Additionally, you will be able to create a comprehensive analytical report that will skyrocket your analysis.
Apart from qualitative and quantitative categories, there are also other types of data that you should be aware of before dividing into complex data analysis processes. These categories include:
- Big data: Refers to massive data sets that need to be analyzed using advanced software to reveal patterns and trends. It is considered to be one of the best analytical assets as it provides larger volumes of data at a faster rate.
- Metadata: Putting it simply, metadata is data that provides insights about other data. It summarizes key information about specific data that makes it easier to find and reuse for later purposes.
- Real time data: As its name suggests, real time data is presented as soon as it is acquired. From an organizational perspective, this is the most valuable data as it can help you make important decisions based on the latest developments. Our guide on real time analytics will tell you more about the topic.
- Machine data: This is more complex data that is generated solely by a machine such as phones, computers, or even websites and embedded systems, without previous human interaction.
Why Is Data Analysis Important?
Before we go into detail about the categories of analysis along with its methods and techniques, you must understand the potential that analyzing data can bring to your organization.
- Informed decision-making : From a management perspective, you can benefit from analyzing your data as it helps you make decisions based on facts and not simple intuition. For instance, you can understand where to invest your capital, detect growth opportunities, predict your income, or tackle uncommon situations before they become problems. Through this, you can extract relevant insights from all areas in your organization, and with the help of dashboard software , present the data in a professional and interactive way to different stakeholders.
- Reduce costs : Another great benefit is to reduce costs. With the help of advanced technologies such as predictive analytics, businesses can spot improvement opportunities, trends, and patterns in their data and plan their strategies accordingly. In time, this will help you save money and resources on implementing the wrong strategies. And not just that, by predicting different scenarios such as sales and demand you can also anticipate production and supply.
- Target customers better : Customers are arguably the most crucial element in any business. By using analytics to get a 360° vision of all aspects related to your customers, you can understand which channels they use to communicate with you, their demographics, interests, habits, purchasing behaviors, and more. In the long run, it will drive success to your marketing strategies, allow you to identify new potential customers, and avoid wasting resources on targeting the wrong people or sending the wrong message. You can also track customer satisfaction by analyzing your client’s reviews or your customer service department’s performance.
What Is The Data Analysis Process?

When we talk about analyzing data there is an order to follow in order to extract the needed conclusions. The analysis process consists of 5 key stages. We will cover each of them more in detail later in the post, but to start providing the needed context to understand what is coming next, here is a rundown of the 5 essential steps of data analysis.
- Identify: Before you get your hands dirty with data, you first need to identify why you need it in the first place. The identification is the stage in which you establish the questions you will need to answer. For example, what is the customer's perception of our brand? Or what type of packaging is more engaging to our potential customers? Once the questions are outlined you are ready for the next step.
- Collect: As its name suggests, this is the stage where you start collecting the needed data. Here, you define which sources of data you will use and how you will use them. The collection of data can come in different forms such as internal or external sources, surveys, interviews, questionnaires, and focus groups, among others. An important note here is that the way you collect the data will be different in a quantitative and qualitative scenario.
- Clean: Once you have the necessary data it is time to clean it and leave it ready for analysis. Not all the data you collect will be useful, when collecting big amounts of data in different formats it is very likely that you will find yourself with duplicate or badly formatted data. To avoid this, before you start working with your data you need to make sure to erase any white spaces, duplicate records, or formatting errors. This way you avoid hurting your analysis with bad-quality data.
- Analyze : With the help of various techniques such as statistical analysis, regressions, neural networks, text analysis, and more, you can start analyzing and manipulating your data to extract relevant conclusions. At this stage, you find trends, correlations, variations, and patterns that can help you answer the questions you first thought of in the identify stage. Various technologies in the market assist researchers and average users with the management of their data. Some of them include business intelligence and visualization software, predictive analytics, and data mining, among others.
- Interpret: Last but not least you have one of the most important steps: it is time to interpret your results. This stage is where the researcher comes up with courses of action based on the findings. For example, here you would understand if your clients prefer packaging that is red or green, plastic or paper, etc. Additionally, at this stage, you can also find some limitations and work on them.
Now that you have a basic understanding of the key data analysis steps, let’s look at the top 17 essential methods.
17 Essential Types Of Data Analysis Methods
Before diving into the 17 essential types of methods, it is important that we go over really fast through the main analysis categories. Starting with the category of descriptive up to prescriptive analysis, the complexity and effort of data evaluation increases, but also the added value for the company.
a) Descriptive analysis - What happened.
The descriptive analysis method is the starting point for any analytic reflection, and it aims to answer the question of what happened? It does this by ordering, manipulating, and interpreting raw data from various sources to turn it into valuable insights for your organization.
Performing descriptive analysis is essential, as it enables us to present our insights in a meaningful way. Although it is relevant to mention that this analysis on its own will not allow you to predict future outcomes or tell you the answer to questions like why something happened, it will leave your data organized and ready to conduct further investigations.
b) Exploratory analysis - How to explore data relationships.
As its name suggests, the main aim of the exploratory analysis is to explore. Prior to it, there is still no notion of the relationship between the data and the variables. Once the data is investigated, exploratory analysis helps you to find connections and generate hypotheses and solutions for specific problems. A typical area of application for it is data mining.
c) Diagnostic analysis - Why it happened.
Diagnostic data analytics empowers analysts and executives by helping them gain a firm contextual understanding of why something happened. If you know why something happened as well as how it happened, you will be able to pinpoint the exact ways of tackling the issue or challenge.
Designed to provide direct and actionable answers to specific questions, this is one of the world’s most important methods in research, among its other key organizational functions such as retail analytics , e.g.
c) Predictive analysis - What will happen.
The predictive method allows you to look into the future to answer the question: what will happen? In order to do this, it uses the results of the previously mentioned descriptive, exploratory, and diagnostic analysis, in addition to machine learning (ML) and artificial intelligence (AI). Through this, you can uncover future trends, potential problems or inefficiencies, connections, and casualties in your data.
With predictive analysis, you can unfold and develop initiatives that will not only enhance your various operational processes but also help you gain an all-important edge over the competition. If you understand why a trend, pattern, or event happened through data, you will be able to develop an informed projection of how things may unfold in particular areas of the business.
e) Prescriptive analysis - How will it happen.
Another of the most effective types of analysis methods in research. Prescriptive data techniques cross over from predictive analysis in the way that it revolves around using patterns or trends to develop responsive, practical business strategies.
By drilling down into prescriptive analysis, you will play an active role in the data consumption process by taking well-arranged sets of visual data and using it as a powerful fix to emerging issues in a number of key areas, including marketing, sales, customer experience, HR, fulfillment, finance, logistics analytics , and others.

As mentioned at the beginning of the post, data analysis methods can be divided into two big categories: quantitative and qualitative. Each of these categories holds a powerful analytical value that changes depending on the scenario and type of data you are working with. Below, we will discuss 17 methods that are divided into qualitative and quantitative approaches.
Without further ado, here are the 17 essential types of data analysis methods with some use cases in the business world:
A. Quantitative Methods
To put it simply, quantitative analysis refers to all methods that use numerical data or data that can be turned into numbers (e.g. category variables like gender, age, etc.) to extract valuable insights. It is used to extract valuable conclusions about relationships, differences, and test hypotheses. Below we discuss some of the key quantitative methods.
1. Cluster analysis
The action of grouping a set of data elements in a way that said elements are more similar (in a particular sense) to each other than to those in other groups – hence the term ‘cluster.’ Since there is no target variable when clustering, the method is often used to find hidden patterns in the data. The approach is also used to provide additional context to a trend or dataset.
Let's look at it from an organizational perspective. In a perfect world, marketers would be able to analyze each customer separately and give them the best-personalized service, but let's face it, with a large customer base, it is timely impossible to do that. That's where clustering comes in. By grouping customers into clusters based on demographics, purchasing behaviors, monetary value, or any other factor that might be relevant for your company, you will be able to immediately optimize your efforts and give your customers the best experience based on their needs.
2. Cohort analysis
This type of data analysis approach uses historical data to examine and compare a determined segment of users' behavior, which can then be grouped with others with similar characteristics. By using this methodology, it's possible to gain a wealth of insight into consumer needs or a firm understanding of a broader target group.
Cohort analysis can be really useful for performing analysis in marketing as it will allow you to understand the impact of your campaigns on specific groups of customers. To exemplify, imagine you send an email campaign encouraging customers to sign up for your site. For this, you create two versions of the campaign with different designs, CTAs, and ad content. Later on, you can use cohort analysis to track the performance of the campaign for a longer period of time and understand which type of content is driving your customers to sign up, repurchase, or engage in other ways.
A useful tool to start performing cohort analysis method is Google Analytics. You can learn more about the benefits and limitations of using cohorts in GA in this useful guide . In the bottom image, you see an example of how you visualize a cohort in this tool. The segments (devices traffic) are divided into date cohorts (usage of devices) and then analyzed week by week to extract insights into performance.

3. Regression analysis
Regression uses historical data to understand how a dependent variable's value is affected when one (linear regression) or more independent variables (multiple regression) change or stay the same. By understanding each variable's relationship and how it developed in the past, you can anticipate possible outcomes and make better decisions in the future.
Let's bring it down with an example. Imagine you did a regression analysis of your sales in 2019 and discovered that variables like product quality, store design, customer service, marketing campaigns, and sales channels affected the overall result. Now you want to use regression to analyze which of these variables changed or if any new ones appeared during 2020. For example, you couldn’t sell as much in your physical store due to COVID lockdowns. Therefore, your sales could’ve either dropped in general or increased in your online channels. Through this, you can understand which independent variables affected the overall performance of your dependent variable, annual sales.
If you want to go deeper into this type of analysis, check out this article and learn more about how you can benefit from regression.
4. Neural networks
The neural network forms the basis for the intelligent algorithms of machine learning. It is a form of analytics that attempts, with minimal intervention, to understand how the human brain would generate insights and predict values. Neural networks learn from each and every data transaction, meaning that they evolve and advance over time.
A typical area of application for neural networks is predictive analytics. There are BI reporting tools that have this feature implemented within them, such as the Predictive Analytics Tool from datapine. This tool enables users to quickly and easily generate all kinds of predictions. All you have to do is select the data to be processed based on your KPIs, and the software automatically calculates forecasts based on historical and current data. Thanks to its user-friendly interface, anyone in your organization can manage it; there’s no need to be an advanced scientist.
Here is an example of how you can use the predictive analysis tool from datapine:

**click to enlarge**
5. Factor analysis
The factor analysis also called “dimension reduction” is a type of data analysis used to describe variability among observed, correlated variables in terms of a potentially lower number of unobserved variables called factors. The aim here is to uncover independent latent variables, an ideal method for streamlining specific segments.
A good way to understand this data analysis method is a customer evaluation of a product. The initial assessment is based on different variables like color, shape, wearability, current trends, materials, comfort, the place where they bought the product, and frequency of usage. Like this, the list can be endless, depending on what you want to track. In this case, factor analysis comes into the picture by summarizing all of these variables into homogenous groups, for example, by grouping the variables color, materials, quality, and trends into a brother latent variable of design.
If you want to start analyzing data using factor analysis we recommend you take a look at this practical guide from UCLA.
6. Data mining
A method of data analysis that is the umbrella term for engineering metrics and insights for additional value, direction, and context. By using exploratory statistical evaluation, data mining aims to identify dependencies, relations, patterns, and trends to generate advanced knowledge. When considering how to analyze data, adopting a data mining mindset is essential to success - as such, it’s an area that is worth exploring in greater detail.
An excellent use case of data mining is datapine intelligent data alerts . With the help of artificial intelligence and machine learning, they provide automated signals based on particular commands or occurrences within a dataset. For example, if you’re monitoring supply chain KPIs , you could set an intelligent alarm to trigger when invalid or low-quality data appears. By doing so, you will be able to drill down deep into the issue and fix it swiftly and effectively.
In the following picture, you can see how the intelligent alarms from datapine work. By setting up ranges on daily orders, sessions, and revenues, the alarms will notify you if the goal was not completed or if it exceeded expectations.

7. Time series analysis
As its name suggests, time series analysis is used to analyze a set of data points collected over a specified period of time. Although analysts use this method to monitor the data points in a specific interval of time rather than just monitoring them intermittently, the time series analysis is not uniquely used for the purpose of collecting data over time. Instead, it allows researchers to understand if variables changed during the duration of the study, how the different variables are dependent, and how did it reach the end result.
In a business context, this method is used to understand the causes of different trends and patterns to extract valuable insights. Another way of using this method is with the help of time series forecasting. Powered by predictive technologies, businesses can analyze various data sets over a period of time and forecast different future events.
A great use case to put time series analysis into perspective is seasonality effects on sales. By using time series forecasting to analyze sales data of a specific product over time, you can understand if sales rise over a specific period of time (e.g. swimwear during summertime, or candy during Halloween). These insights allow you to predict demand and prepare production accordingly.
8. Decision Trees
The decision tree analysis aims to act as a support tool to make smart and strategic decisions. By visually displaying potential outcomes, consequences, and costs in a tree-like model, researchers and company users can easily evaluate all factors involved and choose the best course of action. Decision trees are helpful to analyze quantitative data and they allow for an improved decision-making process by helping you spot improvement opportunities, reduce costs, and enhance operational efficiency and production.
But how does a decision tree actually works? This method works like a flowchart that starts with the main decision that you need to make and branches out based on the different outcomes and consequences of each decision. Each outcome will outline its own consequences, costs, and gains and, at the end of the analysis, you can compare each of them and make the smartest decision.
Businesses can use them to understand which project is more cost-effective and will bring more earnings in the long run. For example, imagine you need to decide if you want to update your software app or build a new app entirely. Here you would compare the total costs, the time needed to be invested, potential revenue, and any other factor that might affect your decision. In the end, you would be able to see which of these two options is more realistic and attainable for your company or research.
9. Conjoint analysis
Last but not least, we have the conjoint analysis. This approach is usually used in surveys to understand how individuals value different attributes of a product or service and it is one of the most effective methods to extract consumer preferences. When it comes to purchasing, some clients might be more price-focused, others more features-focused, and others might have a sustainable focus. Whatever your customer's preferences are, you can find them with conjoint analysis. Through this, companies can define pricing strategies, packaging options, subscription packages, and more.
A great example of conjoint analysis is in marketing and sales. For instance, a cupcake brand might use conjoint analysis and find that its clients prefer gluten-free options and cupcakes with healthier toppings over super sugary ones. Thus, the cupcake brand can turn these insights into advertisements and promotions to increase sales of this particular type of product. And not just that, conjoint analysis can also help businesses segment their customers based on their interests. This allows them to send different messaging that will bring value to each of the segments.
10. Correspondence Analysis
Also known as reciprocal averaging, correspondence analysis is a method used to analyze the relationship between categorical variables presented within a contingency table. A contingency table is a table that displays two (simple correspondence analysis) or more (multiple correspondence analysis) categorical variables across rows and columns that show the distribution of the data, which is usually answers to a survey or questionnaire on a specific topic.
This method starts by calculating an “expected value” which is done by multiplying row and column averages and dividing it by the overall original value of the specific table cell. The “expected value” is then subtracted from the original value resulting in a “residual number” which is what allows you to extract conclusions about relationships and distribution. The results of this analysis are later displayed using a map that represents the relationship between the different values. The closest two values are in the map, the bigger the relationship. Let’s put it into perspective with an example.
Imagine you are carrying out a market research analysis about outdoor clothing brands and how they are perceived by the public. For this analysis, you ask a group of people to match each brand with a certain attribute which can be durability, innovation, quality materials, etc. When calculating the residual numbers, you can see that brand A has a positive residual for innovation but a negative one for durability. This means that brand A is not positioned as a durable brand in the market, something that competitors could take advantage of.
11. Multidimensional Scaling (MDS)
MDS is a method used to observe the similarities or disparities between objects which can be colors, brands, people, geographical coordinates, and more. The objects are plotted using an “MDS map” that positions similar objects together and disparate ones far apart. The (dis) similarities between objects are represented using one or more dimensions that can be observed using a numerical scale. For example, if you want to know how people feel about the COVID-19 vaccine, you can use 1 for “don’t believe in the vaccine at all” and 10 for “firmly believe in the vaccine” and a scale of 2 to 9 for in between responses. When analyzing an MDS map the only thing that matters is the distance between the objects, the orientation of the dimensions is arbitrary and has no meaning at all.
Multidimensional scaling is a valuable technique for market research, especially when it comes to evaluating product or brand positioning. For instance, if a cupcake brand wants to know how they are positioned compared to competitors, it can define 2-3 dimensions such as taste, ingredients, shopping experience, or more, and do a multidimensional scaling analysis to find improvement opportunities as well as areas in which competitors are currently leading.
Another business example is in procurement when deciding on different suppliers. Decision makers can generate an MDS map to see how the different prices, delivery times, technical services, and more of the different suppliers differ and pick the one that suits their needs the best.
A final example proposed by a research paper on "An Improved Study of Multilevel Semantic Network Visualization for Analyzing Sentiment Word of Movie Review Data". Researchers picked a two-dimensional MDS map to display the distances and relationships between different sentiments in movie reviews. They used 36 sentiment words and distributed them based on their emotional distance as we can see in the image below where the words "outraged" and "sweet" are on opposite sides of the map, marking the distance between the two emotions very clearly.

Aside from being a valuable technique to analyze dissimilarities, MDS also serves as a dimension-reduction technique for large dimensional data.
B. Qualitative Methods
Qualitative data analysis methods are defined as the observation of non-numerical data that is gathered and produced using methods of observation such as interviews, focus groups, questionnaires, and more. As opposed to quantitative methods, qualitative data is more subjective and highly valuable in analyzing customer retention and product development.
12. Text analysis
Text analysis, also known in the industry as text mining, works by taking large sets of textual data and arranging them in a way that makes it easier to manage. By working through this cleansing process in stringent detail, you will be able to extract the data that is truly relevant to your organization and use it to develop actionable insights that will propel you forward.
Modern software accelerate the application of text analytics. Thanks to the combination of machine learning and intelligent algorithms, you can perform advanced analytical processes such as sentiment analysis. This technique allows you to understand the intentions and emotions of a text, for example, if it's positive, negative, or neutral, and then give it a score depending on certain factors and categories that are relevant to your brand. Sentiment analysis is often used to monitor brand and product reputation and to understand how successful your customer experience is. To learn more about the topic check out this insightful article .
By analyzing data from various word-based sources, including product reviews, articles, social media communications, and survey responses, you will gain invaluable insights into your audience, as well as their needs, preferences, and pain points. This will allow you to create campaigns, services, and communications that meet your prospects’ needs on a personal level, growing your audience while boosting customer retention. There are various other “sub-methods” that are an extension of text analysis. Each of them serves a more specific purpose and we will look at them in detail next.
13. Content Analysis
This is a straightforward and very popular method that examines the presence and frequency of certain words, concepts, and subjects in different content formats such as text, image, audio, or video. For example, the number of times the name of a celebrity is mentioned on social media or online tabloids. It does this by coding text data that is later categorized and tabulated in a way that can provide valuable insights, making it the perfect mix of quantitative and qualitative analysis.
There are two types of content analysis. The first one is the conceptual analysis which focuses on explicit data, for instance, the number of times a concept or word is mentioned in a piece of content. The second one is relational analysis, which focuses on the relationship between different concepts or words and how they are connected within a specific context.
Content analysis is often used by marketers to measure brand reputation and customer behavior. For example, by analyzing customer reviews. It can also be used to analyze customer interviews and find directions for new product development. It is also important to note, that in order to extract the maximum potential out of this analysis method, it is necessary to have a clearly defined research question.
14. Thematic Analysis
Very similar to content analysis, thematic analysis also helps in identifying and interpreting patterns in qualitative data with the main difference being that the first one can also be applied to quantitative analysis. The thematic method analyzes large pieces of text data such as focus group transcripts or interviews and groups them into themes or categories that come up frequently within the text. It is a great method when trying to figure out peoples view’s and opinions about a certain topic. For example, if you are a brand that cares about sustainability, you can do a survey of your customers to analyze their views and opinions about sustainability and how they apply it to their lives. You can also analyze customer service calls transcripts to find common issues and improve your service.
Thematic analysis is a very subjective technique that relies on the researcher’s judgment. Therefore, to avoid biases, it has 6 steps that include familiarization, coding, generating themes, reviewing themes, defining and naming themes, and writing up. It is also important to note that, because it is a flexible approach, the data can be interpreted in multiple ways and it can be hard to select what data is more important to emphasize.
15. Narrative Analysis
A bit more complex in nature than the two previous ones, narrative analysis is used to explore the meaning behind the stories that people tell and most importantly, how they tell them. By looking into the words that people use to describe a situation you can extract valuable conclusions about their perspective on a specific topic. Common sources for narrative data include autobiographies, family stories, opinion pieces, and testimonials, among others.
From a business perspective, narrative analysis can be useful to analyze customer behaviors and feelings towards a specific product, service, feature, or others. It provides unique and deep insights that can be extremely valuable. However, it has some drawbacks.
The biggest weakness of this method is that the sample sizes are usually very small due to the complexity and time-consuming nature of the collection of narrative data. Plus, the way a subject tells a story will be significantly influenced by his or her specific experiences, making it very hard to replicate in a subsequent study.
16. Discourse Analysis
Discourse analysis is used to understand the meaning behind any type of written, verbal, or symbolic discourse based on its political, social, or cultural context. It mixes the analysis of languages and situations together. This means that the way the content is constructed and the meaning behind it is significantly influenced by the culture and society it takes place in. For example, if you are analyzing political speeches you need to consider different context elements such as the politician's background, the current political context of the country, the audience to which the speech is directed, and so on.
From a business point of view, discourse analysis is a great market research tool. It allows marketers to understand how the norms and ideas of the specific market work and how their customers relate to those ideas. It can be very useful to build a brand mission or develop a unique tone of voice.
17. Grounded Theory Analysis
Traditionally, researchers decide on a method and hypothesis and start to collect the data to prove that hypothesis. The grounded theory is the only method that doesn’t require an initial research question or hypothesis as its value lies in the generation of new theories. With the grounded theory method, you can go into the analysis process with an open mind and explore the data to generate new theories through tests and revisions. In fact, it is not necessary to collect the data and then start to analyze it. Researchers usually start to find valuable insights as they are gathering the data.
All of these elements make grounded theory a very valuable method as theories are fully backed by data instead of initial assumptions. It is a great technique to analyze poorly researched topics or find the causes behind specific company outcomes. For example, product managers and marketers might use the grounded theory to find the causes of high levels of customer churn and look into customer surveys and reviews to develop new theories about the causes.
How To Analyze Data? Top 17 Data Analysis Techniques To Apply

Now that we’ve answered the questions “what is data analysis’”, why is it important, and covered the different data analysis types, it’s time to dig deeper into how to perform your analysis by working through these 17 essential techniques.
1. Collaborate your needs
Before you begin analyzing or drilling down into any techniques, it’s crucial to sit down collaboratively with all key stakeholders within your organization, decide on your primary campaign or strategic goals, and gain a fundamental understanding of the types of insights that will best benefit your progress or provide you with the level of vision you need to evolve your organization.
2. Establish your questions
Once you’ve outlined your core objectives, you should consider which questions will need answering to help you achieve your mission. This is one of the most important techniques as it will shape the very foundations of your success.
To help you ask the right things and ensure your data works for you, you have to ask the right data analysis questions .
3. Data democratization
After giving your data analytics methodology some real direction, and knowing which questions need answering to extract optimum value from the information available to your organization, you should continue with democratization.
Data democratization is an action that aims to connect data from various sources efficiently and quickly so that anyone in your organization can access it at any given moment. You can extract data in text, images, videos, numbers, or any other format. And then perform cross-database analysis to achieve more advanced insights to share with the rest of the company interactively.
Once you have decided on your most valuable sources, you need to take all of this into a structured format to start collecting your insights. For this purpose, datapine offers an easy all-in-one data connectors feature to integrate all your internal and external sources and manage them at your will. Additionally, datapine’s end-to-end solution automatically updates your data, allowing you to save time and focus on performing the right analysis to grow your company.

4. Think of governance
When collecting data in a business or research context you always need to think about security and privacy. With data breaches becoming a topic of concern for businesses, the need to protect your client's or subject’s sensitive information becomes critical.
To ensure that all this is taken care of, you need to think of a data governance strategy. According to Gartner , this concept refers to “ the specification of decision rights and an accountability framework to ensure the appropriate behavior in the valuation, creation, consumption, and control of data and analytics .” In simpler words, data governance is a collection of processes, roles, and policies, that ensure the efficient use of data while still achieving the main company goals. It ensures that clear roles are in place for who can access the information and how they can access it. In time, this not only ensures that sensitive information is protected but also allows for an efficient analysis as a whole.
5. Clean your data
After harvesting from so many sources you will be left with a vast amount of information that can be overwhelming to deal with. At the same time, you can be faced with incorrect data that can be misleading to your analysis. The smartest thing you can do to avoid dealing with this in the future is to clean the data. This is fundamental before visualizing it, as it will ensure that the insights you extract from it are correct.
There are many things that you need to look for in the cleaning process. The most important one is to eliminate any duplicate observations; this usually appears when using multiple internal and external sources of information. You can also add any missing codes, fix empty fields, and eliminate incorrectly formatted data.
Another usual form of cleaning is done with text data. As we mentioned earlier, most companies today analyze customer reviews, social media comments, questionnaires, and several other text inputs. In order for algorithms to detect patterns, text data needs to be revised to avoid invalid characters or any syntax or spelling errors.
Most importantly, the aim of cleaning is to prevent you from arriving at false conclusions that can damage your company in the long run. By using clean data, you will also help BI solutions to interact better with your information and create better reports for your organization.
6. Set your KPIs
Once you’ve set your sources, cleaned your data, and established clear-cut questions you want your insights to answer, you need to set a host of key performance indicators (KPIs) that will help you track, measure, and shape your progress in a number of key areas.
KPIs are critical to both qualitative and quantitative analysis research. This is one of the primary methods of data analysis you certainly shouldn’t overlook.
To help you set the best possible KPIs for your initiatives and activities, here is an example of a relevant logistics KPI : transportation-related costs. If you want to see more go explore our collection of key performance indicator examples .

7. Omit useless data
Having bestowed your data analysis tools and techniques with true purpose and defined your mission, you should explore the raw data you’ve collected from all sources and use your KPIs as a reference for chopping out any information you deem to be useless.
Trimming the informational fat is one of the most crucial methods of analysis as it will allow you to focus your analytical efforts and squeeze every drop of value from the remaining ‘lean’ information.
Any stats, facts, figures, or metrics that don’t align with your business goals or fit with your KPI management strategies should be eliminated from the equation.
8. Build a data management roadmap
While, at this point, this particular step is optional (you will have already gained a wealth of insight and formed a fairly sound strategy by now), creating a data governance roadmap will help your data analysis methods and techniques become successful on a more sustainable basis. These roadmaps, if developed properly, are also built so they can be tweaked and scaled over time.
Invest ample time in developing a roadmap that will help you store, manage, and handle your data internally, and you will make your analysis techniques all the more fluid and functional – one of the most powerful types of data analysis methods available today.
9. Integrate technology
There are many ways to analyze data, but one of the most vital aspects of analytical success in a business context is integrating the right decision support software and technology.
Robust analysis platforms will not only allow you to pull critical data from your most valuable sources while working with dynamic KPIs that will offer you actionable insights; it will also present them in a digestible, visual, interactive format from one central, live dashboard . A data methodology you can count on.
By integrating the right technology within your data analysis methodology, you’ll avoid fragmenting your insights, saving you time and effort while allowing you to enjoy the maximum value from your business’s most valuable insights.
For a look at the power of software for the purpose of analysis and to enhance your methods of analyzing, glance over our selection of dashboard examples .
10. Answer your questions
By considering each of the above efforts, working with the right technology, and fostering a cohesive internal culture where everyone buys into the different ways to analyze data as well as the power of digital intelligence, you will swiftly start to answer your most burning business questions. Arguably, the best way to make your data concepts accessible across the organization is through data visualization.
11. Visualize your data
Online data visualization is a powerful tool as it lets you tell a story with your metrics, allowing users across the organization to extract meaningful insights that aid business evolution – and it covers all the different ways to analyze data.
The purpose of analyzing is to make your entire organization more informed and intelligent, and with the right platform or dashboard, this is simpler than you think, as demonstrated by our marketing dashboard .

This visual, dynamic, and interactive online dashboard is a data analysis example designed to give Chief Marketing Officers (CMO) an overview of relevant metrics to help them understand if they achieved their monthly goals.
In detail, this example generated with a modern dashboard creator displays interactive charts for monthly revenues, costs, net income, and net income per customer; all of them are compared with the previous month so that you can understand how the data fluctuated. In addition, it shows a detailed summary of the number of users, customers, SQLs, and MQLs per month to visualize the whole picture and extract relevant insights or trends for your marketing reports .
The CMO dashboard is perfect for c-level management as it can help them monitor the strategic outcome of their marketing efforts and make data-driven decisions that can benefit the company exponentially.
12. Be careful with the interpretation
We already dedicated an entire post to data interpretation as it is a fundamental part of the process of data analysis. It gives meaning to the analytical information and aims to drive a concise conclusion from the analysis results. Since most of the time companies are dealing with data from many different sources, the interpretation stage needs to be done carefully and properly in order to avoid misinterpretations.
To help you through the process, here we list three common practices that you need to avoid at all costs when looking at your data:
- Correlation vs. causation: The human brain is formatted to find patterns. This behavior leads to one of the most common mistakes when performing interpretation: confusing correlation with causation. Although these two aspects can exist simultaneously, it is not correct to assume that because two things happened together, one provoked the other. A piece of advice to avoid falling into this mistake is never to trust just intuition, trust the data. If there is no objective evidence of causation, then always stick to correlation.
- Confirmation bias: This phenomenon describes the tendency to select and interpret only the data necessary to prove one hypothesis, often ignoring the elements that might disprove it. Even if it's not done on purpose, confirmation bias can represent a real problem, as excluding relevant information can lead to false conclusions and, therefore, bad business decisions. To avoid it, always try to disprove your hypothesis instead of proving it, share your analysis with other team members, and avoid drawing any conclusions before the entire analytical project is finalized.
- Statistical significance: To put it in short words, statistical significance helps analysts understand if a result is actually accurate or if it happened because of a sampling error or pure chance. The level of statistical significance needed might depend on the sample size and the industry being analyzed. In any case, ignoring the significance of a result when it might influence decision-making can be a huge mistake.
13. Build a narrative
Now, we’re going to look at how you can bring all of these elements together in a way that will benefit your business - starting with a little something called data storytelling.
The human brain responds incredibly well to strong stories or narratives. Once you’ve cleansed, shaped, and visualized your most invaluable data using various BI dashboard tools , you should strive to tell a story - one with a clear-cut beginning, middle, and end.
By doing so, you will make your analytical efforts more accessible, digestible, and universal, empowering more people within your organization to use your discoveries to their actionable advantage.
14. Consider autonomous technology
Autonomous technologies, such as artificial intelligence (AI) and machine learning (ML), play a significant role in the advancement of understanding how to analyze data more effectively.
Gartner predicts that by the end of this year, 80% of emerging technologies will be developed with AI foundations. This is a testament to the ever-growing power and value of autonomous technologies.
At the moment, these technologies are revolutionizing the analysis industry. Some examples that we mentioned earlier are neural networks, intelligent alarms, and sentiment analysis.
15. Share the load
If you work with the right tools and dashboards, you will be able to present your metrics in a digestible, value-driven format, allowing almost everyone in the organization to connect with and use relevant data to their advantage.
Modern dashboards consolidate data from various sources, providing access to a wealth of insights in one centralized location, no matter if you need to monitor recruitment metrics or generate reports that need to be sent across numerous departments. Moreover, these cutting-edge tools offer access to dashboards from a multitude of devices, meaning that everyone within the business can connect with practical insights remotely - and share the load.
Once everyone is able to work with a data-driven mindset, you will catalyze the success of your business in ways you never thought possible. And when it comes to knowing how to analyze data, this kind of collaborative approach is essential.
16. Data analysis tools
In order to perform high-quality analysis of data, it is fundamental to use tools and software that will ensure the best results. Here we leave you a small summary of four fundamental categories of data analysis tools for your organization.
- Business Intelligence: BI tools allow you to process significant amounts of data from several sources in any format. Through this, you can not only analyze and monitor your data to extract relevant insights but also create interactive reports and dashboards to visualize your KPIs and use them for your company's good. datapine is an amazing online BI software that is focused on delivering powerful online analysis features that are accessible to beginner and advanced users. Like this, it offers a full-service solution that includes cutting-edge analysis of data, KPIs visualization, live dashboards, reporting, and artificial intelligence technologies to predict trends and minimize risk.
- Statistical analysis: These tools are usually designed for scientists, statisticians, market researchers, and mathematicians, as they allow them to perform complex statistical analyses with methods like regression analysis, predictive analysis, and statistical modeling. A good tool to perform this type of analysis is R-Studio as it offers a powerful data modeling and hypothesis testing feature that can cover both academic and general data analysis. This tool is one of the favorite ones in the industry, due to its capability for data cleaning, data reduction, and performing advanced analysis with several statistical methods. Another relevant tool to mention is SPSS from IBM. The software offers advanced statistical analysis for users of all skill levels. Thanks to a vast library of machine learning algorithms, text analysis, and a hypothesis testing approach it can help your company find relevant insights to drive better decisions. SPSS also works as a cloud service that enables you to run it anywhere.
- SQL Consoles: SQL is a programming language often used to handle structured data in relational databases. Tools like these are popular among data scientists as they are extremely effective in unlocking these databases' value. Undoubtedly, one of the most used SQL software in the market is MySQL Workbench . This tool offers several features such as a visual tool for database modeling and monitoring, complete SQL optimization, administration tools, and visual performance dashboards to keep track of KPIs.
- Data Visualization: These tools are used to represent your data through charts, graphs, and maps that allow you to find patterns and trends in the data. datapine's already mentioned BI platform also offers a wealth of powerful online data visualization tools with several benefits. Some of them include: delivering compelling data-driven presentations to share with your entire company, the ability to see your data online with any device wherever you are, an interactive dashboard design feature that enables you to showcase your results in an interactive and understandable way, and to perform online self-service reports that can be used simultaneously with several other people to enhance team productivity.
17. Refine your process constantly
Last is a step that might seem obvious to some people, but it can be easily ignored if you think you are done. Once you have extracted the needed results, you should always take a retrospective look at your project and think about what you can improve. As you saw throughout this long list of techniques, data analysis is a complex process that requires constant refinement. For this reason, you should always go one step further and keep improving.
Quality Criteria For Data Analysis
So far we’ve covered a list of methods and techniques that should help you perform efficient data analysis. But how do you measure the quality and validity of your results? This is done with the help of some science quality criteria. Here we will go into a more theoretical area that is critical to understanding the fundamentals of statistical analysis in science. However, you should also be aware of these steps in a business context, as they will allow you to assess the quality of your results in the correct way. Let’s dig in.
- Internal validity: The results of a survey are internally valid if they measure what they are supposed to measure and thus provide credible results. In other words , internal validity measures the trustworthiness of the results and how they can be affected by factors such as the research design, operational definitions, how the variables are measured, and more. For instance, imagine you are doing an interview to ask people if they brush their teeth two times a day. While most of them will answer yes, you can still notice that their answers correspond to what is socially acceptable, which is to brush your teeth at least twice a day. In this case, you can’t be 100% sure if respondents actually brush their teeth twice a day or if they just say that they do, therefore, the internal validity of this interview is very low.
- External validity: Essentially, external validity refers to the extent to which the results of your research can be applied to a broader context. It basically aims to prove that the findings of a study can be applied in the real world. If the research can be applied to other settings, individuals, and times, then the external validity is high.
- Reliability : If your research is reliable, it means that it can be reproduced. If your measurement were repeated under the same conditions, it would produce similar results. This means that your measuring instrument consistently produces reliable results. For example, imagine a doctor building a symptoms questionnaire to detect a specific disease in a patient. Then, various other doctors use this questionnaire but end up diagnosing the same patient with a different condition. This means the questionnaire is not reliable in detecting the initial disease. Another important note here is that in order for your research to be reliable, it also needs to be objective. If the results of a study are the same, independent of who assesses them or interprets them, the study can be considered reliable. Let’s see the objectivity criteria in more detail now.
- Objectivity: In data science, objectivity means that the researcher needs to stay fully objective when it comes to its analysis. The results of a study need to be affected by objective criteria and not by the beliefs, personality, or values of the researcher. Objectivity needs to be ensured when you are gathering the data, for example, when interviewing individuals, the questions need to be asked in a way that doesn't influence the results. Paired with this, objectivity also needs to be thought of when interpreting the data. If different researchers reach the same conclusions, then the study is objective. For this last point, you can set predefined criteria to interpret the results to ensure all researchers follow the same steps.
The discussed quality criteria cover mostly potential influences in a quantitative context. Analysis in qualitative research has by default additional subjective influences that must be controlled in a different way. Therefore, there are other quality criteria for this kind of research such as credibility, transferability, dependability, and confirmability. You can see each of them more in detail on this resource .
Data Analysis Limitations & Barriers
Analyzing data is not an easy task. As you’ve seen throughout this post, there are many steps and techniques that you need to apply in order to extract useful information from your research. While a well-performed analysis can bring various benefits to your organization it doesn't come without limitations. In this section, we will discuss some of the main barriers you might encounter when conducting an analysis. Let’s see them more in detail.
- Lack of clear goals: No matter how good your data or analysis might be if you don’t have clear goals or a hypothesis the process might be worthless. While we mentioned some methods that don’t require a predefined hypothesis, it is always better to enter the analytical process with some clear guidelines of what you are expecting to get out of it, especially in a business context in which data is utilized to support important strategic decisions.
- Objectivity: Arguably one of the biggest barriers when it comes to data analysis in research is to stay objective. When trying to prove a hypothesis, researchers might find themselves, intentionally or unintentionally, directing the results toward an outcome that they want. To avoid this, always question your assumptions and avoid confusing facts with opinions. You can also show your findings to a research partner or external person to confirm that your results are objective.
- Data representation: A fundamental part of the analytical procedure is the way you represent your data. You can use various graphs and charts to represent your findings, but not all of them will work for all purposes. Choosing the wrong visual can not only damage your analysis but can mislead your audience, therefore, it is important to understand when to use each type of data depending on your analytical goals. Our complete guide on the types of graphs and charts lists 20 different visuals with examples of when to use them.
- Flawed correlation : Misleading statistics can significantly damage your research. We’ve already pointed out a few interpretation issues previously in the post, but it is an important barrier that we can't avoid addressing here as well. Flawed correlations occur when two variables appear related to each other but they are not. Confusing correlations with causation can lead to a wrong interpretation of results which can lead to building wrong strategies and loss of resources, therefore, it is very important to identify the different interpretation mistakes and avoid them.
- Sample size: A very common barrier to a reliable and efficient analysis process is the sample size. In order for the results to be trustworthy, the sample size should be representative of what you are analyzing. For example, imagine you have a company of 1000 employees and you ask the question “do you like working here?” to 50 employees of which 49 say yes, which means 95%. Now, imagine you ask the same question to the 1000 employees and 950 say yes, which also means 95%. Saying that 95% of employees like working in the company when the sample size was only 50 is not a representative or trustworthy conclusion. The significance of the results is way more accurate when surveying a bigger sample size.
- Privacy concerns: In some cases, data collection can be subjected to privacy regulations. Businesses gather all kinds of information from their customers from purchasing behaviors to addresses and phone numbers. If this falls into the wrong hands due to a breach, it can affect the security and confidentiality of your clients. To avoid this issue, you need to collect only the data that is needed for your research and, if you are using sensitive facts, make it anonymous so customers are protected. The misuse of customer data can severely damage a business's reputation, so it is important to keep an eye on privacy.
- Lack of communication between teams : When it comes to performing data analysis on a business level, it is very likely that each department and team will have different goals and strategies. However, they are all working for the same common goal of helping the business run smoothly and keep growing. When teams are not connected and communicating with each other, it can directly affect the way general strategies are built. To avoid these issues, tools such as data dashboards enable teams to stay connected through data in a visually appealing way.
- Innumeracy : Businesses are working with data more and more every day. While there are many BI tools available to perform effective analysis, data literacy is still a constant barrier. Not all employees know how to apply analysis techniques or extract insights from them. To prevent this from happening, you can implement different training opportunities that will prepare every relevant user to deal with data.
Key Data Analysis Skills
As you've learned throughout this lengthy guide, analyzing data is a complex task that requires a lot of knowledge and skills. That said, thanks to the rise of self-service tools the process is way more accessible and agile than it once was. Regardless, there are still some key skills that are valuable to have when working with data, we list the most important ones below.
- Critical and statistical thinking: To successfully analyze data you need to be creative and think out of the box. Yes, that might sound like a weird statement considering that data is often tight to facts. However, a great level of critical thinking is required to uncover connections, come up with a valuable hypothesis, and extract conclusions that go a step further from the surface. This, of course, needs to be complemented by statistical thinking and an understanding of numbers.
- Data cleaning: Anyone who has ever worked with data before will tell you that the cleaning and preparation process accounts for 80% of a data analyst's work, therefore, the skill is fundamental. But not just that, not cleaning the data adequately can also significantly damage the analysis which can lead to poor decision-making in a business scenario. While there are multiple tools that automate the cleaning process and eliminate the possibility of human error, it is still a valuable skill to dominate.
- Data visualization: Visuals make the information easier to understand and analyze, not only for professional users but especially for non-technical ones. Having the necessary skills to not only choose the right chart type but know when to apply it correctly is key. This also means being able to design visually compelling charts that make the data exploration process more efficient.
- SQL: The Structured Query Language or SQL is a programming language used to communicate with databases. It is fundamental knowledge as it enables you to update, manipulate, and organize data from relational databases which are the most common databases used by companies. It is fairly easy to learn and one of the most valuable skills when it comes to data analysis.
- Communication skills: This is a skill that is especially valuable in a business environment. Being able to clearly communicate analytical outcomes to colleagues is incredibly important, especially when the information you are trying to convey is complex for non-technical people. This applies to in-person communication as well as written format, for example, when generating a dashboard or report. While this might be considered a “soft” skill compared to the other ones we mentioned, it should not be ignored as you most likely will need to share analytical findings with others no matter the context.
Data Analysis In The Big Data Environment
Big data is invaluable to today’s businesses, and by using different methods for data analysis, it’s possible to view your data in a way that can help you turn insight into positive action.
To inspire your efforts and put the importance of big data into context, here are some insights that you should know:
- By 2026 the industry of big data is expected to be worth approximately $273.4 billion.
- 94% of enterprises say that analyzing data is important for their growth and digital transformation.
- Companies that exploit the full potential of their data can increase their operating margins by 60% .
- We already told you the benefits of Artificial Intelligence through this article. This industry's financial impact is expected to grow up to $40 billion by 2025.
Data analysis concepts may come in many forms, but fundamentally, any solid methodology will help to make your business more streamlined, cohesive, insightful, and successful than ever before.
Key Takeaways From Data Analysis
As we reach the end of our data analysis journey, we leave a small summary of the main methods and techniques to perform excellent analysis and grow your business.
17 Essential Types of Data Analysis Methods:
- Cluster analysis
- Cohort analysis
- Regression analysis
- Factor analysis
- Neural Networks
- Data Mining
- Text analysis
- Time series analysis
- Decision trees
- Conjoint analysis
- Correspondence Analysis
- Multidimensional Scaling
- Content analysis
- Thematic analysis
- Narrative analysis
- Grounded theory analysis
- Discourse analysis
Top 17 Data Analysis Techniques:
- Collaborate your needs
- Establish your questions
- Data democratization
- Think of data governance
- Clean your data
- Set your KPIs
- Omit useless data
- Build a data management roadmap
- Integrate technology
- Answer your questions
- Visualize your data
- Interpretation of data
- Consider autonomous technology
- Build a narrative
- Share the load
- Data Analysis tools
- Refine your process constantly
We’ve pondered the data analysis definition and drilled down into the practical applications of data-centric analytics, and one thing is clear: by taking measures to arrange your data and making your metrics work for you, it’s possible to transform raw information into action - the kind of that will push your business to the next level.
Yes, good data analytics techniques result in enhanced business intelligence (BI). To help you understand this notion in more detail, read our exploration of business intelligence reporting .
And, if you’re ready to perform your own analysis, drill down into your facts and figures while interacting with your data on astonishing visuals, you can try our software for a free, 14-day trial .
- Skip to main content
- Skip to primary sidebar
- Skip to footer
- QuestionPro

- Solutions Industries Gaming Automotive Sports and events Education Government Travel & Hospitality Financial Services Healthcare Cannabis Technology Use Case NPS+ Communities Audience Contactless surveys Mobile LivePolls Member Experience GDPR Positive People Science 360 Feedback Surveys
- Resources Blog eBooks Survey Templates Case Studies Training Help center
Home Market Research
Data Analysis in Research: Types & Methods

Content Index
Why analyze data in research?
Types of data in research, finding patterns in the qualitative data, methods used for data analysis in qualitative research, preparing data for analysis, methods used for data analysis in quantitative research, considerations in research data analysis, what is data analysis in research.
Definition of research in data analysis: According to LeCompte and Schensul, research data analysis is a process used by researchers to reduce data to a story and interpret it to derive insights. The data analysis process helps reduce a large chunk of data into smaller fragments, which makes sense.
Three essential things occur during the data analysis process — the first is data organization . Summarization and categorization together contribute to becoming the second known method used for data reduction. It helps find patterns and themes in the data for easy identification and linking. The third and last way is data analysis – researchers do it in both top-down and bottom-up fashion.
LEARN ABOUT: Research Process Steps
On the other hand, Marshall and Rossman describe data analysis as a messy, ambiguous, and time-consuming but creative and fascinating process through which a mass of collected data is brought to order, structure and meaning.
We can say that “the data analysis and data interpretation is a process representing the application of deductive and inductive logic to the research and data analysis.”
Researchers rely heavily on data as they have a story to tell or research problems to solve. It starts with a question, and data is nothing but an answer to that question. But, what if there is no question to ask? Well! It is possible to explore data even without a problem – we call it ‘Data Mining’, which often reveals some interesting patterns within the data that are worth exploring.
Irrelevant to the type of data researchers explore, their mission and audiences’ vision guide them to find the patterns to shape the story they want to tell. One of the essential things expected from researchers while analyzing data is to stay open and remain unbiased toward unexpected patterns, expressions, and results. Remember, sometimes, data analysis tells the most unforeseen yet exciting stories that were not expected when initiating data analysis. Therefore, rely on the data you have at hand and enjoy the journey of exploratory research.
Create a Free Account
Every kind of data has a rare quality of describing things after assigning a specific value to it. For analysis, you need to organize these values, processed and presented in a given context, to make it useful. Data can be in different forms; here are the primary data types.
- Qualitative data: When the data presented has words and descriptions, then we call it qualitative data . Although you can observe this data, it is subjective and harder to analyze data in research, especially for comparison. Example: Quality data represents everything describing taste, experience, texture, or an opinion that is considered quality data. This type of data is usually collected through focus groups, personal qualitative interviews , qualitative observation or using open-ended questions in surveys.
- Quantitative data: Any data expressed in numbers of numerical figures are called quantitative data . This type of data can be distinguished into categories, grouped, measured, calculated, or ranked. Example: questions such as age, rank, cost, length, weight, scores, etc. everything comes under this type of data. You can present such data in graphical format, charts, or apply statistical analysis methods to this data. The (Outcomes Measurement Systems) OMS questionnaires in surveys are a significant source of collecting numeric data.
- Categorical data: It is data presented in groups. However, an item included in the categorical data cannot belong to more than one group. Example: A person responding to a survey by telling his living style, marital status, smoking habit, or drinking habit comes under the categorical data. A chi-square test is a standard method used to analyze this data.
Learn More : Examples of Qualitative Data in Education
Data analysis in qualitative research
Data analysis and qualitative data research work a little differently from the numerical data as the quality data is made up of words, descriptions, images, objects, and sometimes symbols. Getting insight from such complicated information is a complicated process. Hence it is typically used for exploratory research and data analysis .
Although there are several ways to find patterns in the textual information, a word-based method is the most relied and widely used global technique for research and data analysis. Notably, the data analysis process in qualitative research is manual. Here the researchers usually read the available data and find repetitive or commonly used words.
For example, while studying data collected from African countries to understand the most pressing issues people face, researchers might find “food” and “hunger” are the most commonly used words and will highlight them for further analysis.
LEARN ABOUT: Level of Analysis
The keyword context is another widely used word-based technique. In this method, the researcher tries to understand the concept by analyzing the context in which the participants use a particular keyword.
For example , researchers conducting research and data analysis for studying the concept of ‘diabetes’ amongst respondents might analyze the context of when and how the respondent has used or referred to the word ‘diabetes.’
The scrutiny-based technique is also one of the highly recommended text analysis methods used to identify a quality data pattern. Compare and contrast is the widely used method under this technique to differentiate how a specific text is similar or different from each other.
For example: To find out the “importance of resident doctor in a company,” the collected data is divided into people who think it is necessary to hire a resident doctor and those who think it is unnecessary. Compare and contrast is the best method that can be used to analyze the polls having single-answer questions types .
Metaphors can be used to reduce the data pile and find patterns in it so that it becomes easier to connect data with theory.
Variable Partitioning is another technique used to split variables so that researchers can find more coherent descriptions and explanations from the enormous data.
LEARN ABOUT: Qualitative Research Questions and Questionnaires
There are several techniques to analyze the data in qualitative research, but here are some commonly used methods,
- Content Analysis: It is widely accepted and the most frequently employed technique for data analysis in research methodology. It can be used to analyze the documented information from text, images, and sometimes from the physical items. It depends on the research questions to predict when and where to use this method.
- Narrative Analysis: This method is used to analyze content gathered from various sources such as personal interviews, field observation, and surveys . The majority of times, stories, or opinions shared by people are focused on finding answers to the research questions.
- Discourse Analysis: Similar to narrative analysis, discourse analysis is used to analyze the interactions with people. Nevertheless, this particular method considers the social context under which or within which the communication between the researcher and respondent takes place. In addition to that, discourse analysis also focuses on the lifestyle and day-to-day environment while deriving any conclusion.
- Grounded Theory: When you want to explain why a particular phenomenon happened, then using grounded theory for analyzing quality data is the best resort. Grounded theory is applied to study data about the host of similar cases occurring in different settings. When researchers are using this method, they might alter explanations or produce new ones until they arrive at some conclusion.
LEARN ABOUT: 12 Best Tools for Researchers
Data analysis in quantitative research
The first stage in research and data analysis is to make it for the analysis so that the nominal data can be converted into something meaningful. Data preparation consists of the below phases.
Phase I: Data Validation
Data validation is done to understand if the collected data sample is per the pre-set standards, or it is a biased data sample again divided into four different stages
- Fraud: To ensure an actual human being records each response to the survey or the questionnaire
- Screening: To make sure each participant or respondent is selected or chosen in compliance with the research criteria
- Procedure: To ensure ethical standards were maintained while collecting the data sample
- Completeness: To ensure that the respondent has answered all the questions in an online survey. Else, the interviewer had asked all the questions devised in the questionnaire.
Phase II: Data Editing
More often, an extensive research data sample comes loaded with errors. Respondents sometimes fill in some fields incorrectly or sometimes skip them accidentally. Data editing is a process wherein the researchers have to confirm that the provided data is free of such errors. They need to conduct necessary checks and outlier checks to edit the raw edit and make it ready for analysis.
Phase III: Data Coding
Out of all three, this is the most critical phase of data preparation associated with grouping and assigning values to the survey responses . If a survey is completed with a 1000 sample size, the researcher will create an age bracket to distinguish the respondents based on their age. Thus, it becomes easier to analyze small data buckets rather than deal with the massive data pile.
LEARN ABOUT: Steps in Qualitative Research
After the data is prepared for analysis, researchers are open to using different research and data analysis methods to derive meaningful insights. For sure, statistical analysis plans are the most favored to analyze numerical data. In statistical analysis, distinguishing between categorical data and numerical data is essential, as categorical data involves distinct categories or labels, while numerical data consists of measurable quantities. The method is again classified into two groups. First, ‘Descriptive Statistics’ used to describe data. Second, ‘Inferential statistics’ that helps in comparing the data .
Descriptive statistics
This method is used to describe the basic features of versatile types of data in research. It presents the data in such a meaningful way that pattern in the data starts making sense. Nevertheless, the descriptive analysis does not go beyond making conclusions. The conclusions are again based on the hypothesis researchers have formulated so far. Here are a few major types of descriptive analysis methods.
Measures of Frequency
- Count, Percent, Frequency
- It is used to denote home often a particular event occurs.
- Researchers use it when they want to showcase how often a response is given.
Measures of Central Tendency
- Mean, Median, Mode
- The method is widely used to demonstrate distribution by various points.
- Researchers use this method when they want to showcase the most commonly or averagely indicated response.
Measures of Dispersion or Variation
- Range, Variance, Standard deviation
- Here the field equals high/low points.
- Variance standard deviation = difference between the observed score and mean
- It is used to identify the spread of scores by stating intervals.
- Researchers use this method to showcase data spread out. It helps them identify the depth until which the data is spread out that it directly affects the mean.
Measures of Position
- Percentile ranks, Quartile ranks
- It relies on standardized scores helping researchers to identify the relationship between different scores.
- It is often used when researchers want to compare scores with the average count.
For quantitative research use of descriptive analysis often give absolute numbers, but the in-depth analysis is never sufficient to demonstrate the rationale behind those numbers. Nevertheless, it is necessary to think of the best method for research and data analysis suiting your survey questionnaire and what story researchers want to tell. For example, the mean is the best way to demonstrate the students’ average scores in schools. It is better to rely on the descriptive statistics when the researchers intend to keep the research or outcome limited to the provided sample without generalizing it. For example, when you want to compare average voting done in two different cities, differential statistics are enough.
Descriptive analysis is also called a ‘univariate analysis’ since it is commonly used to analyze a single variable.
Inferential statistics
Inferential statistics are used to make predictions about a larger population after research and data analysis of the representing population’s collected sample. For example, you can ask some odd 100 audiences at a movie theater if they like the movie they are watching. Researchers then use inferential statistics on the collected sample to reason that about 80-90% of people like the movie.
Here are two significant areas of inferential statistics.
- Estimating parameters: It takes statistics from the sample research data and demonstrates something about the population parameter.
- Hypothesis test: I t’s about sampling research data to answer the survey research questions. For example, researchers might be interested to understand if the new shade of lipstick recently launched is good or not, or if the multivitamin capsules help children to perform better at games.
These are sophisticated analysis methods used to showcase the relationship between different variables instead of describing a single variable. It is often used when researchers want something beyond absolute numbers to understand the relationship between variables.
Here are some of the commonly used methods for data analysis in research.
- Correlation: When researchers are not conducting experimental research or quasi-experimental research wherein the researchers are interested to understand the relationship between two or more variables, they opt for correlational research methods.
- Cross-tabulation: Also called contingency tables, cross-tabulation is used to analyze the relationship between multiple variables. Suppose provided data has age and gender categories presented in rows and columns. A two-dimensional cross-tabulation helps for seamless data analysis and research by showing the number of males and females in each age category.
- Regression analysis: For understanding the strong relationship between two variables, researchers do not look beyond the primary and commonly used regression analysis method, which is also a type of predictive analysis used. In this method, you have an essential factor called the dependent variable. You also have multiple independent variables in regression analysis. You undertake efforts to find out the impact of independent variables on the dependent variable. The values of both independent and dependent variables are assumed as being ascertained in an error-free random manner.
- Frequency tables: The statistical procedure is used for testing the degree to which two or more vary or differ in an experiment. A considerable degree of variation means research findings were significant. In many contexts, ANOVA testing and variance analysis are similar.
- Analysis of variance: The statistical procedure is used for testing the degree to which two or more vary or differ in an experiment. A considerable degree of variation means research findings were significant. In many contexts, ANOVA testing and variance analysis are similar.
- Researchers must have the necessary research skills to analyze and manipulation the data , Getting trained to demonstrate a high standard of research practice. Ideally, researchers must possess more than a basic understanding of the rationale of selecting one statistical method over the other to obtain better data insights.
- Usually, research and data analytics projects differ by scientific discipline; therefore, getting statistical advice at the beginning of analysis helps design a survey questionnaire, select data collection methods , and choose samples.
LEARN ABOUT: Best Data Collection Tools
- The primary aim of data research and analysis is to derive ultimate insights that are unbiased. Any mistake in or keeping a biased mind to collect data, selecting an analysis method, or choosing audience sample il to draw a biased inference.
- Irrelevant to the sophistication used in research data and analysis is enough to rectify the poorly defined objective outcome measurements. It does not matter if the design is at fault or intentions are not clear, but lack of clarity might mislead readers, so avoid the practice.
- The motive behind data analysis in research is to present accurate and reliable data. As far as possible, avoid statistical errors, and find a way to deal with everyday challenges like outliers, missing data, data altering, data mining , or developing graphical representation.
LEARN MORE: Descriptive Research vs Correlational Research The sheer amount of data generated daily is frightening. Especially when data analysis has taken center stage. in 2018. In last year, the total data supply amounted to 2.8 trillion gigabytes. Hence, it is clear that the enterprises willing to survive in the hypercompetitive world must possess an excellent capability to analyze complex research data, derive actionable insights, and adapt to the new market needs.
LEARN ABOUT: Average Order Value
QuestionPro is an online survey platform that empowers organizations in data analysis and research and provides them a medium to collect data by creating appealing surveys.
MORE LIKE THIS

Raked Weighting: A Key Tool for Accurate Survey Results
May 31, 2024

Top 8 Data Trends to Understand the Future of Data
May 30, 2024

Top 12 Interactive Presentation Software to Engage Your User
May 29, 2024

Trend Report: Guide for Market Dynamics & Strategic Analysis
Other categories.
- Academic Research
- Artificial Intelligence
- Assessments
- Brand Awareness
- Case Studies
- Communities
- Consumer Insights
- Customer effort score
- Customer Engagement
- Customer Experience
- Customer Loyalty
- Customer Research
- Customer Satisfaction
- Employee Benefits
- Employee Engagement
- Employee Retention
- Friday Five
- General Data Protection Regulation
- Insights Hub
- Life@QuestionPro
- Market Research
- Mobile diaries
- Mobile Surveys
- New Features
- Online Communities
- Question Types
- Questionnaire
- QuestionPro Products
- Release Notes
- Research Tools and Apps
- Revenue at Risk
- Survey Templates
- Training Tips
- Uncategorized
- Video Learning Series
- What’s Coming Up
- Workforce Intelligence
- Privacy Policy
Home » Data Analysis – Process, Methods and Types
Data Analysis – Process, Methods and Types
Table of Contents

Data Analysis
Definition:
Data analysis refers to the process of inspecting, cleaning, transforming, and modeling data with the goal of discovering useful information, drawing conclusions, and supporting decision-making. It involves applying various statistical and computational techniques to interpret and derive insights from large datasets. The ultimate aim of data analysis is to convert raw data into actionable insights that can inform business decisions, scientific research, and other endeavors.
Data Analysis Process
The following are step-by-step guides to the data analysis process:
Define the Problem
The first step in data analysis is to clearly define the problem or question that needs to be answered. This involves identifying the purpose of the analysis, the data required, and the intended outcome.
Collect the Data
The next step is to collect the relevant data from various sources. This may involve collecting data from surveys, databases, or other sources. It is important to ensure that the data collected is accurate, complete, and relevant to the problem being analyzed.
Clean and Organize the Data
Once the data has been collected, it needs to be cleaned and organized. This involves removing any errors or inconsistencies in the data, filling in missing values, and ensuring that the data is in a format that can be easily analyzed.
Analyze the Data
The next step is to analyze the data using various statistical and analytical techniques. This may involve identifying patterns in the data, conducting statistical tests, or using machine learning algorithms to identify trends and insights.
Interpret the Results
After analyzing the data, the next step is to interpret the results. This involves drawing conclusions based on the analysis and identifying any significant findings or trends.
Communicate the Findings
Once the results have been interpreted, they need to be communicated to stakeholders. This may involve creating reports, visualizations, or presentations to effectively communicate the findings and recommendations.
Take Action
The final step in the data analysis process is to take action based on the findings. This may involve implementing new policies or procedures, making strategic decisions, or taking other actions based on the insights gained from the analysis.
Types of Data Analysis
Types of Data Analysis are as follows:
Descriptive Analysis
This type of analysis involves summarizing and describing the main characteristics of a dataset, such as the mean, median, mode, standard deviation, and range.
Inferential Analysis
This type of analysis involves making inferences about a population based on a sample. Inferential analysis can help determine whether a certain relationship or pattern observed in a sample is likely to be present in the entire population.
Diagnostic Analysis
This type of analysis involves identifying and diagnosing problems or issues within a dataset. Diagnostic analysis can help identify outliers, errors, missing data, or other anomalies in the dataset.
Predictive Analysis
This type of analysis involves using statistical models and algorithms to predict future outcomes or trends based on historical data. Predictive analysis can help businesses and organizations make informed decisions about the future.
Prescriptive Analysis
This type of analysis involves recommending a course of action based on the results of previous analyses. Prescriptive analysis can help organizations make data-driven decisions about how to optimize their operations, products, or services.
Exploratory Analysis
This type of analysis involves exploring the relationships and patterns within a dataset to identify new insights and trends. Exploratory analysis is often used in the early stages of research or data analysis to generate hypotheses and identify areas for further investigation.
Data Analysis Methods
Data Analysis Methods are as follows:
Statistical Analysis
This method involves the use of mathematical models and statistical tools to analyze and interpret data. It includes measures of central tendency, correlation analysis, regression analysis, hypothesis testing, and more.
Machine Learning
This method involves the use of algorithms to identify patterns and relationships in data. It includes supervised and unsupervised learning, classification, clustering, and predictive modeling.
Data Mining
This method involves using statistical and machine learning techniques to extract information and insights from large and complex datasets.
Text Analysis
This method involves using natural language processing (NLP) techniques to analyze and interpret text data. It includes sentiment analysis, topic modeling, and entity recognition.
Network Analysis
This method involves analyzing the relationships and connections between entities in a network, such as social networks or computer networks. It includes social network analysis and graph theory.
Time Series Analysis
This method involves analyzing data collected over time to identify patterns and trends. It includes forecasting, decomposition, and smoothing techniques.
Spatial Analysis
This method involves analyzing geographic data to identify spatial patterns and relationships. It includes spatial statistics, spatial regression, and geospatial data visualization.
Data Visualization
This method involves using graphs, charts, and other visual representations to help communicate the findings of the analysis. It includes scatter plots, bar charts, heat maps, and interactive dashboards.
Qualitative Analysis
This method involves analyzing non-numeric data such as interviews, observations, and open-ended survey responses. It includes thematic analysis, content analysis, and grounded theory.
Multi-criteria Decision Analysis
This method involves analyzing multiple criteria and objectives to support decision-making. It includes techniques such as the analytical hierarchy process, TOPSIS, and ELECTRE.
Data Analysis Tools
There are various data analysis tools available that can help with different aspects of data analysis. Below is a list of some commonly used data analysis tools:
- Microsoft Excel: A widely used spreadsheet program that allows for data organization, analysis, and visualization.
- SQL : A programming language used to manage and manipulate relational databases.
- R : An open-source programming language and software environment for statistical computing and graphics.
- Python : A general-purpose programming language that is widely used in data analysis and machine learning.
- Tableau : A data visualization software that allows for interactive and dynamic visualizations of data.
- SAS : A statistical analysis software used for data management, analysis, and reporting.
- SPSS : A statistical analysis software used for data analysis, reporting, and modeling.
- Matlab : A numerical computing software that is widely used in scientific research and engineering.
- RapidMiner : A data science platform that offers a wide range of data analysis and machine learning tools.
Applications of Data Analysis
Data analysis has numerous applications across various fields. Below are some examples of how data analysis is used in different fields:
- Business : Data analysis is used to gain insights into customer behavior, market trends, and financial performance. This includes customer segmentation, sales forecasting, and market research.
- Healthcare : Data analysis is used to identify patterns and trends in patient data, improve patient outcomes, and optimize healthcare operations. This includes clinical decision support, disease surveillance, and healthcare cost analysis.
- Education : Data analysis is used to measure student performance, evaluate teaching effectiveness, and improve educational programs. This includes assessment analytics, learning analytics, and program evaluation.
- Finance : Data analysis is used to monitor and evaluate financial performance, identify risks, and make investment decisions. This includes risk management, portfolio optimization, and fraud detection.
- Government : Data analysis is used to inform policy-making, improve public services, and enhance public safety. This includes crime analysis, disaster response planning, and social welfare program evaluation.
- Sports : Data analysis is used to gain insights into athlete performance, improve team strategy, and enhance fan engagement. This includes player evaluation, scouting analysis, and game strategy optimization.
- Marketing : Data analysis is used to measure the effectiveness of marketing campaigns, understand customer behavior, and develop targeted marketing strategies. This includes customer segmentation, marketing attribution analysis, and social media analytics.
- Environmental science : Data analysis is used to monitor and evaluate environmental conditions, assess the impact of human activities on the environment, and develop environmental policies. This includes climate modeling, ecological forecasting, and pollution monitoring.
When to Use Data Analysis
Data analysis is useful when you need to extract meaningful insights and information from large and complex datasets. It is a crucial step in the decision-making process, as it helps you understand the underlying patterns and relationships within the data, and identify potential areas for improvement or opportunities for growth.
Here are some specific scenarios where data analysis can be particularly helpful:
- Problem-solving : When you encounter a problem or challenge, data analysis can help you identify the root cause and develop effective solutions.
- Optimization : Data analysis can help you optimize processes, products, or services to increase efficiency, reduce costs, and improve overall performance.
- Prediction: Data analysis can help you make predictions about future trends or outcomes, which can inform strategic planning and decision-making.
- Performance evaluation : Data analysis can help you evaluate the performance of a process, product, or service to identify areas for improvement and potential opportunities for growth.
- Risk assessment : Data analysis can help you assess and mitigate risks, whether it is financial, operational, or related to safety.
- Market research : Data analysis can help you understand customer behavior and preferences, identify market trends, and develop effective marketing strategies.
- Quality control: Data analysis can help you ensure product quality and customer satisfaction by identifying and addressing quality issues.
Purpose of Data Analysis
The primary purposes of data analysis can be summarized as follows:
- To gain insights: Data analysis allows you to identify patterns and trends in data, which can provide valuable insights into the underlying factors that influence a particular phenomenon or process.
- To inform decision-making: Data analysis can help you make informed decisions based on the information that is available. By analyzing data, you can identify potential risks, opportunities, and solutions to problems.
- To improve performance: Data analysis can help you optimize processes, products, or services by identifying areas for improvement and potential opportunities for growth.
- To measure progress: Data analysis can help you measure progress towards a specific goal or objective, allowing you to track performance over time and adjust your strategies accordingly.
- To identify new opportunities: Data analysis can help you identify new opportunities for growth and innovation by identifying patterns and trends that may not have been visible before.
Examples of Data Analysis
Some Examples of Data Analysis are as follows:
- Social Media Monitoring: Companies use data analysis to monitor social media activity in real-time to understand their brand reputation, identify potential customer issues, and track competitors. By analyzing social media data, businesses can make informed decisions on product development, marketing strategies, and customer service.
- Financial Trading: Financial traders use data analysis to make real-time decisions about buying and selling stocks, bonds, and other financial instruments. By analyzing real-time market data, traders can identify trends and patterns that help them make informed investment decisions.
- Traffic Monitoring : Cities use data analysis to monitor traffic patterns and make real-time decisions about traffic management. By analyzing data from traffic cameras, sensors, and other sources, cities can identify congestion hotspots and make changes to improve traffic flow.
- Healthcare Monitoring: Healthcare providers use data analysis to monitor patient health in real-time. By analyzing data from wearable devices, electronic health records, and other sources, healthcare providers can identify potential health issues and provide timely interventions.
- Online Advertising: Online advertisers use data analysis to make real-time decisions about advertising campaigns. By analyzing data on user behavior and ad performance, advertisers can make adjustments to their campaigns to improve their effectiveness.
- Sports Analysis : Sports teams use data analysis to make real-time decisions about strategy and player performance. By analyzing data on player movement, ball position, and other variables, coaches can make informed decisions about substitutions, game strategy, and training regimens.
- Energy Management : Energy companies use data analysis to monitor energy consumption in real-time. By analyzing data on energy usage patterns, companies can identify opportunities to reduce energy consumption and improve efficiency.
Characteristics of Data Analysis
Characteristics of Data Analysis are as follows:
- Objective : Data analysis should be objective and based on empirical evidence, rather than subjective assumptions or opinions.
- Systematic : Data analysis should follow a systematic approach, using established methods and procedures for collecting, cleaning, and analyzing data.
- Accurate : Data analysis should produce accurate results, free from errors and bias. Data should be validated and verified to ensure its quality.
- Relevant : Data analysis should be relevant to the research question or problem being addressed. It should focus on the data that is most useful for answering the research question or solving the problem.
- Comprehensive : Data analysis should be comprehensive and consider all relevant factors that may affect the research question or problem.
- Timely : Data analysis should be conducted in a timely manner, so that the results are available when they are needed.
- Reproducible : Data analysis should be reproducible, meaning that other researchers should be able to replicate the analysis using the same data and methods.
- Communicable : Data analysis should be communicated clearly and effectively to stakeholders and other interested parties. The results should be presented in a way that is understandable and useful for decision-making.
Advantages of Data Analysis
Advantages of Data Analysis are as follows:
- Better decision-making: Data analysis helps in making informed decisions based on facts and evidence, rather than intuition or guesswork.
- Improved efficiency: Data analysis can identify inefficiencies and bottlenecks in business processes, allowing organizations to optimize their operations and reduce costs.
- Increased accuracy: Data analysis helps to reduce errors and bias, providing more accurate and reliable information.
- Better customer service: Data analysis can help organizations understand their customers better, allowing them to provide better customer service and improve customer satisfaction.
- Competitive advantage: Data analysis can provide organizations with insights into their competitors, allowing them to identify areas where they can gain a competitive advantage.
- Identification of trends and patterns : Data analysis can identify trends and patterns in data that may not be immediately apparent, helping organizations to make predictions and plan for the future.
- Improved risk management : Data analysis can help organizations identify potential risks and take proactive steps to mitigate them.
- Innovation: Data analysis can inspire innovation and new ideas by revealing new opportunities or previously unknown correlations in data.
Limitations of Data Analysis
- Data quality: The quality of data can impact the accuracy and reliability of analysis results. If data is incomplete, inconsistent, or outdated, the analysis may not provide meaningful insights.
- Limited scope: Data analysis is limited by the scope of the data available. If data is incomplete or does not capture all relevant factors, the analysis may not provide a complete picture.
- Human error : Data analysis is often conducted by humans, and errors can occur in data collection, cleaning, and analysis.
- Cost : Data analysis can be expensive, requiring specialized tools, software, and expertise.
- Time-consuming : Data analysis can be time-consuming, especially when working with large datasets or conducting complex analyses.
- Overreliance on data: Data analysis should be complemented with human intuition and expertise. Overreliance on data can lead to a lack of creativity and innovation.
- Privacy concerns: Data analysis can raise privacy concerns if personal or sensitive information is used without proper consent or security measures.
About the author

Muhammad Hassan
Researcher, Academic Writer, Web developer
You may also like

Cluster Analysis – Types, Methods and Examples

Data Collection – Methods Types and Examples

Delimitations in Research – Types, Examples and...

Discriminant Analysis – Methods, Types and...

Research Process – Steps, Examples and Tips

Research Design – Types, Methods and Examples
How to Analyze Data in 2023 – A Step-by-Step Guide & Expert Tips

Table of contents

Enjoy reading this blog post written by our experts or partners.
If you want to see what Databox can do for you, click here .
Do you roll your eyes when you see you’ve been assigned the task to “analyze data” or “create a report”?
Research has shown that analyzing data doesn’t come naturally to most people.
Creating awesome marketing campaigns? Great!
But when it comes to analyzing whether that campaign was a success, it’s where most companies fall short.
We wanted to help solve that problem–especially because data-driven companies are three times more likely to report significant improvements in decision-making.
So, how do you overcome the fear (or struggle) of analyzing data?
In this guide, we’ll share the results of our survey that helped us understand how difficult data analysis is to master, along with some pro tips from 30+ experts on the subject.
What is Data Analysis?
Why is it important to analyze your data, 5 data analysis types, how companies analyze and report on data, how to analyze data in 6 steps, choosing the tools you need for data analysis, best ways to analyze data effectively, make data analysis easy with databox.

Data analysis refers to the process of collecting, cleaning, defining, and processing raw data to uncover valuable and actionable insights that will enable you (and your team) to make better-informed decisions, backed by facts rather than assumptions.
Collecting data alone doesn’t amount to much unless you take the time to dig through and interpret it.
By analyzing data consistently, you can drastically improve your business’ performance, but it’s necessary that all company departments participate.
While the term “data analysis” might send shivers down the spine for most people, this skill can be learned, even if you’re not a natural number person.
And speaking of numbers, a great example of what data analysis is can be found in the popular TV show “Numb3rs”
In the show, Charlie Eppes, a math genius, helps the FBI solve cases through data analysis techniques like predictive modeling and pattern recognition. It’s a great example of how data analysis can be used in real-world situations to make sense of complex data and uncover hidden patterns and connections.
Data analysis is pivotal for business success both in the short and long term.
On a deeper level, analyzing your data makes it easier for you to determine the ROI of your marketing and sales efforts, understand customer behavior patterns and market trends, make data-driven decisions, and more.
Here are some of the top reasons why you should analyze data:
- Improved customer experience : Analyzing your data helps you understand your customers better (behavior and actions), their needs, and how you can deliver better and more personalized customer support.
- Better decision-making : Data analysis helps boost your confidence as a business owner and make better-informed, data-driven decisions. By analyzing data you’ll be able to get a snapshot of all aspects of your business, including what’s working and what’s not, the risks, potential opportunities for improvement, and much more.
- Understand customer behavior : Stay up to speed with everything that pertains to your customers with data analysis. Learn and easily predict customer behavior based on data, follow up by taking action or making changes if necessary promptly.
- Helps with competitor analysis : Data analysis makes it easy to conduct competitor analysis. It provides you with all the information you need to know about your competitors, including insights into their strengths, weaknesses, sales tactics, and marketing strategies.
Related : Data Insights: Best Practices for Extracting Insights from Data
To properly understand how data analysis works, you’ll first need to learn about its different types and what they encompass.
Here are the five main data analysis types that most companies focus on:
- Text Analysis
- Statistical Analysis
- Diagnostic Analysis
- Predictive Analysis
- Prescriptive Analysis
1. Text Analysis
Text analysis (aka data mining ) refers to the process of transforming large sets of raw data into actionable business data. It’s essentially rearranging textual data so it’s easier to manage and filter.
When done properly, this type of analysis lets you extract the insights that are relevant to your specific industry and use them to develop future strategies.
Nowadays, most companies use modern tools to perform text analysis and streamline the entire process.
These tools can even be used for sentiment analysis – an advanced analytical process that lets you understand the specific emotion behind a text (positive, negative, or neutral) and then scores it based on several factors relevant to your organization.
For instance, you can use the tool to go through your company’s social media comments on an Instagram post that introduces your new product.
It will show you the overall sentiment by analyzing keywords like “great” and “awesome” for positive sentiment or “disappointed” and “frustrated” for negative sentiment.
In most cases, text analysis is used for data from product reviews, articles, surveys, social media information, and any other word-based source.
2. Statistical Analysis
Statistical analysis relies on statistical techniques to examine and summarize data, draw conclusions, and make predictions.
This type of analysis helps businesses make better (and more informed) decisions since they’ll have a better understanding of key business metrics and previous trends.
For example, a business might use statistical analysis to understand customer behavior and which products are most popular and why, or to predict future sales and demand for its products.
One popular example of statistical analysis can be found in Brad Pitt’s movie “Moneyball”.
Brad plays Billie Beane, the general manager of a professional baseball team with a limited budget, who uses statistical analysis to build a winning team by focusing on undervalued players that are overlooked by other teams.
For instance, he looks for players who have a high on-base percentage, a measurement of how often a player gets on base by any means (usually undervalued by other teams).
3. Diagnostic Analysis
Diagnostic analysis is one of the most commonly used techniques in modern business – it’s used to identify data anomalies and show you why something happened the way it did.
In diagnostic analysis, data from various sources is collected, analyzed, and interpreted to identify the underlying causes of problems or issues within a business.
The goal of diagnostic analysis is to provide insight into the factors that are contributing to problems or challenges within a business, so that appropriate action can be taken to address them.
However, aside from fixing problems, you can also use diagnostic analysis to see what’s driving positive outcomes and apply those same tactics to other strategies.
Let’s say that a retail store is seeing a decline in sales. The manager wants to see what’s happening, so he conducts a diagnostic analysis.
He collects data on a variety of factors that could be causing the decline, such as the store’s location, product prices, types of products, local competition, etc.
With diagnostic analysis, the manager identifies key patterns and trends that showcase the relationship between sales and these different factors.
In the end, he discovers that the sales decline is due to the store’s location. For instance, the store might be surrounded by a huge number of competitors or it’s not easily accessible to customers.
Either way, the manager now knows which issue he has to find a solution for (e.g. he will move the store to a new location).
4. Predictive Analysis
Predictive analysis is the technique used for seeing what’s most likely to happen in the future, based on historical data from previous trends and patterns.
It can be applied to a wide range of business scenarios – from predicting customer behavior and forecasting market trend to identifying potential risks and opportunities.
There are also lots of different techniques used within predictive analysis, such as regression analysis, decision trees, and neural networks.
To better explain predictive analysis, we’ll use another movie example.
In the sci-fi movie “Blade Runner 2049”, Ryan Gosling plays K, a member of a special police unit that hunts down rogue robots.
One of K’s main advantages over these robots is that he uses predictive analysis to analyze the robots’ past behavior (basically historical data) and make predictions about what they’re most likely to do next.
With this information, K is able to identify potential threats and take preventive action quickly.
5. Prescriptive Analysis
Prescriptive analysis is a type of data analysis that’s used to determine the best course of action to take in a given situation.
It involves using data and advanced algorithms to identify the actions that will have the greatest impact on a business’s performance and help it achieve its goals.
For instance, a retailer can use prescriptive analytics to determine the best way to allocate inventory across different stores.
By analyzing customer demand, store locations, and similar data, the retailer can identify which actions will improve inventory management and maximize sales in the long run.
This is just one example; this technique can be applied to a wide range of other business scenarios, such as improving supply chain efficiency, enhancing customer experience, and more.
Related : 6 Key Differences Between Data Analysis and Reporting
Want to know what the data analysis process looks like in other companies?
So did we, which is why it’s one of the aspects we focused on when conducting our 2023 State of Business Reporting that had 314 respondents.
One of the first things we wanted to check was who is primarily responsible for creating data analysis reports in companies.
It turns out that people in charge of making reports are mostly managers (only 12% of surveyed companies stated they have analysts making reports) – so we can conclude that at least managers are data proficient enough to read and analyze data.

This is also shown in another research about data literacy (65 respondents), where respondents stated that management is the most data-proficient sector in most companies.

And, while management seems to be the most involved around data analysis and reporting, companies estimate data literacy across their organization highly.
Respondents stated that 53% of their employees are data literate enough to make reports and analyze data.

But Nevena Rudan, one of the A-list data analysts here at Databox, reminds us that “being able to read and understand data is not the same as being able to put that data in context and derive actionable insights from it.”
“At one point, companies became obsessed with numbers so much, and forgot to include common sense and practice their observation skills.
“There is a big difference between making data-driven and data-informed decisions. The most successful businesses make data-informed and data-inspired decisions, and that approach allows them to grow.”

Nevena Rudan
Marketing Research Analyst at Databox
Want to get highlighted in our next report? Become a contributor now
Lastly, we asked the respondents whether they rely on any external consultants or outsource data reporting in any way.
We found out that most companies rely on their own resources when it comes to making reports for most of their business operations.

Need Help Building a Custom Dashboard?
Not sure which metrics to track or dashboards to build? Have old reports you want to recreate in Databox? Share your dashboard needs with one of Databox’s product experts and we’ll build you a customized dashboard for free.
Here is an example of what your dashboard can look like… (just imagine your data populating here)

And here’s another one…

We get it. You may not have the time to build out the perfect dashboard before your next meeting.
Luckily, we do.
Connect with someone on our team, share the metrics or areas that you need to track, and we’ll build your dashboards for you in just 24 hours.
Learn more about our free dashboard setup here , reach out for assistance via email or chat, or book a call.
Now that you’re familiar with the fundamentals, let’s move on to the exact step-by-step guide you can follow to analyze your data properly.
Step 1: Define your goals and the question you need to answer Step 2: Determine how to measure set goals Step 3: Collect your data Step 4: Clean the data Step 5: Analyze your data Step 6: Visualize and interpret results
Define Your Goals and the Question You Need to Answer
Before you do anything else, you’ll first need to define what you want to achieve through data analysis.
This is crucial because it puts you on the right track in terms of collecting the right data and using the appropriate tools and techniques.
Also, it helps you avoid collecting unnecessary data or performing irrelevant analysis, a waste of both time and resources.
Furthermore, defining your goals will help you evaluate the results of your analysis and determine whether your findings are relevant and useful.
Let’s say you’re the marketing manager for an eCommerce company and you want to understand why sales have been declining over the past few months.
You will probably define your goals something like this:
- Identify which factors are contributing to the decline in sales
- Recommend actions that the company can take to improve sales
Now, based on these goals, the questions that will guide your data analysis will probably look like this:
- Are there any trends or patterns in our sales data over the past few months that stick out?
- How do current trends compare to historical ones?
- Are there any changes in customer behavior?
Once you have clear goals and focused questions in place, you’ll be able to collect the proper data, perform the appropriate analysis, and identify potential solutions to the problem.
Branko Kral of Chosen Data also emphasizes the importance of asking a specific question since it will “keep you focused”.
“It is very easy to get lost in the analytics tools, such as Google Analytics, if you open them without a specific question in mind. It is desirable to dig around and explore new reports or report modifications, but you want to keep coming back to the main motivation for the analysis.”
Kral’s team put this into action when they experienced a drop in organic traffic: “The main question was – what caused the drop and what can we do bring the traffic back up?”
“There were some nuances in the data, but overall, we discovered that organic traffic was affected site-wide, as well as without us making any major changes to the site’s SEO qualities for at least a few weeks before the drop. That gave us the confidence to state that the cause for the drop was external.”
“We researched SEO news and learned that the early June algorithm update favors big publishers. We’ve also been noticing the external factor of featured snippets pushing page 1 results further down,” Kral adds.
Related : 7 Data Analysis Questions to Improve Your Business Reporting Process
Determine How to Measure Set Goals
After you have your goals laid out, you’ll need to determine how to measure them. This includes identifying the appropriate metrics and KPIs.
For example, if your goal is to increase sales, you’ll need to track metrics such as revenue, number of sales, or average order value.
Or, if your objective is to increase the efficiency of your customer support, you’ll probably want to track individual agent efficiency and check how satisfied your clients are with the overall service.
Collect Your Data
This step involves gathering data from a variety of internal and external sources that are relevant to your overall goal.
There are essentially two broad types of data – quantitative and qualitative. For best results, you should aim to collect both.
Quantitative data is numerical data that can be measured, compared, and counted. This includes things like revenue, sales figures, business expenses, department performance metrics, and more.
Qualitative data is non-numerical data that describes attributes or characteristics. Unlike quantitative data, it’s not easily measured or counted. This includes customer feedback, competitor analysis, market research, brand reputation, employee satisfaction surveys, and more.
Since qualitative data can’t be found in spreadsheets per se, you’ll probably have to dig through the tools your company uses on a daily basis.
For instance, some internal sources can be company emails, social media comments, and customer support conversations.
As for external resources, a good idea can be to check out specific industry reports, government data, and market research studies.
Clean the Data
Making sure your data is accurate and consistent can make a huge difference in your findings, which is why it’s important that you properly clean it before the analysis.
Some of the most common methods are:
- Correcting errors – This may involve checking for typos, inconsistencies, or missing values, and making the appropriate corrections.
- Using standardized data formats – Make sure that all the data is in the same format. For instance, this could mean converting data from different formats (such as dates or currencies) into a standard one.
- Removing duplicate or irrelevant data : The data set should only include relevant and unique data. Check whether there are any duplicates or data that isn’t relevant for your specific analysis.
- Consolidating data : In some cases, the data may need to be consolidated. This involves combining data from multiple sources or summarizing the data to create relevant summary statistics.
Naturally, smaller data sets are a lot easier to handle and you can even review them manually. Just make sure that you follow the same steps for each data set.
However, sometimes that data set might be smaller but it contains a lot of variables, making the process a lot more complex than it first meets the eye. In this situation, it’s best to use a specialized tool.
On the other hand, larger data sets are pretty much always complex and require a lot of time to go through. This is why it’s standard practice to use specialized software to go through them.
While cleaning data is generally considered the most “tedious” part of the process, it’s a necessary step in making sure your analysis yields the most useful insights and information.
Eve Lyons-Berg of Data Leaders Brief says that this is probably the most important step because “Data analysis is built on the fundamental assumption that the data you’re analyzing is trustworthy.”
“If you’re looking at unreliable data, or insignificant (i.e. too small) data, or even just inconsistent data (ie a metric that’s usually measured daily, but with several week-long gaps at random intervals), your results won’t be reliable.”
Analyze Your Data
After you have defined your goals, collected the data, and cleaned it properly, you’ll finally be ready for the analysis.
As for the exact way you should go about analyzing it, the best answer is it depends .
It depends on what you’ve defined as your goal, what type of data you’re dealing with, which resources are available to you, etc.
Another important thing you’ll have to determine is which data analysis technique suits the situation best (text analysis, statistical analysis, diagnostic analysis, predictive analysis, and prescriptive analysis).
We’ve covered all of them above so make sure you go through them and the examples once again before making a decision.
No matter which technique you go with, the overall goal here is to understand your data better and use it to make informed decisions.
Related : 12 Tips for Developing a Successful Data Analytics Strategy
Visualize and Interpret Results
Once you finish analyzing the data, the best way to understand it and build a story around is to visualize your findings .
Data visualization involves creating graphical representations of the data, such as bar charts, line charts, heat maps, scatter plots, and dashboards.
For the latter, you can use free dashboard software like Databox.
Databox helps you tell a compelling story with your data and you’ll be able to transform your findings into stunning visuals in literally a few clicks of a button.
Instead of logging into multiple tools, you can connect your data source ( 100+ integrations available) and drag all of your key findings into one comprehensive dashboard.
Pro Tip: Here Is Your Go-To Dashboard For Doing a Deeper Dive on Your Website Traffic and Conversion Sources
Struggling to find an easy yet effective way to gain a comprehensive understanding of your traffic sources, user behavior, and revenue generation?
You can do all that and more with our free plug-and-play GA4 Acquisitions dashboard template:
- Understand user acquisition: See where users come from, tailor outreach, and track new user growth;
- Focus on high-performing channels: Identify top channels, optimize resource allocation, and adjust underperformers;
- Track revenue & engagement: Monitor revenue growth, active users, and the effectiveness of your campaigns;
- Go beyond traffic & conversions: Gain deeper insights into demographics, sales, customer journeys, ARPU, and more;
- Optimize marketing & drive results: Make data-driven decisions to improve your marketing strategy and achieve business goals.

You can easily set it up in just a few clicks – no coding required.
To set up the dashboard, follow these 3 simple steps:
Step 1: Get the template
Step 2: Connect your Google Analytics 4 accounts with Databox.
Step 3: Watch your dashboard populate in seconds.
While Excel and other spreadsheet-based tools are the most popular for storing and analyzing data sets, they aren’t always practical.
For instance, if you’re dealing with qualitative (non-numerical) data like social media comments and customer support conversations, organizing it in a spreadsheet is pretty much impossible.
Or, if you’re dealing with larger sets of data with a lot of complex variables, you’ll want to have more specialized tools by your side that will reduce the chance of human error and automate the process.
Let’s go through some of the most popular types of data analysis tools:
Spreadsheets
Business intelligence tools, predictive analysis tools, data modeling tools.
- Analytics tools (Department-Specific)
Spreadsheet tools like Excel are one of the most flexible solutions if you’re dealing with small or medium data sets.
You typically don’t need to be tech-savvy to operate these tools and the interfaces tend to be very user-friendly.
Related : Create an Excel Dashboard from Scratch in 8 Steps (or Just 3 with Databox)
Business intelligence (BI) tools are specifically created to help organizations analyze larger data sets and identify key trends and patterns.
They have powerful data processing capabilities and can quickly handle large amounts of data from multiple sources.
Another advantage of BI tools is that they also offer visualization features and make it easy for users to create charts, graphs, and other visualizations that help reveal data insights and patterns.
Related : 7 Business Intelligence Report Examples to Inspire Your Own (Sourced by 17 Pros)
Predictive analysis tools use data mining, machine learning, and other advanced analytics techniques to identify patterns and trends in data sets and to generate predictions based on those patterns.
In other words, you can use these tools to see what’s scenario is most likely to occur in the future and how it will impact your organization.
Data modeling tools help you create a visual representation of your database and make it more understandable and easier to work with.
They allow you to create diagrams that show how your data is organized and related, which saves time and makes the building and maintenance process a lot easier.
Analytics Tools (Department-Specific)
Department-specific analytics tools are designed to support data analysis in specific departments or areas of an organization.
In other words, they’re tailored to the specific needs of a particular department, such as marketing, finance, or human resources.
For example, a marketing analytics tool could include features for analyzing customer data, tracking marketing campaign efficiency, and identifying sales data trends.
Similarly, a finance analytics tool could include features for analyzing financial data, creating budgets and forecasts, and identifying financial performance trends.
There’s no “one-size-fits-all” way to analyze data and each company has its own modus operandi of doing things (probably even several).
This is because there are so many variables that you need to consider to devise the perfect analysis strategy.
However, there are some practices that are pretty much universal among all organizations.
These include:
Look for Patterns and Trends
Compare current data against historical trends, look for any data that goes against your expectations, pull data from various sources, determine the next steps.
Once your data is filtered and you’ve prepared the appropriate analysis tool, it’s time to start drawing up patterns.
If you’re mostly dealing with quantitative data, spotting patterns is relatively simple and you can charts and similar visualizations to help you out.
However, it can get a bit more complicated with qualitative data like emails or customer support chats.
In this situation, you can try out the following:
- Text analysis – We talked about this technique earlier in detail. It’s a great choice when you need to extract insights from unstructured data like emails, chats, comments, etc.
- Sentiment analysis – This method relies on natural language processing to determine whether the unstructured data represents positive or negative emotions. One of the most popular use cases among companies is to use sentiment analysis for assessing brand perception.
- Topic analysis – You can use this analysis to extract the main topics from larger data sets. For instance, you can use it to analyze customer feedback or product reviews. The main goal is to check out the underlying sentiment in the data set.
- Cohort analysis – The technique used for grouping customers into similar categories (cohorts) based on common characteristics or behaviors. Companies use this analysis to understand their customer base better and make informed decisions.
The most important thing in this practice is not to make any assumptions .
For instance, if your Facebook Ad campaigns are getting a lot of clicks and there’s a spike in product sales, that doesn’t necessarily mean that the two are connected.
Just like you wouldn’t assume that a positive correlation between an increase in ice cream sales and robberies in the same town means that one’s causing the other.
This mistake is often called false causality, and it’s very common among beginner data analysts. Make sure you always have enough evidence to support the causation before sharing any insights with your team.
Comparing your current data with previous trends provides you with a broader perspective and puts the data into context.
A lot of valuable insights can be extracted once you start identifying the changes in data over a set period of time.
For instance, you might notice that your company sees a huge spike in sales each year around Christmas time.
With this information, you can prepare a more aggressive marketing campaign a few weeks before Christmas to try and take advantage of that momentum.
Related : Data Trend Analysis in Google Analytics: 7 Best Practices for Measuring Your Marketing Performance
Naturally, finding the insights that are related to the goals you set at the beginning and looking for trends that support your existing assumptions is the first thing you’ll do post-analysis.
But make sure you also look for data that goes in the opposite direction of your expectation, so you don’t get a bad case of confirmation bias .
If you do notice some data anomalies, keep on investigating them until you see why they’ve appeared. More often than not, the explanation will be simple, but you’ll want to rule out any major concerns.
Lauren Pope of G2 agrees with this and adds that you “shouldn’t follow data blindly but trust your gut instead”.
“Listening to the data is important, but it’s not infallible. If the data is suddenly telling you something VERY different from what it did just a week ago, take the time to see if everything is running the way it should.
There’s a chance that a module has been turned off, a UTM code has been corrupted, or something else has gone wrong.”
It’s a tactic also used by the team at Web Canopy Studio , as Kenny Lange explains: “I find it most helpful to drill down into anomalies – even if they’re small. It’s easy to rationalize the change in the patterns and assume that whatever you’re seeing isn’t statistically significant.”
“In addition to drilling down into anomalies, always be asking ‘why?’ I know up and to the right is good, but if you never understand what levers are controlling your growth, you’ll be unable to fix them when they break.”
Pulling data from multiple sources can help you acquire the bigger picture and it provides a broader perspective on the trends and patterns that are being analyzed.
For example, if a company is analyzing sales data, pulling data from multiple sources such as sales reports, customer feedback, and market research reports can provide a more comprehensive view of the overall sales performance.
This later helps you make more informed business decisions and improves the overall quality of the data analysis.
Giselle Bardwell of Kiwi Creative is one of the respondents that emphasize this practice because it “provides a much deeper understanding of the data”.
“Leverage a platform, like Databox, to combine multiple sources and metrics to tell a full story of how marketing and sales are performing (or not!) Bringing all the data together makes it easier to find correlations, similarities, and areas to improve.”
We recently looked at overall engagement on our blog in terms of the initial landing page, interactions with various calls-to-action (CTAs) on the page, and the journey the user takes through the website after reading a post.
Looking at the difference between user interactions on the blog versus sales-specific pages helped us to revise our content strategy to include more relevant CTAs to boost lead growth.”
Here’s a question for you – what do you plan to do with the insights you extracted from the data analysis?
Extracting insights is great and all, but you also need to have a plan on what you’ll use them for.
Some examples where you can put your findings to work are:
- Use your current performance data to set realistic targets and KPIs
- Use the insights to make better-informed business decisions
- Improve your customer satisfaction (if the data gave you a better understanding of what they want or need)
- Investigate any unexpected insights
- Share the most important insights with company shareholders and department leaders
- Try to identify new revenue streams
- Optimize company operations
These are just some examples of how you can utilize your findings.
Remember, even though you’ll probably feel relieved after wrapping up the data analysis, the analysis itself isn’t the end goal.
The primary reason you’re analyzing all that data is so you can help the company make better decisions moving forward and come up with more efficient strategies in all departments.
For most people, data analysis is as exciting as watching paint dry.
Not only are you working with complex and raw information, but you also have to spend hours (if not days) collecting it, cleaning it, filtering it… you get the idea.
After you go through all these steps and finish the analysis, you’ll need to present that data in a clear and concise manner, both for you and the stakeholders.
This includes selecting the right visualization type, then manually creating different bars and graphs, and putting the data you analyzed into perspective.
However, most employees burn out during the first part of the process, so this last step generally takes them a lot more time to complete than it should.
What’s more, they won’t be able to put the same amount of energy into it, which can sometimes even lead to misleading insights.
With Databox, you can make sure this never happens.
Here’s how easy data analysis reporting is with our software:
- Connect your data source
- Drag and drop the metrics you want to track
- Visualize the data
This process will take literally minutes… and it’s not even the fastest solution we offer.
You also have the option to contact our customer support team for a free setup and explain what you want your dashboard to include and how you want it structured, and we’ll have it ready in less than 24 hours.
Sign up for a free trial and never worry about impressing your shareholders with a phenomenal data analysis report again.
Filip Stojanovic is a content writer who studies Business and Political Sciences. Also, I am a huge tennis enthusiast. Although my dream is to win a Grand Slam, working as a content writer is also interesting.
The 20 Most Important B2B KPIs According to More Than 50 Businesses

Learn How to Automate Marketing Reporting in Databox with These 17 Animated GIFs

Build your first dashboard in 5 minutes or less
Latest from our blog
- Landing Page Best Practices for B2B SaaS and Tech Companies May 31, 2024
- How Databox University Supports Employee Personal Growth in 7 Key Areas of Life May 30, 2024
- Metrics & KPIs
- vs. Tableau
- vs. Looker Studio
- vs. Klipfolio
- vs. Power BI
- vs. Whatagraph
- vs. AgencyAnalytics
- Product & Engineering
- Inside Databox
- Terms of Service
- Privacy Policy
- Talent Resources
- We're Hiring!
- Help Center
- API Documentation
Quantitative Data Analysis: A Comprehensive Guide
By: Ofem Eteng | Published: May 18, 2022
Related Articles
A healthcare giant successfully introduces the most effective drug dosage through rigorous statistical modeling, saving countless lives. A marketing team predicts consumer trends with uncanny accuracy, tailoring campaigns for maximum impact.
Table of Contents
These trends and dosages are not just any numbers but are a result of meticulous quantitative data analysis. Quantitative data analysis offers a robust framework for understanding complex phenomena, evaluating hypotheses, and predicting future outcomes.
In this blog, we’ll walk through the concept of quantitative data analysis, the steps required, its advantages, and the methods and techniques that are used in this analysis. Read on!
What is Quantitative Data Analysis?
Quantitative data analysis is a systematic process of examining, interpreting, and drawing meaningful conclusions from numerical data. It involves the application of statistical methods, mathematical models, and computational techniques to understand patterns, relationships, and trends within datasets.
Quantitative data analysis methods typically work with algorithms, mathematical analysis tools, and software to gain insights from the data, answering questions such as how many, how often, and how much. Data for quantitative data analysis is usually collected from close-ended surveys, questionnaires, polls, etc. The data can also be obtained from sales figures, email click-through rates, number of website visitors, and percentage revenue increase.
Quantitative Data Analysis vs Qualitative Data Analysis
When we talk about data, we directly think about the pattern, the relationship, and the connection between the datasets – analyzing the data in short. Therefore when it comes to data analysis, there are broadly two types – Quantitative Data Analysis and Qualitative Data Analysis.
Quantitative data analysis revolves around numerical data and statistics, which are suitable for functions that can be counted or measured. In contrast, qualitative data analysis includes description and subjective information – for things that can be observed but not measured.
Let us differentiate between Quantitative Data Analysis and Quantitative Data Analysis for a better understanding.
Data Preparation Steps for Quantitative Data Analysis
Quantitative data has to be gathered and cleaned before proceeding to the stage of analyzing it. Below are the steps to prepare a data before quantitative research analysis:
- Step 1: Data Collection
Before beginning the analysis process, you need data. Data can be collected through rigorous quantitative research, which includes methods such as interviews, focus groups, surveys, and questionnaires.
- Step 2: Data Cleaning
Once the data is collected, begin the data cleaning process by scanning through the entire data for duplicates, errors, and omissions. Keep a close eye for outliers (data points that are significantly different from the majority of the dataset) because they can skew your analysis results if they are not removed.
This data-cleaning process ensures data accuracy, consistency and relevancy before analysis.
- Step 3: Data Analysis and Interpretation
Now that you have collected and cleaned your data, it is now time to carry out the quantitative analysis. There are two methods of quantitative data analysis, which we will discuss in the next section.
However, if you have data from multiple sources, collecting and cleaning it can be a cumbersome task. This is where Hevo Data steps in. With Hevo, extracting, transforming, and loading data from source to destination becomes a seamless task, eliminating the need for manual coding. This not only saves valuable time but also enhances the overall efficiency of data analysis and visualization, empowering users to derive insights quickly and with precision
Hevo is the only real-time ELT No-code Data Pipeline platform that cost-effectively automates data pipelines that are flexible to your needs. With integration with 150+ Data Sources (40+ free sources), we help you not only export data from sources & load data to the destinations but also transform & enrich your data, & make it analysis-ready.
Start for free now!
Now that you are familiar with what quantitative data analysis is and how to prepare your data for analysis, the focus will shift to the purpose of this article, which is to describe the methods and techniques of quantitative data analysis.
Methods and Techniques of Quantitative Data Analysis
Quantitative data analysis employs two techniques to extract meaningful insights from datasets, broadly. The first method is descriptive statistics, which summarizes and portrays essential features of a dataset, such as mean, median, and standard deviation.
Inferential statistics, the second method, extrapolates insights and predictions from a sample dataset to make broader inferences about an entire population, such as hypothesis testing and regression analysis.
An in-depth explanation of both the methods is provided below:
- Descriptive Statistics
- Inferential Statistics
1) Descriptive Statistics
Descriptive statistics as the name implies is used to describe a dataset. It helps understand the details of your data by summarizing it and finding patterns from the specific data sample. They provide absolute numbers obtained from a sample but do not necessarily explain the rationale behind the numbers and are mostly used for analyzing single variables. The methods used in descriptive statistics include:
- Mean: This calculates the numerical average of a set of values.
- Median: This is used to get the midpoint of a set of values when the numbers are arranged in numerical order.
- Mode: This is used to find the most commonly occurring value in a dataset.
- Percentage: This is used to express how a value or group of respondents within the data relates to a larger group of respondents.
- Frequency: This indicates the number of times a value is found.
- Range: This shows the highest and lowest values in a dataset.
- Standard Deviation: This is used to indicate how dispersed a range of numbers is, meaning, it shows how close all the numbers are to the mean.
- Skewness: It indicates how symmetrical a range of numbers is, showing if they cluster into a smooth bell curve shape in the middle of the graph or if they skew towards the left or right.
2) Inferential Statistics
In quantitative analysis, the expectation is to turn raw numbers into meaningful insight using numerical values, and descriptive statistics is all about explaining details of a specific dataset using numbers, but it does not explain the motives behind the numbers; hence, a need for further analysis using inferential statistics.
Inferential statistics aim to make predictions or highlight possible outcomes from the analyzed data obtained from descriptive statistics. They are used to generalize results and make predictions between groups, show relationships that exist between multiple variables, and are used for hypothesis testing that predicts changes or differences.
There are various statistical analysis methods used within inferential statistics; a few are discussed below.
- Cross Tabulations: Cross tabulation or crosstab is used to show the relationship that exists between two variables and is often used to compare results by demographic groups. It uses a basic tabular form to draw inferences between different data sets and contains data that is mutually exclusive or has some connection with each other. Crosstabs help understand the nuances of a dataset and factors that may influence a data point.
- Regression Analysis: Regression analysis estimates the relationship between a set of variables. It shows the correlation between a dependent variable (the variable or outcome you want to measure or predict) and any number of independent variables (factors that may impact the dependent variable). Therefore, the purpose of the regression analysis is to estimate how one or more variables might affect a dependent variable to identify trends and patterns to make predictions and forecast possible future trends. There are many types of regression analysis, and the model you choose will be determined by the type of data you have for the dependent variable. The types of regression analysis include linear regression, non-linear regression, binary logistic regression, etc.
- Monte Carlo Simulation: Monte Carlo simulation, also known as the Monte Carlo method, is a computerized technique of generating models of possible outcomes and showing their probability distributions. It considers a range of possible outcomes and then tries to calculate how likely each outcome will occur. Data analysts use it to perform advanced risk analyses to help forecast future events and make decisions accordingly.
- Analysis of Variance (ANOVA): This is used to test the extent to which two or more groups differ from each other. It compares the mean of various groups and allows the analysis of multiple groups.
- Factor Analysis: A large number of variables can be reduced into a smaller number of factors using the factor analysis technique. It works on the principle that multiple separate observable variables correlate with each other because they are all associated with an underlying construct. It helps in reducing large datasets into smaller, more manageable samples.
- Cohort Analysis: Cohort analysis can be defined as a subset of behavioral analytics that operates from data taken from a given dataset. Rather than looking at all users as one unit, cohort analysis breaks down data into related groups for analysis, where these groups or cohorts usually have common characteristics or similarities within a defined period.
- MaxDiff Analysis: This is a quantitative data analysis method that is used to gauge customers’ preferences for purchase and what parameters rank higher than the others in the process.
- Cluster Analysis: Cluster analysis is a technique used to identify structures within a dataset. Cluster analysis aims to be able to sort different data points into groups that are internally similar and externally different; that is, data points within a cluster will look like each other and different from data points in other clusters.
- Time Series Analysis: This is a statistical analytic technique used to identify trends and cycles over time. It is simply the measurement of the same variables at different times, like weekly and monthly email sign-ups, to uncover trends, seasonality, and cyclic patterns. By doing this, the data analyst can forecast how variables of interest may fluctuate in the future.
- SWOT analysis: This is a quantitative data analysis method that assigns numerical values to indicate strengths, weaknesses, opportunities, and threats of an organization, product, or service to show a clearer picture of competition to foster better business strategies
How to Choose the Right Method for your Analysis?
Choosing between Descriptive Statistics or Inferential Statistics can be often confusing. You should consider the following factors before choosing the right method for your quantitative data analysis:
1. Type of Data
The first consideration in data analysis is understanding the type of data you have. Different statistical methods have specific requirements based on these data types, and using the wrong method can render results meaningless. The choice of statistical method should align with the nature and distribution of your data to ensure meaningful and accurate analysis.
2. Your Research Questions
When deciding on statistical methods, it’s crucial to align them with your specific research questions and hypotheses. The nature of your questions will influence whether descriptive statistics alone, which reveal sample attributes, are sufficient or if you need both descriptive and inferential statistics to understand group differences or relationships between variables and make population inferences.
Pros and Cons of Quantitative Data Analysis
1. Objectivity and Generalizability:
- Quantitative data analysis offers objective, numerical measurements, minimizing bias and personal interpretation.
- Results can often be generalized to larger populations, making them applicable to broader contexts.
Example: A study using quantitative data analysis to measure student test scores can objectively compare performance across different schools and demographics, leading to generalizable insights about educational strategies.
2. Precision and Efficiency:
- Statistical methods provide precise numerical results, allowing for accurate comparisons and prediction.
- Large datasets can be analyzed efficiently with the help of computer software, saving time and resources.
Example: A marketing team can use quantitative data analysis to precisely track click-through rates and conversion rates on different ad campaigns, quickly identifying the most effective strategies for maximizing customer engagement.
3. Identification of Patterns and Relationships:
- Statistical techniques reveal hidden patterns and relationships between variables that might not be apparent through observation alone.
- This can lead to new insights and understanding of complex phenomena.
Example: A medical researcher can use quantitative analysis to pinpoint correlations between lifestyle factors and disease risk, aiding in the development of prevention strategies.
1. Limited Scope:
- Quantitative analysis focuses on quantifiable aspects of a phenomenon , potentially overlooking important qualitative nuances, such as emotions, motivations, or cultural contexts.
Example: A survey measuring customer satisfaction with numerical ratings might miss key insights about the underlying reasons for their satisfaction or dissatisfaction, which could be better captured through open-ended feedback.
2. Oversimplification:
- Reducing complex phenomena to numerical data can lead to oversimplification and a loss of richness in understanding.
Example: Analyzing employee productivity solely through quantitative metrics like hours worked or tasks completed might not account for factors like creativity, collaboration, or problem-solving skills, which are crucial for overall performance.
3. Potential for Misinterpretation:
- Statistical results can be misinterpreted if not analyzed carefully and with appropriate expertise.
- The choice of statistical methods and assumptions can significantly influence results.
This blog discusses the steps, methods, and techniques of quantitative data analysis. It also gives insights into the methods of data collection, the type of data one should work with, and the pros and cons of such analysis.
Gain a better understanding of data analysis with these essential reads:
- Data Analysis and Modeling: 4 Critical Differences
- Exploratory Data Analysis Simplified 101
- 25 Best Data Analysis Tools in 2024
Carrying out successful data analysis requires prepping the data and making it analysis-ready. That is where Hevo steps in.
Want to give Hevo a try? Sign Up for a 14-day free trial and experience the feature-rich Hevo suite first hand. You may also have a look at the amazing Hevo price , which will assist you in selecting the best plan for your requirements.
Share your experience of understanding Quantitative Data Analysis in the comment section below! We would love to hear your thoughts.

Ofem Eteng is a dynamic Machine Learning Engineer at Braln Ltd, where he pioneers the implementation of Deep Learning solutions and explores emerging technologies. His 9 years experience spans across roles such as System Analyst (DevOps) at Dagbs Nigeria Limited, and as a Full Stack Developer at Pedoquasphere International Limited. With a passion for bridging the gap between intricate technical concepts and accessible understanding, Ofem's work resonates with readers seeking insightful perspectives on data science, analytics, and cutting-edge technologies.
No-code Data Pipeline for your Data Warehouse
- Data Analysis
- Data Warehouse
- Quantitative Data Analysis
Continue Reading

Skand Agrawal
Understanding Data Modelling Techniques: A Comprehensive Guide 101

Veeresh Biradar
Java Lambda Expressions: A Comprehensive Guide 101

Sarthak Bhardwaj
AWS SQS Deletemessage: A Comprehensive Guide 101
I want to read this e-book.
Data & Finance for Work & Life

Data Analysis for Qualitative Research: 6 Step Guide
Data analysis for qualitative research is not intuitive. This is because qualitative data stands in opposition to traditional data analysis methodologies: while data analysis is concerned with quantities, qualitative data is by definition unquantified . But there is an easy, methodical approach that anyone can take use to get reliable results when performing data analysis for qualitative research. The process consists of 6 steps that I’ll break down in this article:
- Perform interviews(if necessary )
- Gather all documents and transcribe any non-paper records
- Decide whether to either code analytical data, analyze word frequencies, or both
- Decide what interpretive angle you want to take: content analysis , narrative analysis, discourse analysis, framework analysis, and/or grounded theory
- Compile your data in a spreadsheet using document saving techniques (windows and mac)
- Identify trends in words, themes, metaphors, natural patterns, and more
To complete these steps, you will need:
- Microsoft word
- Microsoft excel
- Internet access
You can get the free Intro to Data Analysis eBook to cover the fundamentals and ensure strong progression in all your data endeavors.
What is qualitative research?
Qualitative research is not the same as quantitative research. In short, qualitative research is the interpretation of non-numeric data. It usually aims at drawing conclusions that explain why a phenomenon occurs, rather than that one does occur. Here’s a great quote from a nursing magazine about quantitative vs qualitative research:
“A traditional quantitative study… uses a predetermined (and auditable) set of steps to confirm or refute [a] hypothesis. “In contrast, qualitative research often takes the position that an interpretive understanding is only possible by way of uncovering or deconstructing the meanings of a phenomenon. Thus, a distinction between explaining how something operates (explanation) and why it operates in the manner that it does (interpretation) may be [an] effective way to distinguish quantitative from qualitative analytic processes involved in any particular study.” (bold added) (( EBN ))
Learn to Interpret Your Qualitative Data
This article explain what data analysis is and how to do it. To learn how to interpret the results, visualize, and write an insightful report, sign up for our handbook below.

Step 1a: Data collection methods and techniques in qualitative research: interviews and focus groups
Step 1 is collecting the data that you will need for the analysis. If you are not performing any interviews or focus groups to gather data, then you can skip this step. It’s for people who need to go into the field and collect raw information as part of their qualitative analysis.
Since the whole point of an interview and of qualitative analysis in general is to understand a research question better, you should start by making sure you have a specific, refined research question . Whether you’re a researcher by trade or a data analyst working on one-time project, you must know specifically what you want to understand in order to get results.
Good research questions are specific enough to guide action but open enough to leave room for insight and growth. Examples of good research questions include:
- Good : To what degree does living in a city impact the quality of a person’s life? (open-ended, complex)
- Bad : Does living in a city impact the quality of a person’s life? (closed, simple)
Once you understand the research question, you need to develop a list of interview questions. These questions should likewise be open-ended and provide liberty of expression to the responder. They should support the research question in an active way without prejudicing the response. Examples of good interview questions include:
- Good : Tell me what it’s like to live in a city versus in the country. (open, not leading)
- Bad : Don’t you prefer the city to the country because there are more people? (closed, leading)
Some additional helpful tips include:
- Begin each interview with a neutral question to get the person relaxed
- Limit each question to a single idea
- If you don’t understand, ask for clarity
- Do not pass any judgements
- Do not spend more than 15m on an interview, lest the quality of responses drop
Focus groups
The alternative to interviews is focus groups. Focus groups are a great way for you to get an idea for how people communicate their opinions in a group setting, rather than a one-on-one setting as in interviews.
In short, focus groups are gatherings of small groups of people from representative backgrounds who receive instruction, or “facilitation,” from a focus group leader. Typically, the leader will ask questions to stimulate conversation, reformulate questions to bring the discussion back to focus, and prevent the discussion from turning sour or giving way to bad faith.
Focus group questions should be open-ended like their interview neighbors, and they should stimulate some degree of disagreement. Disagreement often leads to valuable information about differing opinions, as people tend to say what they mean if contradicted.
However, focus group leaders must be careful not to let disagreements escalate, as anger can make people lie to be hurtful or simply to win an argument. And lies are not helpful in data analysis for qualitative research.
Step 1b: Tools for qualitative data collection
When it comes to data analysis for qualitative analysis, the tools you use to collect data should align to some degree with the tools you will use to analyze the data.
As mentioned in the intro, you will be focusing on analysis techniques that only require the traditional Microsoft suite programs: Microsoft Excel and Microsoft Word . At the same time, you can source supplementary tools from various websites, like Text Analyzer and WordCounter.
In short, the tools for qualitative data collection that you need are Excel and Word , as well as web-based free tools like Text Analyzer and WordCounter . These online tools are helpful in the quantitative part of your qualitative research.
Step 2: Gather all documents & transcribe non-written docs
Once you have your interviews and/or focus group transcripts, it’s time to decide if you need other documentation. If you do, you’ll need to gather it all into one place first, then develop a strategy for how to transcribe any non-written documents.
When do you need documentation other than interviews and focus groups? Two situations usually call for documentation. First , if you have little funding , then you can’t afford to run expensive interviews and focus groups.
Second , social science researchers typically focus on documents since their research questions are less concerned with subject-oriented data, while hard science and business researchers typically focus on interviews and focus groups because they want to know what people think, and they want to know today.
Non-written records
Other factors at play include the type of research, the field, and specific research goal. For those who need documentation and to describe non-written records, there are some steps to follow:
- Put all hard copy source documents into a sealed binder (I use plastic paper holders with elastic seals ).
- If you are sourcing directly from printed books or journals, then you will need to digitalize them by scanning them and making them text readable by the computer. To do so, turn all PDFs into Word documents using online tools such as PDF to Word Converter . This process is never full-proof, and it may be a source of error in the data collection, but it’s part of the process.
- If you are sourcing online documents, try as often as possible to get computer-readable PDF documents that you can easily copy/paste or convert. Locked PDFs are essentially a lost cause .
- Transcribe any audio files into written documents. There are free online tools available to help with this, such as 360converter . If you run a test through the system, you’ll see that the output is not 100%. The best way to use this tool is as a first draft generator. You can then correct and complete it with old fashioned, direct transcription.
Step 3: Decide on the type of qualitative research
Before step 3 you should have collected your data, transcribed it all into written-word documents, and compiled it in one place. Now comes the interesting part. You need to decide what you want to get out of your research by choosing an analytic angle, or type of qualitative research.
The available types of qualitative research are as follows. Each of them takes a unique angle that you must choose to get what information you want from the analysis . In addition, each of them has a different impact on the data analysis for qualitative research (coding vs word frequency) that we use.
Content analysis
Narrative analysis, discourse analysis.
- Framework analysis, and/or
Grounded theory
From a high level, content, narrative, and discourse analysis are actionable independent tactics, whereas framework analysis and grounded theory are ways of honing and applying the first three.
- Definition : Content analysis is identify and labelling themes of any kind within a text.
- Focus : Identifying any kind of pattern in written text, transcribed audio, or transcribed video. This could be thematic, word repetition, idea repetition. Most often, the patterns we find are idea that make up an argument.
- Goal : To simplify, standardize, and quickly reference ideas from any given text. Content analysis is a way to pull the main ideas from huge documents for comparison. In this way, it’s more a means to an end.
- Pros : The huge advantage of doing content analysis is that you can quickly process huge amounts of texts using simple coding and word frequency techniques we will look at below. To use a metaphore, it is to qualitative analysis documents what Spark notes are to books.
- Cons : The downside to content analysis is that it’s quite general. If you have a very specific, narrative research question, then tracing “any and all ideas” will not be very helpful to you.
- Definition : Narrative analysis is the reformulation and simplification of interview answers or documentation into small narrative components to identify story-like patterns.
- Focus : Understanding the text based on its narrative components as opposed to themes or other qualities.
- Goal : To reference the text from an angle closer to the nature of texts in order to obtain further insights.
- Pros : Narrative analysis is very useful for getting perspective on a topic in which you’re extremely limited. It can be easy to get tunnel vision when you’re digging for themes and ideas from a reason-centric perspective. Turning to a narrative approach will help you stay grounded. More importantly, it helps reveal different kinds of trends.
- Cons : Narrative analysis adds another layer of subjectivity to the instinctive nature of qualitative research. Many see it as too dependent on the researcher to hold any critical value.
- Definition : Discourse analysis is the textual analysis of naturally occurring speech. Any oral expression must be transcribed before undergoing legitimate discourse analysis.
- Focus : Understanding ideas and themes through language communicated orally rather than pre-processed on paper.
- Goal : To obtain insights from an angle outside the traditional content analysis on text.
- Pros : Provides a considerable advantage in some areas of study in order to understand how people communicate an idea, versus the idea itself. For example, discourse analysis is important in political campaigning. People rarely vote for the candidate who most closely corresponds to his/her beliefs, but rather for the person they like the most.
- Cons : As with narrative analysis, discourse analysis is more subjective in nature than content analysis, which focuses on ideas and patterns. Some do not consider it rigorous enough to be considered a legitimate subset of qualitative analysis, but these people are few.
Framework analysis
- Definition : Framework analysis is a kind of qualitative analysis that includes 5 ordered steps: coding, indexing, charting, mapping, and interpreting . In most ways, framework analysis is a synonym for qualitative analysis — the same thing. The significant difference is the importance it places on the perspective used in the analysis.
- Focus : Understanding patterns in themes and ideas.
- Goal : Creating one specific framework for looking at a text.
- Pros : Framework analysis is helpful when the researcher clearly understands what he/she wants from the project, as it’s a limitation approach. Since each of its step has defined parameters, framework analysis is very useful for teamwork.
- Cons : It can lead to tunnel vision.
- Definition : The use of content, narrative, and discourse analysis to examine a single case, in the hopes that discoveries from that case will lead to a foundational theory used to examine other like cases.
- Focus : A vast approach using multiple techniques in order to establish patterns.
- Goal : To develop a foundational theory.
- Pros : When successful, grounded theories can revolutionize entire fields of study.
- Cons : It’s very difficult to establish ground theories, and there’s an enormous amount of risk involved.
Step 4: Coding, word frequency, or both
Coding in data analysis for qualitative research is the process of writing 2-5 word codes that summarize at least 1 paragraphs of text (not writing computer code). This allows researchers to keep track of and analyze those codes. On the other hand, word frequency is the process of counting the presence and orientation of words within a text, which makes it the quantitative element in qualitative data analysis.
Video example of coding for data analysis in qualitative research
In short, coding in the context of data analysis for qualitative research follows 2 steps (video below):
- Reading through the text one time
- Adding 2-5 word summaries each time a significant theme or idea appears
Let’s look at a brief example of how to code for qualitative research in this video:
Click here for a link to the source text. 1
Example of word frequency processing
And word frequency is the process of finding a specific word or identifying the most common words through 3 steps:
- Decide if you want to find 1 word or identify the most common ones
- Use word’s “Replace” function to find a word or phrase
- Use Text Analyzer to find the most common terms
Here’s another look at word frequency processing and how you to do it. Let’s look at the same example above, but from a quantitative perspective.
Imagine we are already familiar with melanoma and KITs , and we want to analyze the text based on these keywords. One thing we can do is look for these words using the Replace function in word
- Locate the search bar
- Click replace
- Type in the word
- See the total results
Here’s a brief video example:
Another option is to use an online Text Analyzer. This methodology won’t help us find a specific word, but it will help us discover the top performing phrases and words. All you need to do it put in a link to a target page or paste a text. I pasted the abstract from our source text, and what turns up is as expected. Here’s a picture:

Step 5: Compile your data in a spreadsheet
After you have some coded data in the word document, you need to get it into excel for analysis. This process requires saving the word doc as an .htm extension, which makes it a website. Once you have the website, it’s as simple as opening that page, scrolling to the bottom, and copying/pasting the comments, or codes, into an excel document.
You will need to wrangle the data slightly in order to make it readable in excel. I’ve made a video to explain this process and places it below.
Step 6: Identify trends & analyze!
There are literally thousands of different ways to analyze qualitative data, and in most situations, the best technique depends on the information you want to get out of the research.
Nevertheless, there are a few go-to techniques. The most important of this is occurrences . In this short video, we finish the example from above by counting the number of times our codes appear. In this way, it’s very similar to word frequency (discussed above).
A few other options include:
- Ranking each code on a set of relevant criteria and clustering
- Pure cluster analysis
- Causal analysis
We cover different types of analysis like this on the website, so be sure to check out other articles on the home page .
How to analyze qualitative data from an interview
To analyze qualitative data from an interview , follow the same 6 steps for quantitative data analysis:
- Perform the interviews
- Transcribe the interviews onto paper
- Decide whether to either code analytical data (open, axial, selective), analyze word frequencies, or both
- Compile your data in a spreadsheet using document saving techniques (for windows and mac)
- Source text [ ↩ ]
About the Author
Noah is the founder & Editor-in-Chief at AnalystAnswers. He is a transatlantic professional and entrepreneur with 5+ years of corporate finance and data analytics experience, as well as 3+ years in consumer financial products and business software. He started AnalystAnswers to provide aspiring professionals with accessible explanations of otherwise dense finance and data concepts. Noah believes everyone can benefit from an analytical mindset in growing digital world. When he's not busy at work, Noah likes to explore new European cities, exercise, and spend time with friends and family.
File available immediately.

Notice: JavaScript is required for this content.

- AI & NLP
- Churn & Loyalty
- Customer Experience
- Customer Journeys
- Customer Metrics
- Feedback Analysis
- Product Experience
- Product Updates
- Sentiment Analysis
- Surveys & Feedback Collection
- Try Thematic
Welcome to the community

Qualitative Data Analysis: Step-by-Step Guide (Manual vs. Automatic)
When we conduct qualitative methods of research, need to explain changes in metrics or understand people's opinions, we always turn to qualitative data. Qualitative data is typically generated through:
- Interview transcripts
- Surveys with open-ended questions
- Contact center transcripts
- Texts and documents
- Audio and video recordings
- Observational notes
Compared to quantitative data, which captures structured information, qualitative data is unstructured and has more depth. It can answer our questions, can help formulate hypotheses and build understanding.
It's important to understand the differences between quantitative data & qualitative data . But unfortunately, analyzing qualitative data is difficult. While tools like Excel, Tableau and PowerBI crunch and visualize quantitative data with ease, there are a limited number of mainstream tools for analyzing qualitative data . The majority of qualitative data analysis still happens manually.
That said, there are two new trends that are changing this. First, there are advances in natural language processing (NLP) which is focused on understanding human language. Second, there is an explosion of user-friendly software designed for both researchers and businesses. Both help automate the qualitative data analysis process.
In this post we want to teach you how to conduct a successful qualitative data analysis. There are two primary qualitative data analysis methods; manual & automatic. We will teach you how to conduct the analysis manually, and also, automatically using software solutions powered by NLP. We’ll guide you through the steps to conduct a manual analysis, and look at what is involved and the role technology can play in automating this process.
More businesses are switching to fully-automated analysis of qualitative customer data because it is cheaper, faster, and just as accurate. Primarily, businesses purchase subscriptions to feedback analytics platforms so that they can understand customer pain points and sentiment.

We’ll take you through 5 steps to conduct a successful qualitative data analysis. Within each step we will highlight the key difference between the manual, and automated approach of qualitative researchers. Here's an overview of the steps:
The 5 steps to doing qualitative data analysis
- Gathering and collecting your qualitative data
- Organizing and connecting into your qualitative data
- Coding your qualitative data
- Analyzing the qualitative data for insights
- Reporting on the insights derived from your analysis
What is Qualitative Data Analysis?
Qualitative data analysis is a process of gathering, structuring and interpreting qualitative data to understand what it represents.
Qualitative data is non-numerical and unstructured. Qualitative data generally refers to text, such as open-ended responses to survey questions or user interviews, but also includes audio, photos and video.
Businesses often perform qualitative data analysis on customer feedback. And within this context, qualitative data generally refers to verbatim text data collected from sources such as reviews, complaints, chat messages, support centre interactions, customer interviews, case notes or social media comments.
How is qualitative data analysis different from quantitative data analysis?
Understanding the differences between quantitative & qualitative data is important. When it comes to analyzing data, Qualitative Data Analysis serves a very different role to Quantitative Data Analysis. But what sets them apart?
Qualitative Data Analysis dives into the stories hidden in non-numerical data such as interviews, open-ended survey answers, or notes from observations. It uncovers the ‘whys’ and ‘hows’ giving a deep understanding of people’s experiences and emotions.
Quantitative Data Analysis on the other hand deals with numerical data, using statistics to measure differences, identify preferred options, and pinpoint root causes of issues. It steps back to address questions like "how many" or "what percentage" to offer broad insights we can apply to larger groups.
In short, Qualitative Data Analysis is like a microscope, helping us understand specific detail. Quantitative Data Analysis is like the telescope, giving us a broader perspective. Both are important, working together to decode data for different objectives.
Qualitative Data Analysis methods
Once all the data has been captured, there are a variety of analysis techniques available and the choice is determined by your specific research objectives and the kind of data you’ve gathered. Common qualitative data analysis methods include:
Content Analysis
This is a popular approach to qualitative data analysis. Other qualitative analysis techniques may fit within the broad scope of content analysis. Thematic analysis is a part of the content analysis. Content analysis is used to identify the patterns that emerge from text, by grouping content into words, concepts, and themes. Content analysis is useful to quantify the relationship between all of the grouped content. The Columbia School of Public Health has a detailed breakdown of content analysis .
Narrative Analysis
Narrative analysis focuses on the stories people tell and the language they use to make sense of them. It is particularly useful in qualitative research methods where customer stories are used to get a deep understanding of customers’ perspectives on a specific issue. A narrative analysis might enable us to summarize the outcomes of a focused case study.
Discourse Analysis
Discourse analysis is used to get a thorough understanding of the political, cultural and power dynamics that exist in specific situations. The focus of discourse analysis here is on the way people express themselves in different social contexts. Discourse analysis is commonly used by brand strategists who hope to understand why a group of people feel the way they do about a brand or product.
Thematic Analysis
Thematic analysis is used to deduce the meaning behind the words people use. This is accomplished by discovering repeating themes in text. These meaningful themes reveal key insights into data and can be quantified, particularly when paired with sentiment analysis . Often, the outcome of thematic analysis is a code frame that captures themes in terms of codes, also called categories. So the process of thematic analysis is also referred to as “coding”. A common use-case for thematic analysis in companies is analysis of customer feedback.
Grounded Theory
Grounded theory is a useful approach when little is known about a subject. Grounded theory starts by formulating a theory around a single data case. This means that the theory is “grounded”. Grounded theory analysis is based on actual data, and not entirely speculative. Then additional cases can be examined to see if they are relevant and can add to the original grounded theory.

Challenges of Qualitative Data Analysis
While Qualitative Data Analysis offers rich insights, it comes with its challenges. Each unique QDA method has its unique hurdles. Let’s take a look at the challenges researchers and analysts might face, depending on the chosen method.
- Time and Effort (Narrative Analysis): Narrative analysis, which focuses on personal stories, demands patience. Sifting through lengthy narratives to find meaningful insights can be time-consuming, requires dedicated effort.
- Being Objective (Grounded Theory): Grounded theory, building theories from data, faces the challenges of personal biases. Staying objective while interpreting data is crucial, ensuring conclusions are rooted in the data itself.
- Complexity (Thematic Analysis): Thematic analysis involves identifying themes within data, a process that can be intricate. Categorizing and understanding themes can be complex, especially when each piece of data varies in context and structure. Thematic Analysis software can simplify this process.
- Generalizing Findings (Narrative Analysis): Narrative analysis, dealing with individual stories, makes drawing broad challenging. Extending findings from a single narrative to a broader context requires careful consideration.
- Managing Data (Thematic Analysis): Thematic analysis involves organizing and managing vast amounts of unstructured data, like interview transcripts. Managing this can be a hefty task, requiring effective data management strategies.
- Skill Level (Grounded Theory): Grounded theory demands specific skills to build theories from the ground up. Finding or training analysts with these skills poses a challenge, requiring investment in building expertise.
Benefits of qualitative data analysis
Qualitative Data Analysis (QDA) is like a versatile toolkit, offering a tailored approach to understanding your data. The benefits it offers are as diverse as the methods. Let’s explore why choosing the right method matters.
- Tailored Methods for Specific Needs: QDA isn't one-size-fits-all. Depending on your research objectives and the type of data at hand, different methods offer unique benefits. If you want emotive customer stories, narrative analysis paints a strong picture. When you want to explain a score, thematic analysis reveals insightful patterns
- Flexibility with Thematic Analysis: thematic analysis is like a chameleon in the toolkit of QDA. It adapts well to different types of data and research objectives, making it a top choice for any qualitative analysis.
- Deeper Understanding, Better Products: QDA helps you dive into people's thoughts and feelings. This deep understanding helps you build products and services that truly matches what people want, ensuring satisfied customers
- Finding the Unexpected: Qualitative data often reveals surprises that we miss in quantitative data. QDA offers us new ideas and perspectives, for insights we might otherwise miss.
- Building Effective Strategies: Insights from QDA are like strategic guides. They help businesses in crafting plans that match people’s desires.
- Creating Genuine Connections: Understanding people’s experiences lets businesses connect on a real level. This genuine connection helps build trust and loyalty, priceless for any business.
How to do Qualitative Data Analysis: 5 steps
Now we are going to show how you can do your own qualitative data analysis. We will guide you through this process step by step. As mentioned earlier, you will learn how to do qualitative data analysis manually , and also automatically using modern qualitative data and thematic analysis software.
To get best value from the analysis process and research process, it’s important to be super clear about the nature and scope of the question that’s being researched. This will help you select the research collection channels that are most likely to help you answer your question.
Depending on if you are a business looking to understand customer sentiment, or an academic surveying a school, your approach to qualitative data analysis will be unique.
Once you’re clear, there’s a sequence to follow. And, though there are differences in the manual and automatic approaches, the process steps are mostly the same.
The use case for our step-by-step guide is a company looking to collect data (customer feedback data), and analyze the customer feedback - in order to improve customer experience. By analyzing the customer feedback the company derives insights about their business and their customers. You can follow these same steps regardless of the nature of your research. Let’s get started.
Step 1: Gather your qualitative data and conduct research (Conduct qualitative research)
The first step of qualitative research is to do data collection. Put simply, data collection is gathering all of your data for analysis. A common situation is when qualitative data is spread across various sources.
Classic methods of gathering qualitative data
Most companies use traditional methods for gathering qualitative data: conducting interviews with research participants, running surveys, and running focus groups. This data is typically stored in documents, CRMs, databases and knowledge bases. It’s important to examine which data is available and needs to be included in your research project, based on its scope.
Using your existing qualitative feedback
As it becomes easier for customers to engage across a range of different channels, companies are gathering increasingly large amounts of both solicited and unsolicited qualitative feedback.
Most organizations have now invested in Voice of Customer programs , support ticketing systems, chatbot and support conversations, emails and even customer Slack chats.
These new channels provide companies with new ways of getting feedback, and also allow the collection of unstructured feedback data at scale.
The great thing about this data is that it contains a wealth of valubale insights and that it’s already there! When you have a new question about user behavior or your customers, you don’t need to create a new research study or set up a focus group. You can find most answers in the data you already have.
Typically, this data is stored in third-party solutions or a central database, but there are ways to export it or connect to a feedback analysis solution through integrations or an API.
Utilize untapped qualitative data channels
There are many online qualitative data sources you may not have considered. For example, you can find useful qualitative data in social media channels like Twitter or Facebook. Online forums, review sites, and online communities such as Discourse or Reddit also contain valuable data about your customers, or research questions.
If you are considering performing a qualitative benchmark analysis against competitors - the internet is your best friend, and review analysis is a great place to start. Gathering feedback in competitor reviews on sites like Trustpilot, G2, Capterra, Better Business Bureau or on app stores is a great way to perform a competitor benchmark analysis.
Customer feedback analysis software often has integrations into social media and review sites, or you could use a solution like DataMiner to scrape the reviews.

Step 2: Connect & organize all your qualitative data
Now you all have this qualitative data but there’s a problem, the data is unstructured. Before feedback can be analyzed and assigned any value, it needs to be organized in a single place. Why is this important? Consistency!
If all data is easily accessible in one place and analyzed in a consistent manner, you will have an easier time summarizing and making decisions based on this data.
The manual approach to organizing your data
The classic method of structuring qualitative data is to plot all the raw data you’ve gathered into a spreadsheet.
Typically, research and support teams would share large Excel sheets and different business units would make sense of the qualitative feedback data on their own. Each team collects and organizes the data in a way that best suits them, which means the feedback tends to be kept in separate silos.
An alternative and a more robust solution is to store feedback in a central database, like Snowflake or Amazon Redshift .
Keep in mind that when you organize your data in this way, you are often preparing it to be imported into another software. If you go the route of a database, you would need to use an API to push the feedback into a third-party software.
Computer-assisted qualitative data analysis software (CAQDAS)
Traditionally within the manual analysis approach (but not always), qualitative data is imported into CAQDAS software for coding.
In the early 2000s, CAQDAS software was popularised by developers such as ATLAS.ti, NVivo and MAXQDA and eagerly adopted by researchers to assist with the organizing and coding of data.
The benefits of using computer-assisted qualitative data analysis software:
- Assists in the organizing of your data
- Opens you up to exploring different interpretations of your data analysis
- Allows you to share your dataset easier and allows group collaboration (allows for secondary analysis)
However you still need to code the data, uncover the themes and do the analysis yourself. Therefore it is still a manual approach.

Organizing your qualitative data in a feedback repository
Another solution to organizing your qualitative data is to upload it into a feedback repository where it can be unified with your other data , and easily searchable and taggable. There are a number of software solutions that act as a central repository for your qualitative research data. Here are a couple solutions that you could investigate:
- Dovetail: Dovetail is a research repository with a focus on video and audio transcriptions. You can tag your transcriptions within the platform for theme analysis. You can also upload your other qualitative data such as research reports, survey responses, support conversations, and customer interviews. Dovetail acts as a single, searchable repository. And makes it easier to collaborate with other people around your qualitative research.
- EnjoyHQ: EnjoyHQ is another research repository with similar functionality to Dovetail. It boasts a more sophisticated search engine, but it has a higher starting subscription cost.
Organizing your qualitative data in a feedback analytics platform
If you have a lot of qualitative customer or employee feedback, from the likes of customer surveys or employee surveys, you will benefit from a feedback analytics platform. A feedback analytics platform is a software that automates the process of both sentiment analysis and thematic analysis . Companies use the integrations offered by these platforms to directly tap into their qualitative data sources (review sites, social media, survey responses, etc.). The data collected is then organized and analyzed consistently within the platform.
If you have data prepared in a spreadsheet, it can also be imported into feedback analytics platforms.
Once all this rich data has been organized within the feedback analytics platform, it is ready to be coded and themed, within the same platform. Thematic is a feedback analytics platform that offers one of the largest libraries of integrations with qualitative data sources.

Step 3: Coding your qualitative data
Your feedback data is now organized in one place. Either within your spreadsheet, CAQDAS, feedback repository or within your feedback analytics platform. The next step is to code your feedback data so we can extract meaningful insights in the next step.
Coding is the process of labelling and organizing your data in such a way that you can then identify themes in the data, and the relationships between these themes.
To simplify the coding process, you will take small samples of your customer feedback data, come up with a set of codes, or categories capturing themes, and label each piece of feedback, systematically, for patterns and meaning. Then you will take a larger sample of data, revising and refining the codes for greater accuracy and consistency as you go.
If you choose to use a feedback analytics platform, much of this process will be automated and accomplished for you.
The terms to describe different categories of meaning (‘theme’, ‘code’, ‘tag’, ‘category’ etc) can be confusing as they are often used interchangeably. For clarity, this article will use the term ‘code’.
To code means to identify key words or phrases and assign them to a category of meaning. “I really hate the customer service of this computer software company” would be coded as “poor customer service”.
How to manually code your qualitative data
- Decide whether you will use deductive or inductive coding. Deductive coding is when you create a list of predefined codes, and then assign them to the qualitative data. Inductive coding is the opposite of this, you create codes based on the data itself. Codes arise directly from the data and you label them as you go. You need to weigh up the pros and cons of each coding method and select the most appropriate.
- Read through the feedback data to get a broad sense of what it reveals. Now it’s time to start assigning your first set of codes to statements and sections of text.
- Keep repeating step 2, adding new codes and revising the code description as often as necessary. Once it has all been coded, go through everything again, to be sure there are no inconsistencies and that nothing has been overlooked.
- Create a code frame to group your codes. The coding frame is the organizational structure of all your codes. And there are two commonly used types of coding frames, flat, or hierarchical. A hierarchical code frame will make it easier for you to derive insights from your analysis.
- Based on the number of times a particular code occurs, you can now see the common themes in your feedback data. This is insightful! If ‘bad customer service’ is a common code, it’s time to take action.
We have a detailed guide dedicated to manually coding your qualitative data .

Using software to speed up manual coding of qualitative data
An Excel spreadsheet is still a popular method for coding. But various software solutions can help speed up this process. Here are some examples.
- CAQDAS / NVivo - CAQDAS software has built-in functionality that allows you to code text within their software. You may find the interface the software offers easier for managing codes than a spreadsheet.
- Dovetail/EnjoyHQ - You can tag transcripts and other textual data within these solutions. As they are also repositories you may find it simpler to keep the coding in one platform.
- IBM SPSS - SPSS is a statistical analysis software that may make coding easier than in a spreadsheet.
- Ascribe - Ascribe’s ‘Coder’ is a coding management system. Its user interface will make it easier for you to manage your codes.
Automating the qualitative coding process using thematic analysis software
In solutions which speed up the manual coding process, you still have to come up with valid codes and often apply codes manually to pieces of feedback. But there are also solutions that automate both the discovery and the application of codes.
Advances in machine learning have now made it possible to read, code and structure qualitative data automatically. This type of automated coding is offered by thematic analysis software .
Automation makes it far simpler and faster to code the feedback and group it into themes. By incorporating natural language processing (NLP) into the software, the AI looks across sentences and phrases to identify common themes meaningful statements. Some automated solutions detect repeating patterns and assign codes to them, others make you train the AI by providing examples. You could say that the AI learns the meaning of the feedback on its own.
Thematic automates the coding of qualitative feedback regardless of source. There’s no need to set up themes or categories in advance. Simply upload your data and wait a few minutes. You can also manually edit the codes to further refine their accuracy. Experiments conducted indicate that Thematic’s automated coding is just as accurate as manual coding .
Paired with sentiment analysis and advanced text analytics - these automated solutions become powerful for deriving quality business or research insights.
You could also build your own , if you have the resources!
The key benefits of using an automated coding solution
Automated analysis can often be set up fast and there’s the potential to uncover things that would never have been revealed if you had given the software a prescribed list of themes to look for.
Because the model applies a consistent rule to the data, it captures phrases or statements that a human eye might have missed.
Complete and consistent analysis of customer feedback enables more meaningful findings. Leading us into step 4.
Step 4: Analyze your data: Find meaningful insights
Now we are going to analyze our data to find insights. This is where we start to answer our research questions. Keep in mind that step 4 and step 5 (tell the story) have some overlap . This is because creating visualizations is both part of analysis process and reporting.
The task of uncovering insights is to scour through the codes that emerge from the data and draw meaningful correlations from them. It is also about making sure each insight is distinct and has enough data to support it.
Part of the analysis is to establish how much each code relates to different demographics and customer profiles, and identify whether there’s any relationship between these data points.
Manually create sub-codes to improve the quality of insights
If your code frame only has one level, you may find that your codes are too broad to be able to extract meaningful insights. This is where it is valuable to create sub-codes to your primary codes. This process is sometimes referred to as meta coding.
Note: If you take an inductive coding approach, you can create sub-codes as you are reading through your feedback data and coding it.
While time-consuming, this exercise will improve the quality of your analysis. Here is an example of what sub-codes could look like.

You need to carefully read your qualitative data to create quality sub-codes. But as you can see, the depth of analysis is greatly improved. By calculating the frequency of these sub-codes you can get insight into which customer service problems you can immediately address.
Correlate the frequency of codes to customer segments
Many businesses use customer segmentation . And you may have your own respondent segments that you can apply to your qualitative analysis. Segmentation is the practise of dividing customers or research respondents into subgroups.
Segments can be based on:
- Demographic
- And any other data type that you care to segment by
It is particularly useful to see the occurrence of codes within your segments. If one of your customer segments is considered unimportant to your business, but they are the cause of nearly all customer service complaints, it may be in your best interest to focus attention elsewhere. This is a useful insight!
Manually visualizing coded qualitative data
There are formulas you can use to visualize key insights in your data. The formulas we will suggest are imperative if you are measuring a score alongside your feedback.
If you are collecting a metric alongside your qualitative data this is a key visualization. Impact answers the question: “What’s the impact of a code on my overall score?”. Using Net Promoter Score (NPS) as an example, first you need to:
- Calculate overall NPS
- Calculate NPS in the subset of responses that do not contain that theme
- Subtract B from A
Then you can use this simple formula to calculate code impact on NPS .

You can then visualize this data using a bar chart.
You can download our CX toolkit - it includes a template to recreate this.
Trends over time
This analysis can help you answer questions like: “Which codes are linked to decreases or increases in my score over time?”
We need to compare two sequences of numbers: NPS over time and code frequency over time . Using Excel, calculate the correlation between the two sequences, which can be either positive (the more codes the higher the NPS, see picture below), or negative (the more codes the lower the NPS).
Now you need to plot code frequency against the absolute value of code correlation with NPS. Here is the formula:

The visualization could look like this:

These are two examples, but there are more. For a third manual formula, and to learn why word clouds are not an insightful form of analysis, read our visualizations article .
Using a text analytics solution to automate analysis
Automated text analytics solutions enable codes and sub-codes to be pulled out of the data automatically. This makes it far faster and easier to identify what’s driving negative or positive results. And to pick up emerging trends and find all manner of rich insights in the data.
Another benefit of AI-driven text analytics software is its built-in capability for sentiment analysis, which provides the emotive context behind your feedback and other qualitative textual data therein.
Thematic provides text analytics that goes further by allowing users to apply their expertise on business context to edit or augment the AI-generated outputs.
Since the move away from manual research is generally about reducing the human element, adding human input to the technology might sound counter-intuitive. However, this is mostly to make sure important business nuances in the feedback aren’t missed during coding. The result is a higher accuracy of analysis. This is sometimes referred to as augmented intelligence .

Step 5: Report on your data: Tell the story
The last step of analyzing your qualitative data is to report on it, to tell the story. At this point, the codes are fully developed and the focus is on communicating the narrative to the audience.
A coherent outline of the qualitative research, the findings and the insights is vital for stakeholders to discuss and debate before they can devise a meaningful course of action.
Creating graphs and reporting in Powerpoint
Typically, qualitative researchers take the tried and tested approach of distilling their report into a series of charts, tables and other visuals which are woven into a narrative for presentation in Powerpoint.
Using visualization software for reporting
With data transformation and APIs, the analyzed data can be shared with data visualisation software, such as Power BI or Tableau , Google Studio or Looker. Power BI and Tableau are among the most preferred options.
Visualizing your insights inside a feedback analytics platform
Feedback analytics platforms, like Thematic, incorporate visualisation tools that intuitively turn key data and insights into graphs. This removes the time consuming work of constructing charts to visually identify patterns and creates more time to focus on building a compelling narrative that highlights the insights, in bite-size chunks, for executive teams to review.
Using a feedback analytics platform with visualization tools means you don’t have to use a separate product for visualizations. You can export graphs into Powerpoints straight from the platforms.

Conclusion - Manual or Automated?
There are those who remain deeply invested in the manual approach - because it’s familiar, because they’re reluctant to spend money and time learning new software, or because they’ve been burned by the overpromises of AI.
For projects that involve small datasets, manual analysis makes sense. For example, if the objective is simply to quantify a simple question like “Do customers prefer X concepts to Y?”. If the findings are being extracted from a small set of focus groups and interviews, sometimes it’s easier to just read them
However, as new generations come into the workplace, it’s technology-driven solutions that feel more comfortable and practical. And the merits are undeniable. Especially if the objective is to go deeper and understand the ‘why’ behind customers’ preference for X or Y. And even more especially if time and money are considerations.
The ability to collect a free flow of qualitative feedback data at the same time as the metric means AI can cost-effectively scan, crunch, score and analyze a ton of feedback from one system in one go. And time-intensive processes like focus groups, or coding, that used to take weeks, can now be completed in a matter of hours or days.
But aside from the ever-present business case to speed things up and keep costs down, there are also powerful research imperatives for automated analysis of qualitative data: namely, accuracy and consistency.
Finding insights hidden in feedback requires consistency, especially in coding. Not to mention catching all the ‘unknown unknowns’ that can skew research findings and steering clear of cognitive bias.
Some say without manual data analysis researchers won’t get an accurate “feel” for the insights. However, the larger data sets are, the harder it is to sort through the feedback and organize feedback that has been pulled from different places. And, the more difficult it is to stay on course, the greater the risk of drawing incorrect, or incomplete, conclusions grows.
Though the process steps for qualitative data analysis have remained pretty much unchanged since psychologist Paul Felix Lazarsfeld paved the path a hundred years ago, the impact digital technology has had on types of qualitative feedback data and the approach to the analysis are profound.
If you want to try an automated feedback analysis solution on your own qualitative data, you can get started with Thematic .

Community & Marketing
Tyler manages our community of CX, insights & analytics professionals. Tyler's goal is to help unite insights professionals around common challenges.
We make it easy to discover the customer and product issues that matter.
Unlock the value of feedback at scale, in one platform. Try it for free now!
- Questions to ask your Feedback Analytics vendor
- How to end customer churn for good
- Scalable analysis of NPS verbatims
- 5 Text analytics approaches
- How to calculate the ROI of CX
Our experts will show you how Thematic works, how to discover pain points and track the ROI of decisions. To access your free trial, book a personal demo today.
Recent posts
When two major storms wreaked havoc on Auckland and Watercare’s infrastructurem the utility went through a CX crisis. With a massive influx of calls to their support center, Thematic helped them get inisghts from this data to forge a new approach to restore services and satisfaction levels.
Become a qualitative theming pro! Creating a perfect code frame is hard, but thematic analysis software makes the process much easier.
Qualtrics is one of the most well-known and powerful Customer Feedback Management platforms. But even so, it has limitations. We recently hosted a live panel where data analysts from two well-known brands shared their experiences with Qualtrics, and how they extended this platform’s capabilities. Below, we’ll share the

The Ultimate Guide to Qualitative Research - Part 2: Handling Qualitative Data

- Handling qualitative data
- Transcripts
- Field notes
- Survey data and responses
- Visual and audio data
- Data organization
- Data coding
- Coding frame
- Auto and smart coding
- Organizing codes
- Introduction
What is qualitative data analysis?
Qualitative data analysis methods, how do you analyze qualitative data, content analysis, thematic analysis.
- Thematic analysis vs. content analysis
- Narrative research
Phenomenological research
Discourse analysis, grounded theory.
- Deductive reasoning
- Inductive reasoning
- Inductive vs. deductive reasoning
- Qualitative data interpretation
- Qualitative analysis software
Qualitative data analysis
Analyzing qualitative data is the next step after you have completed the use of qualitative data collection methods . The qualitative analysis process aims to identify themes and patterns that emerge across the data.

In simplified terms, qualitative research methods involve non-numerical data collection followed by an explanation based on the attributes of the data . For example, if you are asked to explain in qualitative terms a thermal image displayed in multiple colors, then you would explain the color differences rather than the heat's numerical value. If you have a large amount of data (e.g., of group discussions or observations of real-life situations), the next step is to transcribe and prepare the raw data for subsequent analysis.
Researchers can conduct studies fully based on qualitative methodology, or researchers can preface a quantitative research study with a qualitative study to identify issues that were not originally envisioned but are important to the study. Quantitative researchers may also collect and analyze qualitative data following their quantitative analyses to better understand the meanings behind their statistical results.
Conducting qualitative research can especially help build an understanding of how and why certain outcomes were achieved (in addition to what was achieved). For example, qualitative data analysis is often used for policy and program evaluation research since it can answer certain important questions more efficiently and effectively than quantitative approaches.

Qualitative data analysis can also answer important questions about the relevance, unintended effects, and impact of programs, such as:
- Were expectations reasonable?
- Did processes operate as expected?
- Were key players able to carry out their duties?
- Were there any unintended effects of the program?
The importance of qualitative data analysis
Qualitative approaches have the advantage of allowing for more diversity in responses and the capacity to adapt to new developments or issues during the research process itself. While qualitative analysis of data can be demanding and time-consuming to conduct, many fields of research utilize qualitative software tools that have been specifically developed to provide more succinct, cost-efficient, and timely results.
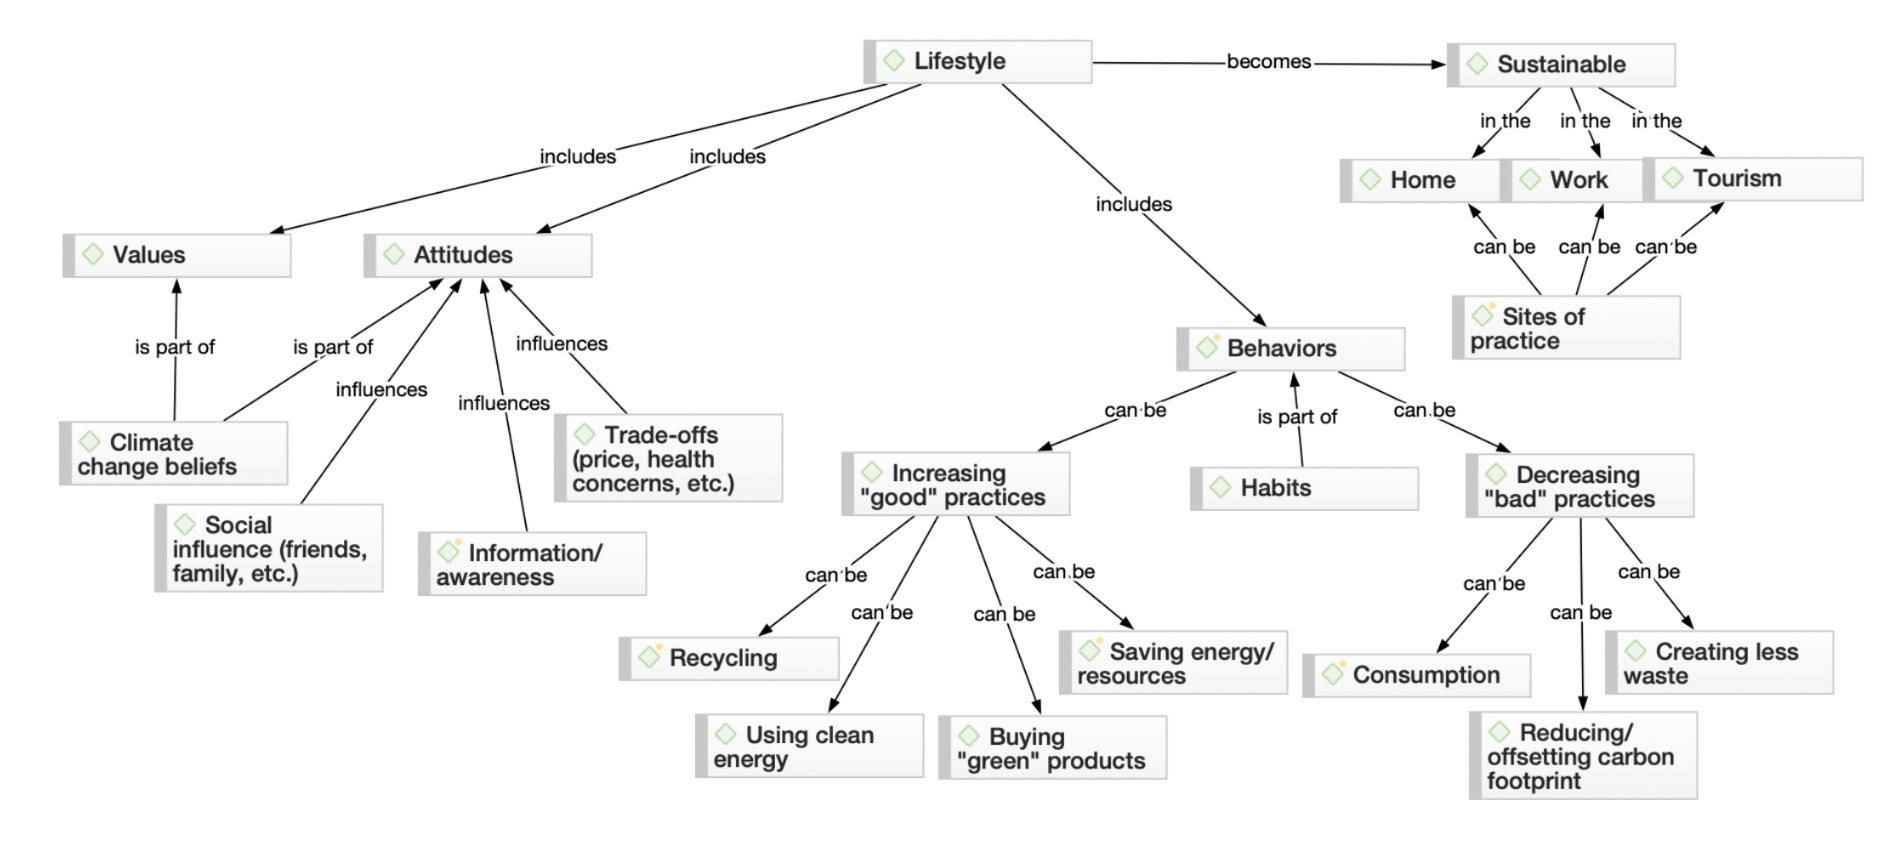
Qualitative data analysis is an important part of research and building greater understanding across fields for a number of reasons. First, cases for qualitative data analysis can be selected purposefully according to whether they typify certain characteristics or contextual locations. In other words, qualitative data permits deep immersion into a topic, phenomenon, or area of interest. Rather than seeking generalizability to the population the sample of participants represent, qualitative research aims to construct an in-depth and nuanced understanding of the research topic.
Secondly, the role or position of the researcher in qualitative analysis of data is given greater critical attention. This is because, in qualitative data analysis, the possibility of the researcher taking a ‘neutral' or transcendent position is seen as more problematic in practical and/or philosophical terms. Hence, qualitative researchers are often exhorted to reflect on their role in the research process and make this clear in the analysis.

Thirdly, while qualitative data analysis can take a wide variety of forms, it largely differs from quantitative research in the focus on language, signs, experiences, and meaning. In addition, qualitative approaches to analysis are often holistic and contextual rather than analyzing the data in a piecemeal fashion or removing the data from its context. Qualitative approaches thus allow researchers to explore inquiries from directions that could not be accessed with only numerical quantitative data.
Establishing research rigor
Systematic and transparent approaches to the analysis of qualitative data are essential for rigor . For example, many qualitative research methods require researchers to carefully code data and discern and document themes in a consistent and credible way.
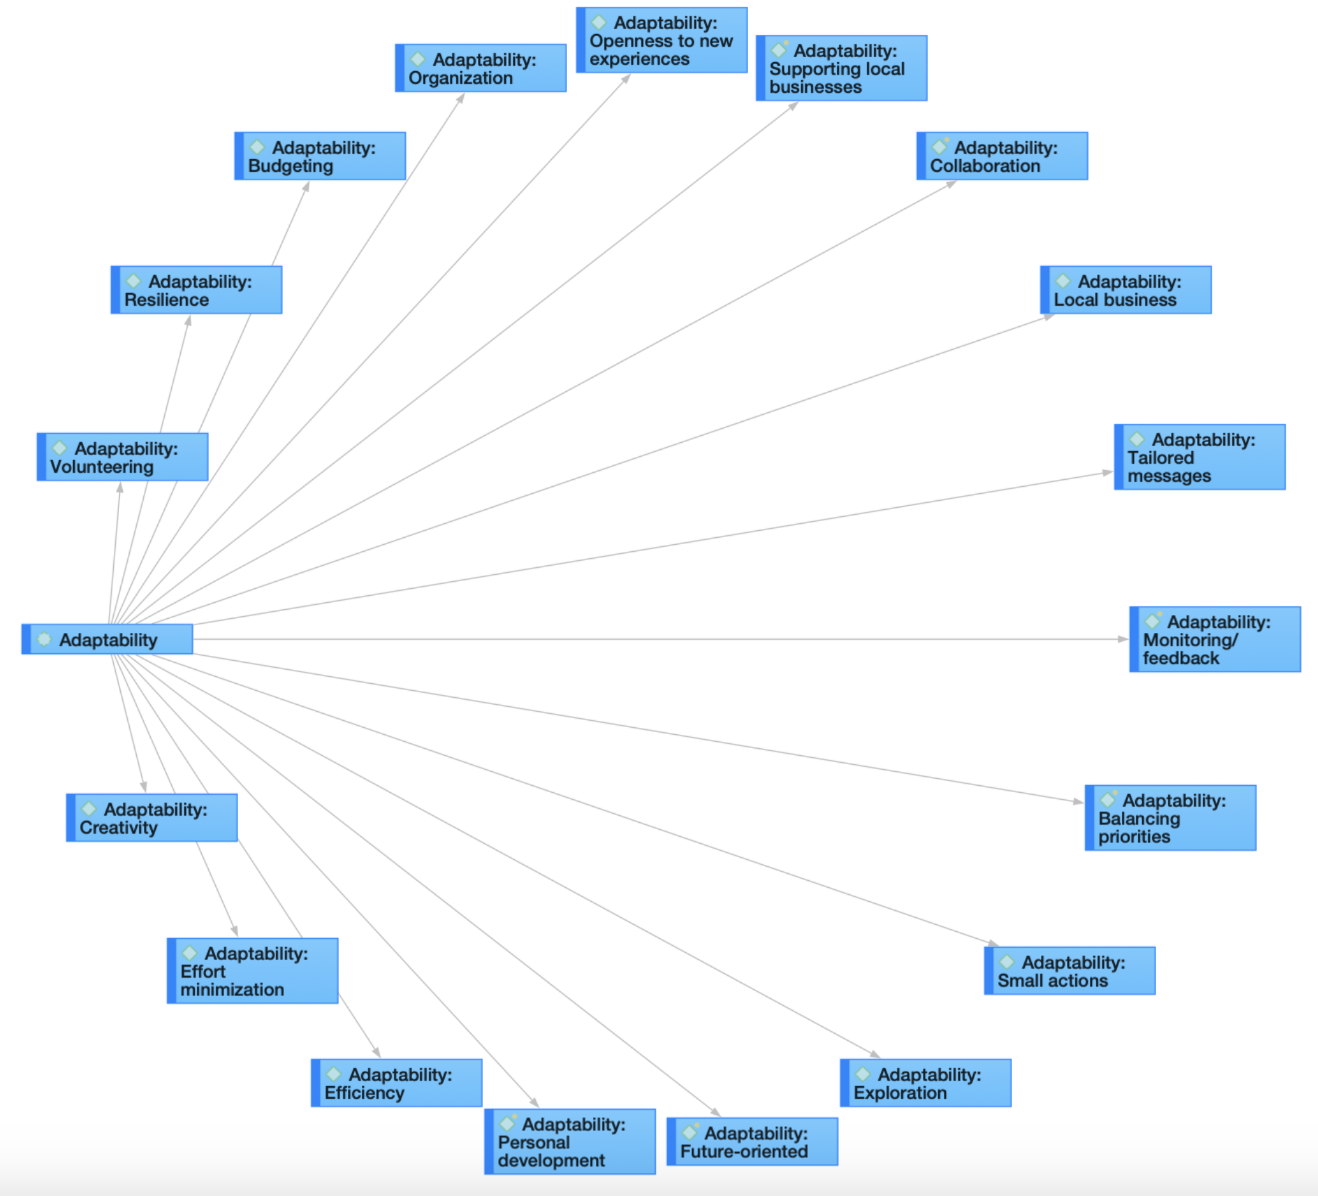
Perhaps the most traditional division in the way qualitative and quantitative research have been used in the social sciences is for qualitative methods to be used for exploratory purposes (e.g., to generate new theory or propositions) or to explain puzzling quantitative results, while quantitative methods are used to test hypotheses .

After you’ve collected relevant data , what is the best way to look at your data ? As always, it will depend on your research question . For instance, if you employed an observational research method to learn about a group’s shared practices, an ethnographic approach could be appropriate to explain the various dimensions of culture. If you collected textual data to understand how people talk about something, then a discourse analysis approach might help you generate key insights about language and communication.

The qualitative data coding process involves iterative categorization and recategorization, ensuring the evolution of the analysis to best represent the data. The procedure typically concludes with the interpretation of patterns and trends identified through the coding process.
To start off, let’s look at two broad approaches to data analysis.
Deductive analysis
Deductive analysis is guided by pre-existing theories or ideas. It starts with a theoretical framework , which is then used to code the data. The researcher can thus use this theoretical framework to interpret their data and answer their research question .
The key steps include coding the data based on the predetermined concepts or categories and using the theory to guide the interpretation of patterns among the codings. Deductive analysis is particularly useful when researchers aim to verify or extend an existing theory within a new context.
Inductive analysis
Inductive analysis involves the generation of new theories or ideas based on the data. The process starts without any preconceived theories or codes, and patterns, themes, and categories emerge out of the data.

The researcher codes the data to capture any concepts or patterns that seem interesting or important to the research question . These codes are then compared and linked, leading to the formation of broader categories or themes. The main goal of inductive analysis is to allow the data to 'speak for itself' rather than imposing pre-existing expectations or ideas onto the data.
Deductive and inductive approaches can be seen as sitting on opposite poles, and all research falls somewhere within that spectrum. Most often, qualitative analysis approaches blend both deductive and inductive elements to contribute to the existing conversation around a topic while remaining open to potential unexpected findings. To help you make informed decisions about which qualitative data analysis approach fits with your research objectives, let's look at some of the common approaches for qualitative data analysis.
Content analysis is a research method used to identify patterns and themes within qualitative data. This approach involves systematically coding and categorizing specific aspects of the content in the data to uncover trends and patterns. An often important part of content analysis is quantifying frequencies and patterns of words or characteristics present in the data .
It is a highly flexible technique that can be adapted to various data types , including text, images, and audiovisual content . While content analysis can be exploratory in nature, it is also common to use pre-established theories and follow a more deductive approach to categorizing and quantifying the qualitative data.
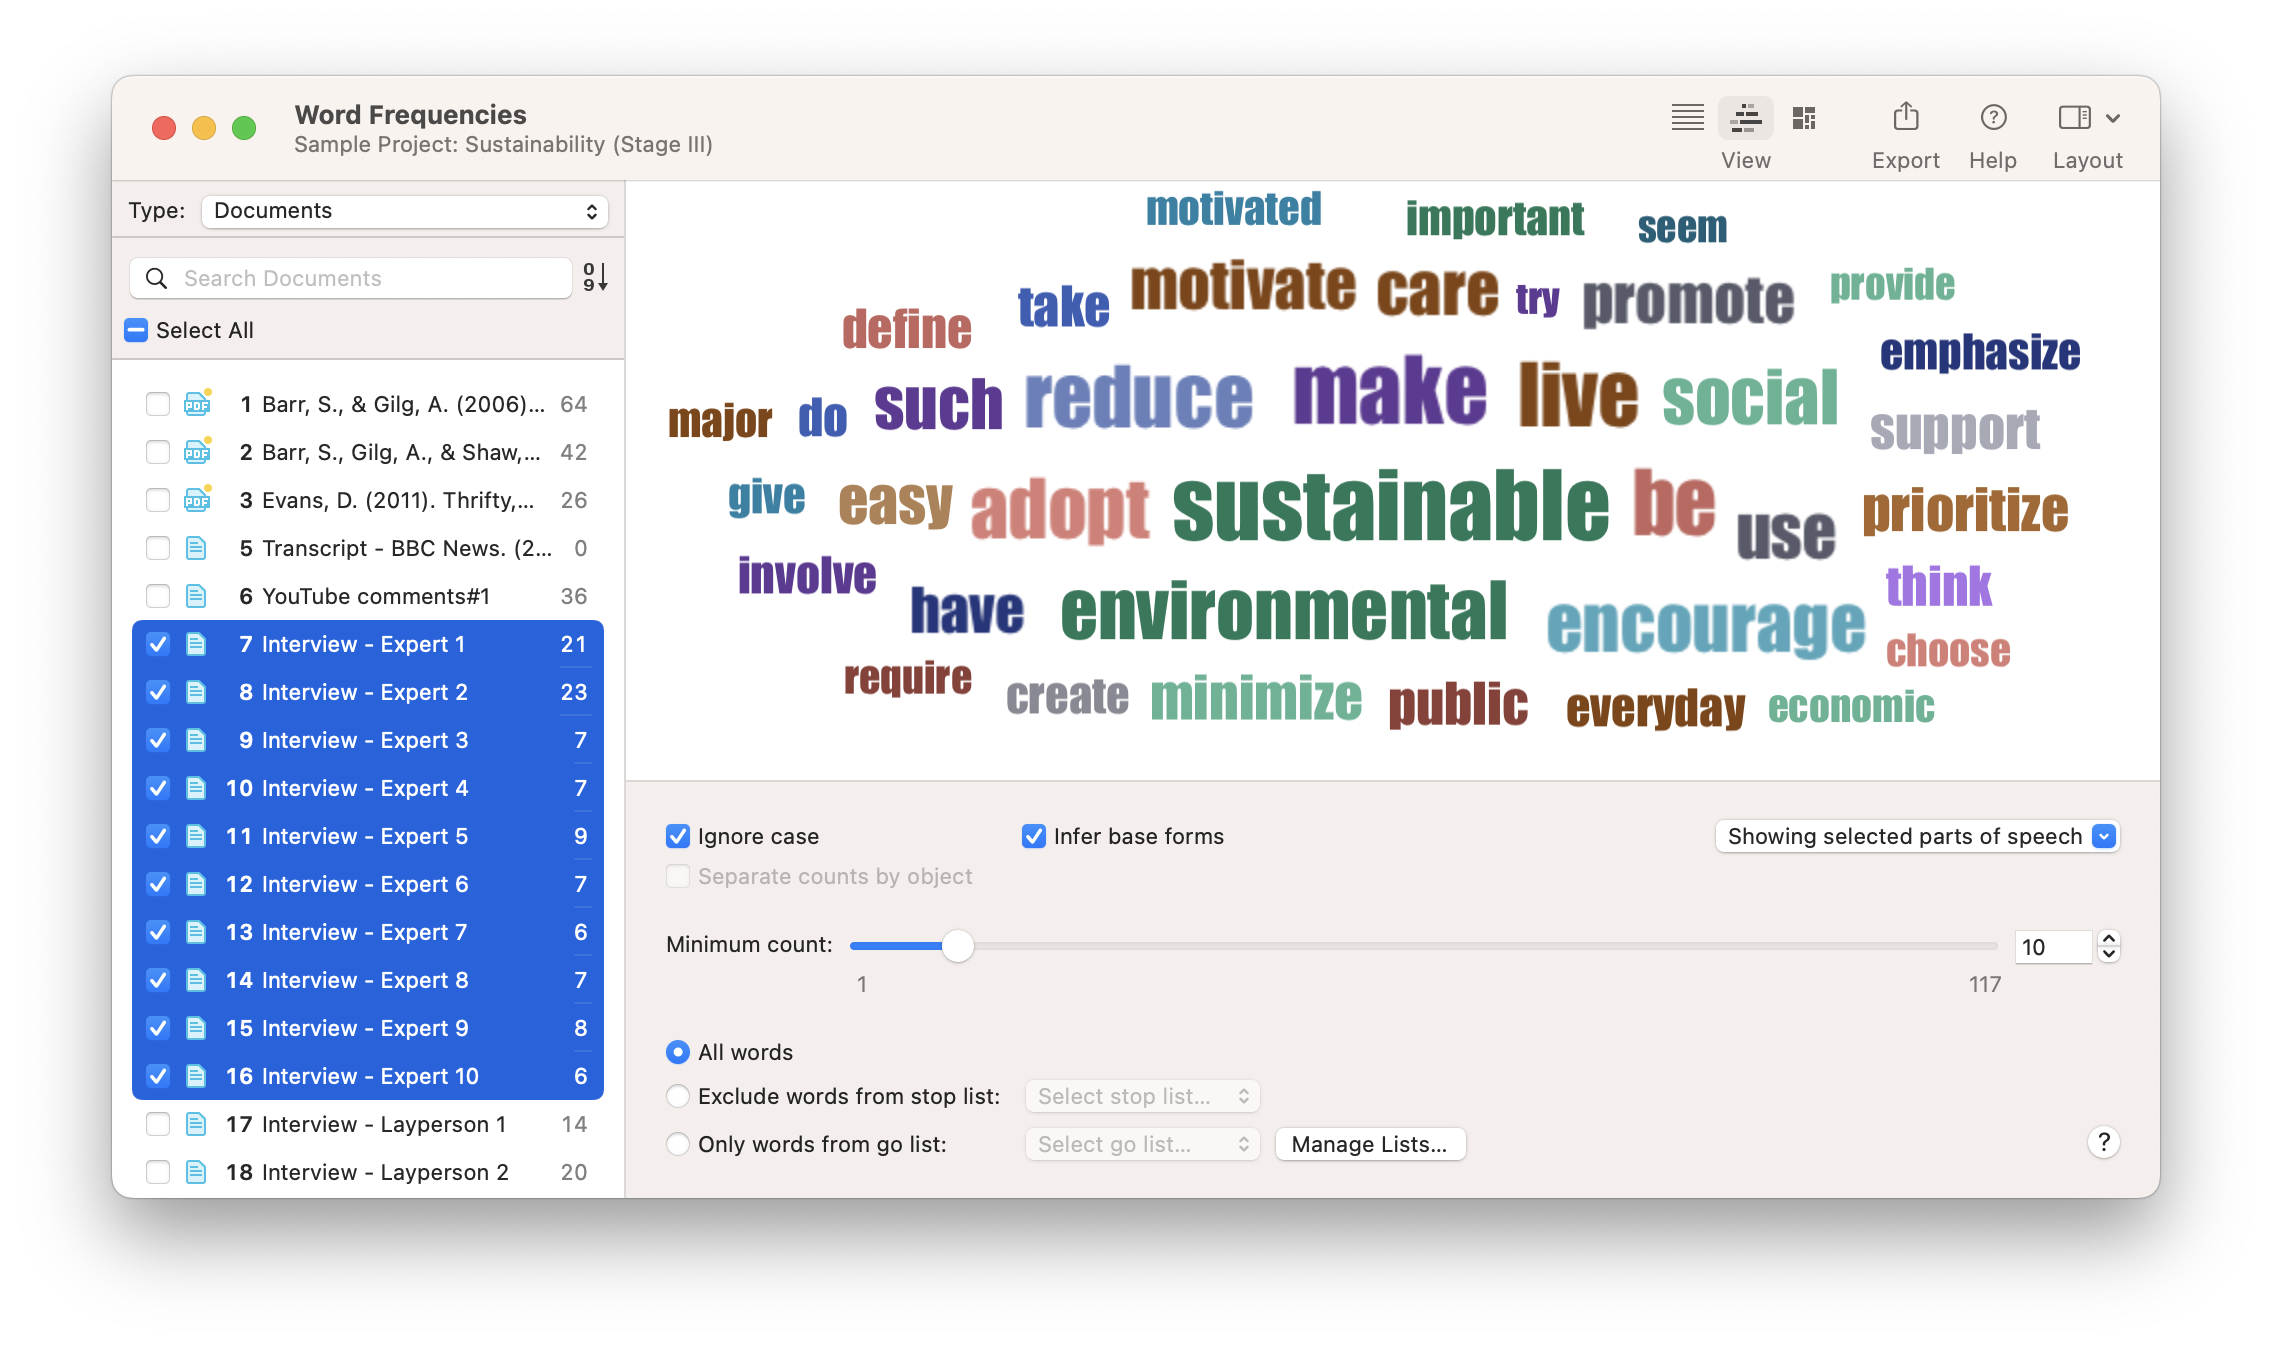
Thematic analysis is a method used to identify, analyze, and report patterns or themes within the data. This approach moves beyond counting explicit words or phrases and focuses on also identifying implicit concepts and themes within the data.

Researchers conduct detailed coding of the data to ascertain repeated themes or patterns of meaning. Codes can be categorized into themes, and the researcher can analyze how the themes relate to one another. Thematic analysis is flexible in terms of the research framework, allowing for both inductive (data-driven) and deductive (theory-driven) approaches. The outcome is a rich, detailed, and complex account of the data.
Grounded theory is a systematic qualitative research methodology that is used to inductively generate theory that is 'grounded' in the data itself. Analysis takes place simultaneously with data collection , and researchers iterate between data collection and analysis until a comprehensive theory is developed.
Grounded theory is characterized by simultaneous data collection and analysis, the development of theoretical codes from the data, purposeful sampling of participants, and the constant comparison of data with emerging categories and concepts. The ultimate goal is to create a theoretical explanation that fits the data and answers the research question .
Discourse analysis is a qualitative research approach that emphasizes the role of language in social contexts. It involves examining communication and language use beyond the level of the sentence, considering larger units of language such as texts or conversations.

Discourse analysts typically investigate how social meanings and understandings are constructed in different contexts, emphasizing the connection between language and power. It can be applied to texts of all kinds, including interviews , documents, case studies , and social media posts.
Phenomenological research focuses on exploring how human beings make sense of an experience and delves into the essence of this experience. It strives to understand people's perceptions, perspectives, and understandings of a particular situation or phenomenon.

It involves in-depth engagement with participants, often through interviews or conversations, to explore their lived experiences. The goal is to derive detailed descriptions of the essence of the experience and to interpret what insights or implications this may bear on our understanding of this phenomenon.

Whatever your data analysis approach, start with ATLAS.ti
Qualitative data analysis done quickly and intuitively with ATLAS.ti. Download a free trial today.
Now that we've summarized the major approaches to data analysis, let's look at the broader process of research and data analysis. Suppose you need to do some research to find answers to any kind of research question, be it an academic inquiry, business problem, or policy decision. In that case, you need to collect some data. There are many methods of collecting data: you can collect primary data yourself by conducting interviews, focus groups , or a survey , for instance. Another option is to use secondary data sources. These are data previously collected for other projects, historical records, reports, statistics – basically everything that exists already and can be relevant to your research.

The data you collect should always be a good fit for your research question . For example, if you are interested in how many people in your target population like your brand compared to others, it is no use to conduct interviews or a few focus groups . The sample will be too small to get a representative picture of the population. If your questions are about "how many….", "what is the spread…" etc., you need to conduct quantitative research . If you are interested in why people like different brands, their motives, and their experiences, then conducting qualitative research can provide you with the answers you are looking for.
Let's describe the important steps involved in conducting research.
Step 1: Planning the research
As the saying goes: "Garbage in, garbage out." Suppose you find out after you have collected data that
- you talked to the wrong people
- asked the wrong questions
- a couple of focus groups sessions would have yielded better results because of the group interaction, or
- a survey including a few open-ended questions sent to a larger group of people would have been sufficient and required less effort.
Think thoroughly about sampling, the questions you will be asking, and in which form. If you conduct a focus group or an interview, you are the research instrument, and your data collection will only be as good as you are. If you have never done it before, seek some training and practice. If you have other people do it, make sure they have the skills.
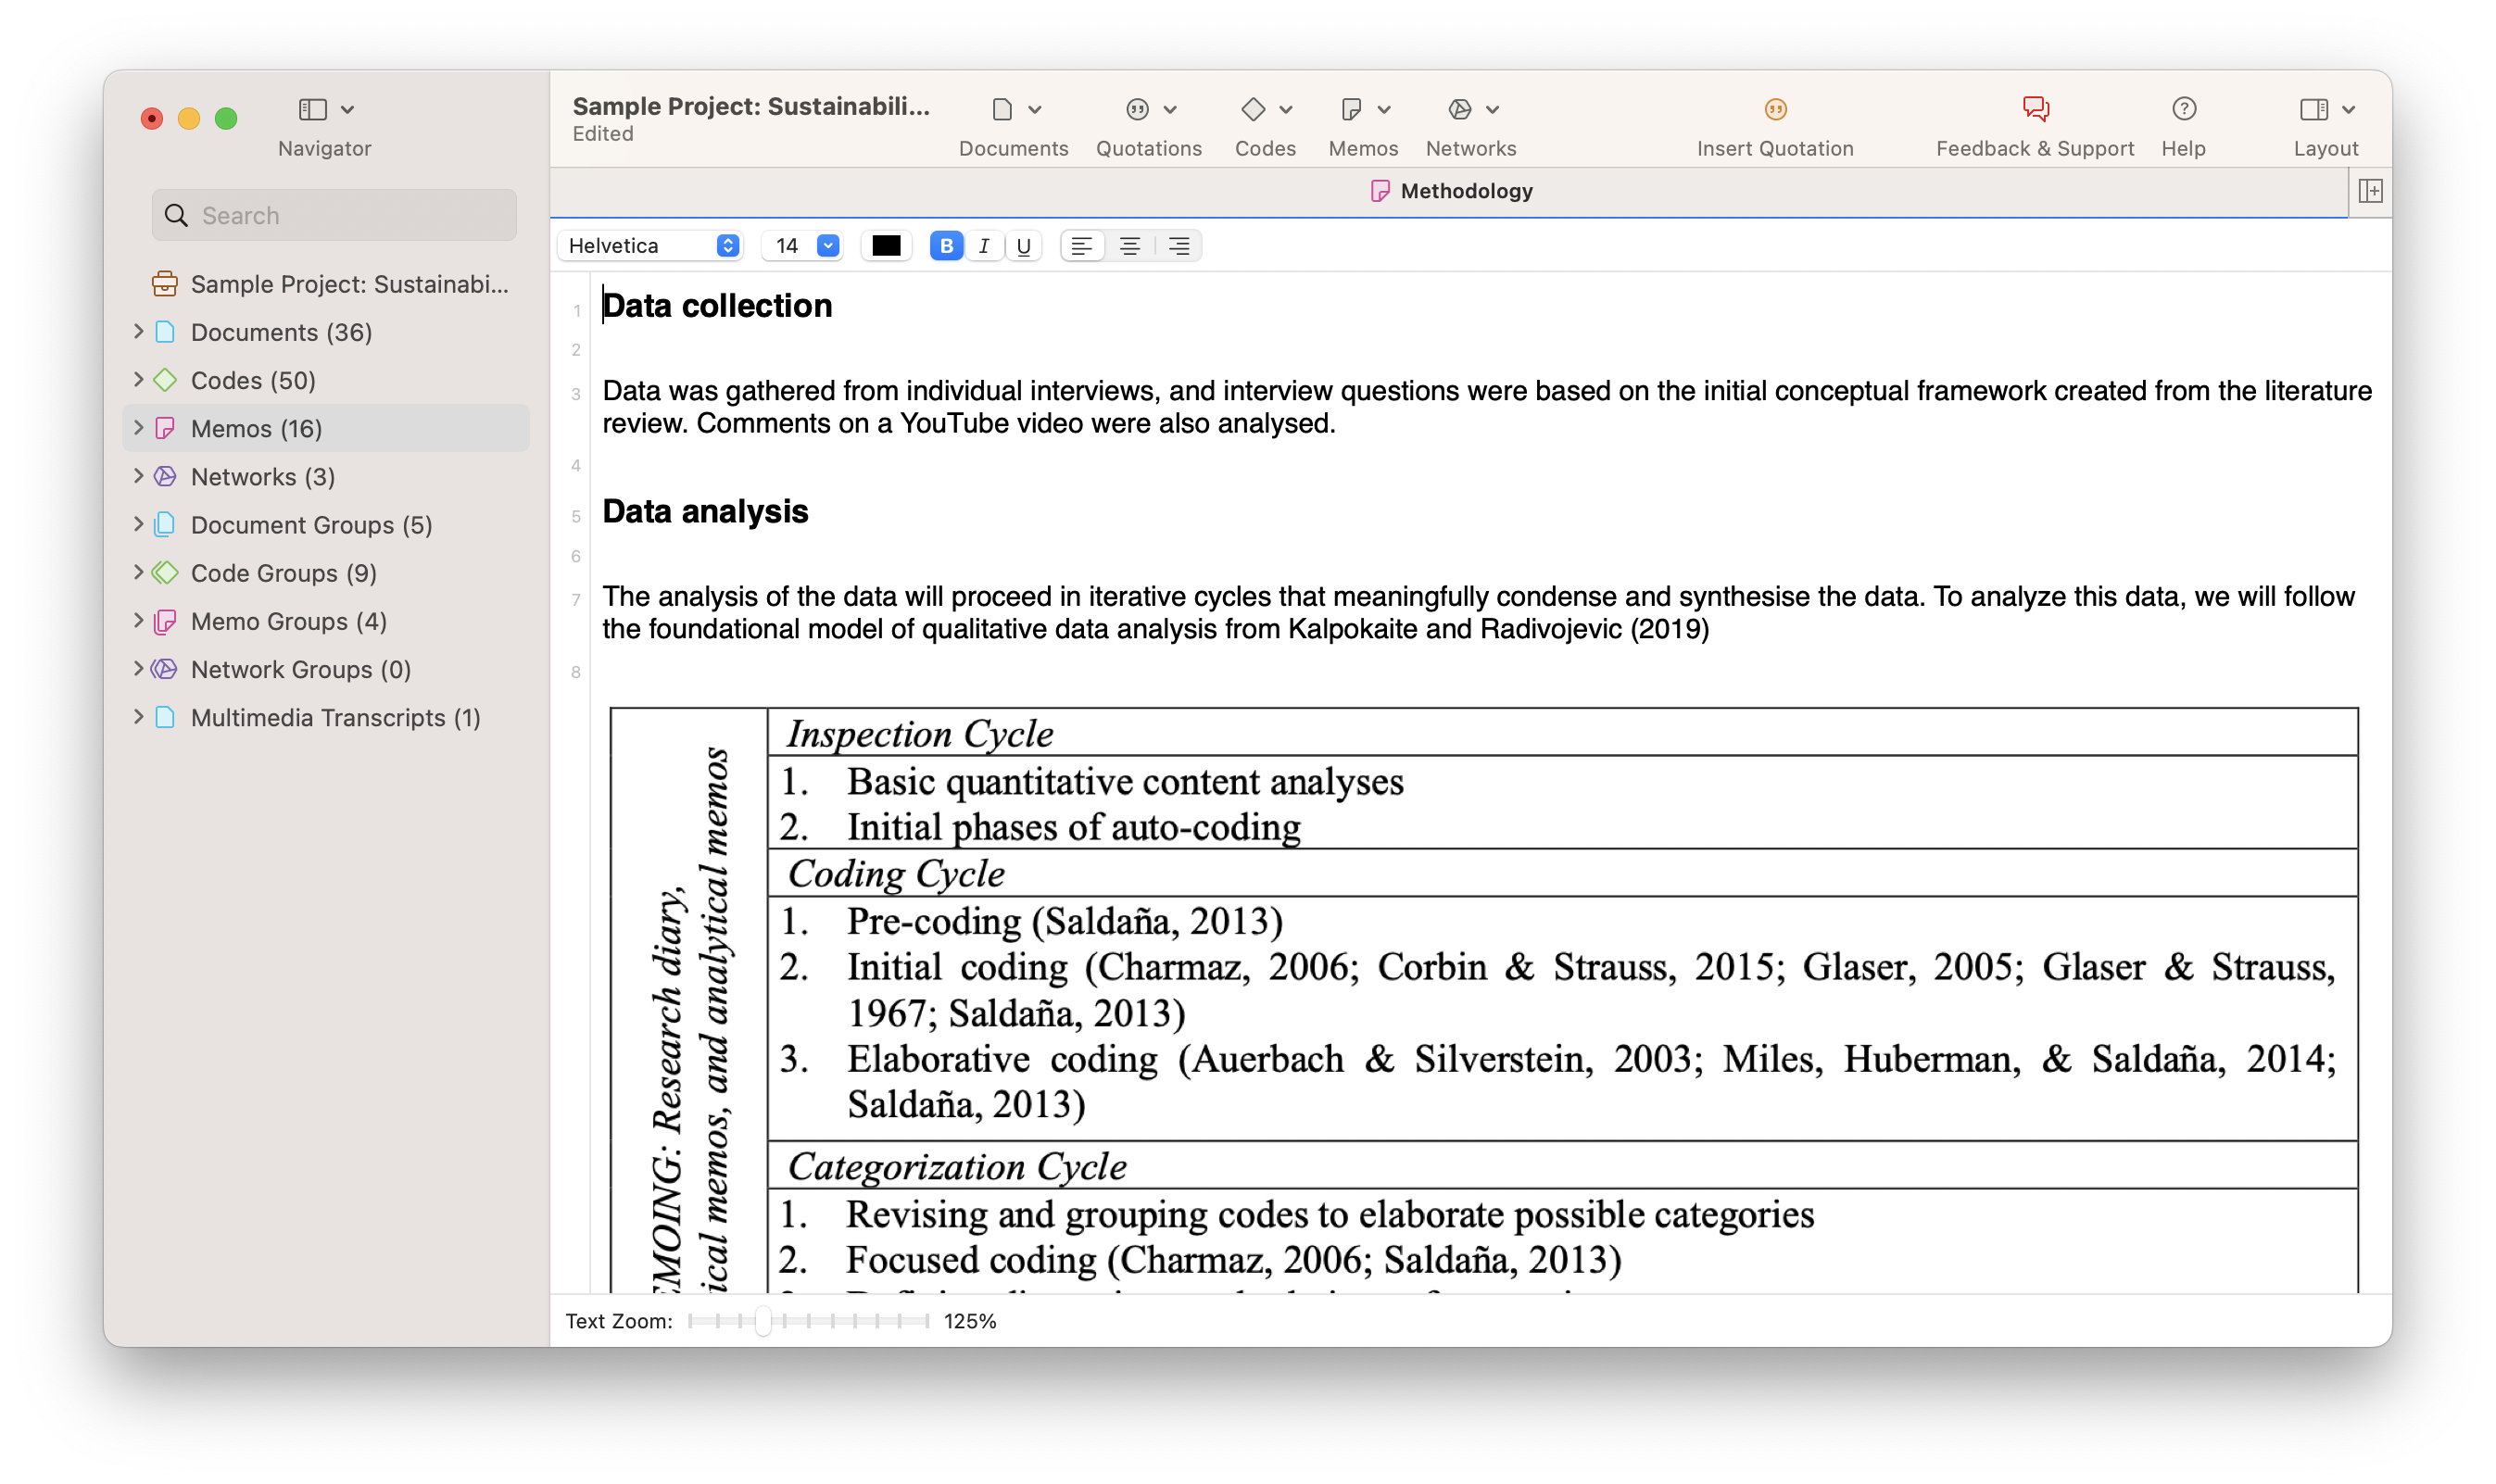
Step 2: Preparing the data
When you conduct focus groups or interviews, think about how to transcribe them. Do you want to run them online or offline? If online, check out which tools can serve your needs, both in terms of functionality and cost. For any audio or video recordings , you can consider using automatic transcription software or services. Automatically generated transcripts can save you time and money, but they still need to be checked. If you don't do this yourself, make sure that you instruct the person doing it on how to prepare the data.
- How should the final transcript be formatted for later analysis?
- Which names and locations should be anonymized?
- What kind of speaker IDs to use?
What about survey data ? Some survey data programs will immediately provide basic descriptive-level analysis of the responses. ATLAS.ti will support you with the analysis of the open-ended questions. For this, you need to export your data as an Excel file. ATLAS.ti's survey import wizard will guide you through the process.
Other kinds of data such as images, videos, audio recordings, text, and more can be imported to ATLAS.ti. You can organize all your data into groups and write comments on each source of data to maintain a systematic organization and documentation of your data.

Step 3: Exploratory data analysis
You can run a few simple exploratory analyses to get to know your data. For instance, you can create a word list or word cloud of all your text data or compare and contrast the words in different documents. You can also let ATLAS.ti find relevant concepts for you. There are many tools available that can automatically code your text data, so you can also use these codings to explore your data and refine your coding.
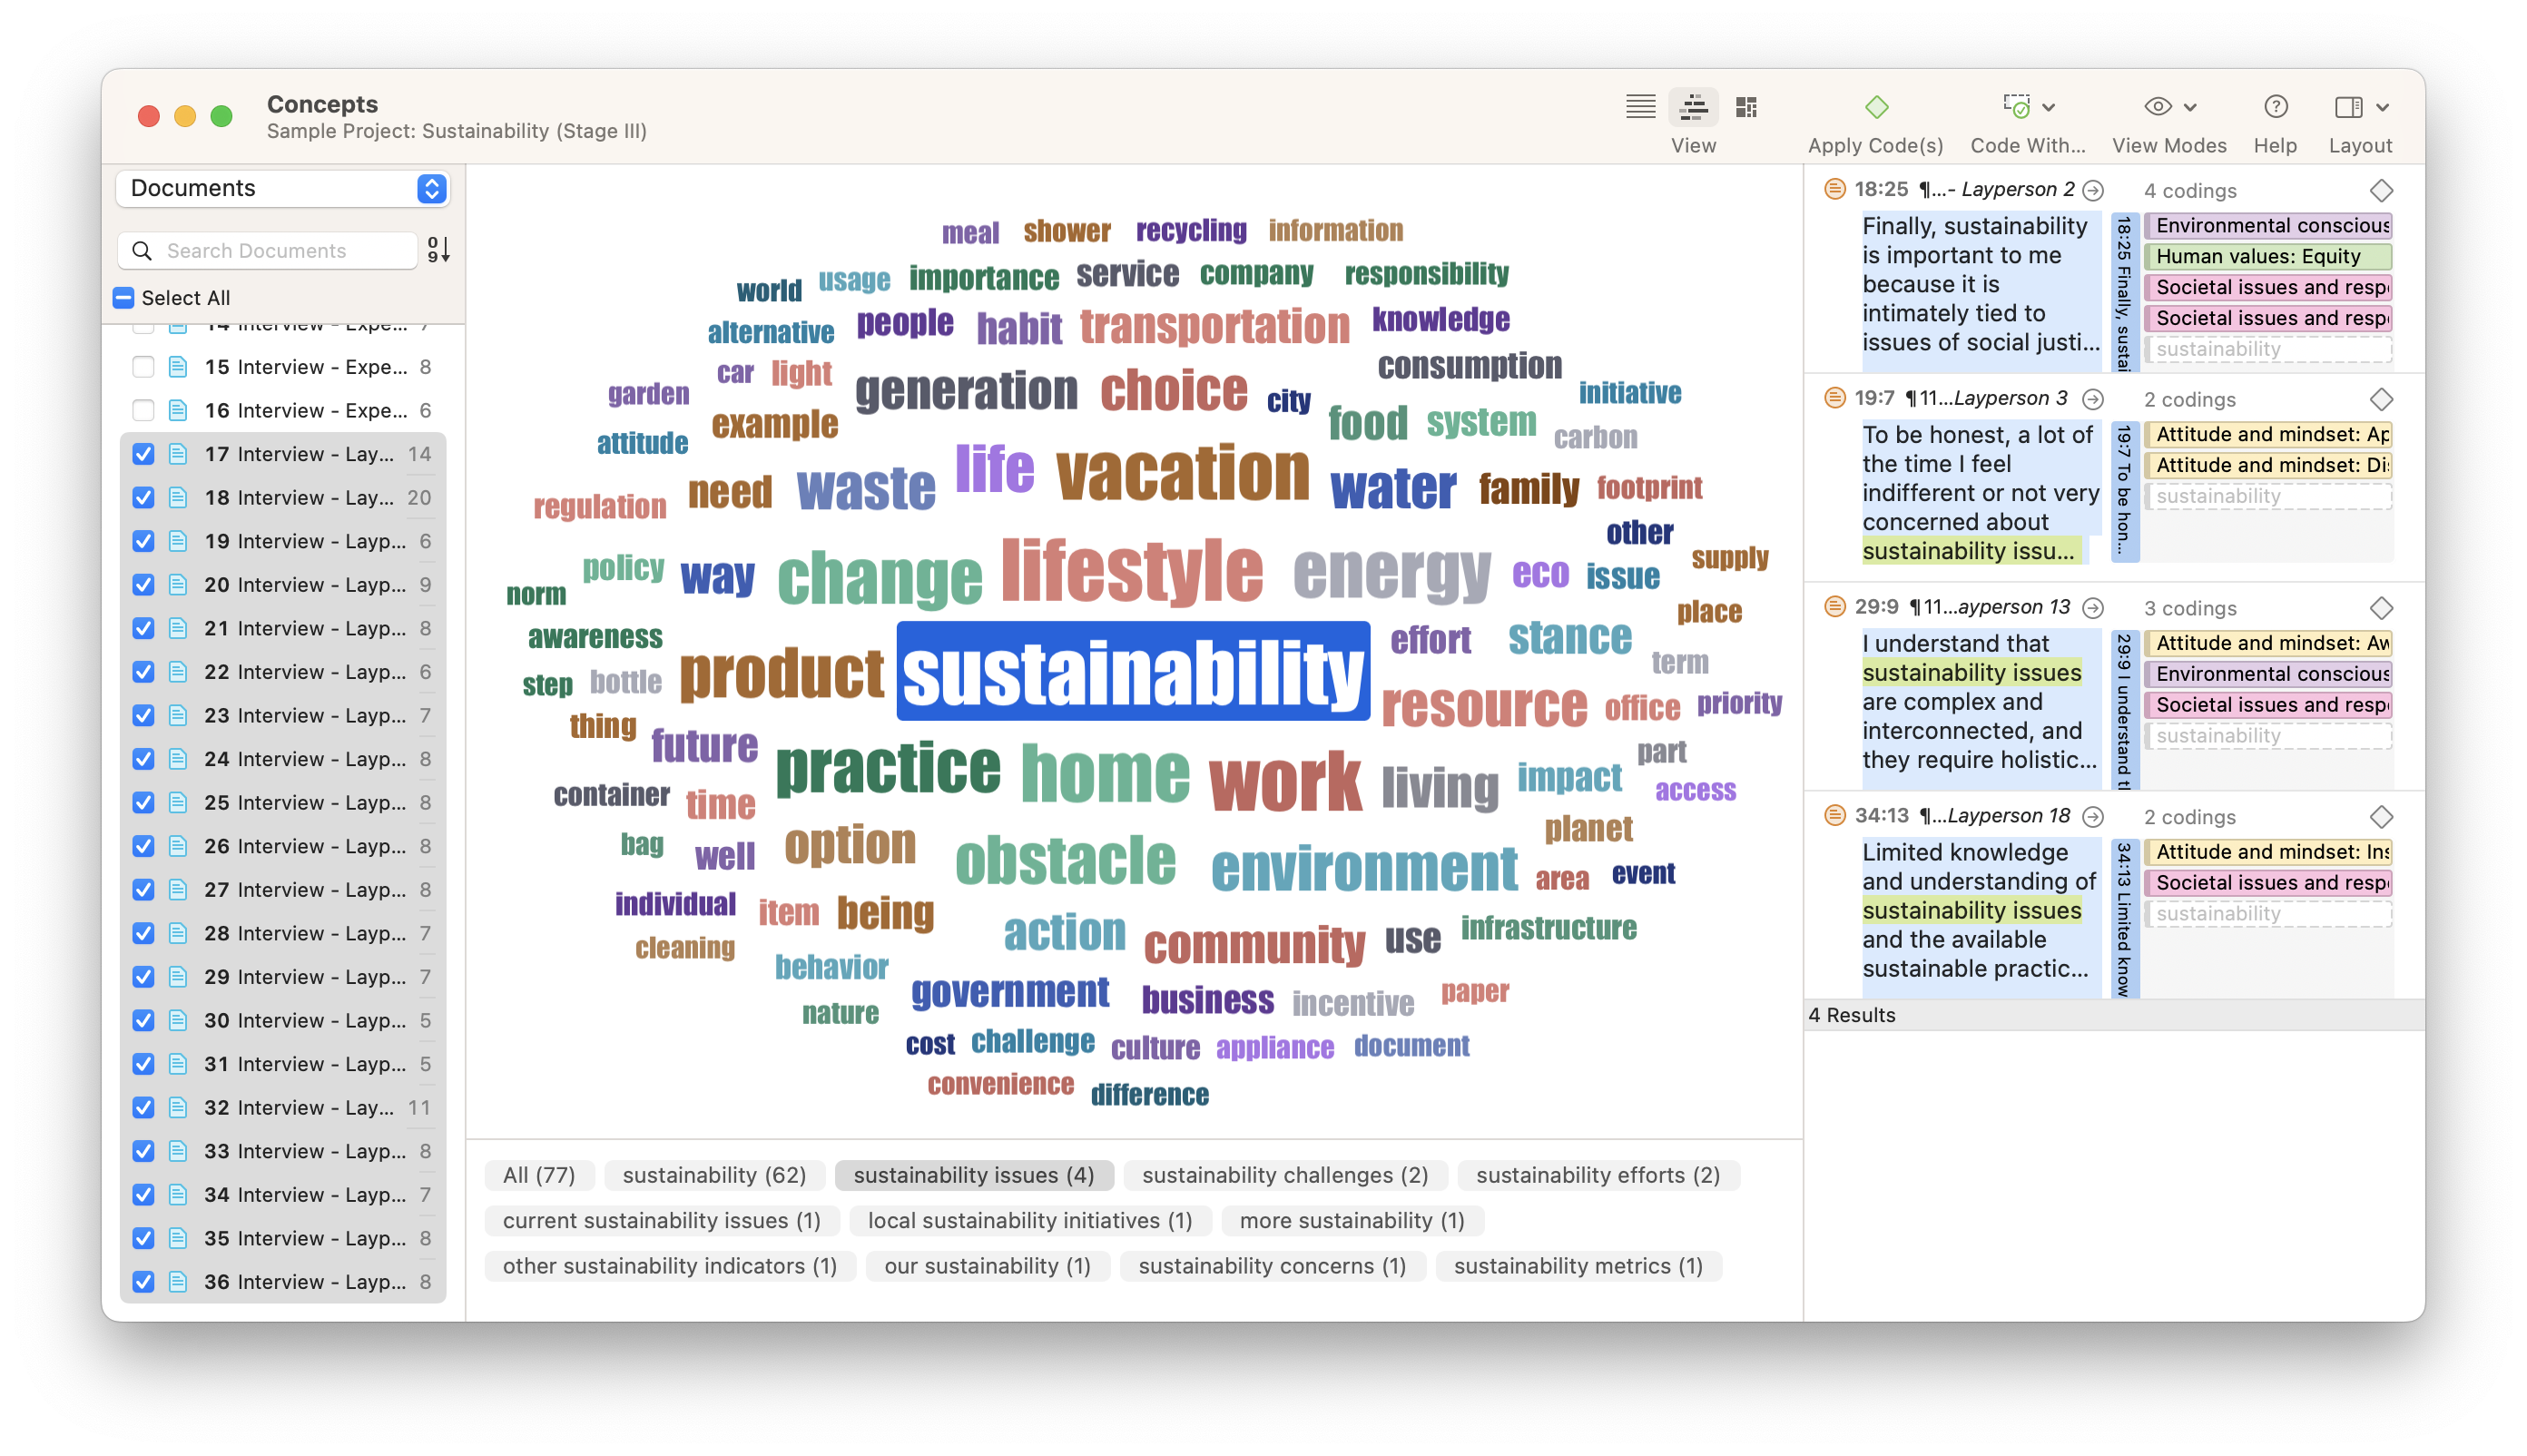
For instance, you can get a feeling for the sentiments expressed in the data. Who is more optimistic, pessimistic, or neutral in their responses? ATLAS.ti can auto-code the positive, negative, and neutral sentiments in your data. Naturally, you can also simply browse through your data and highlight relevant segments that catch your attention or attach codes to begin condensing the data.
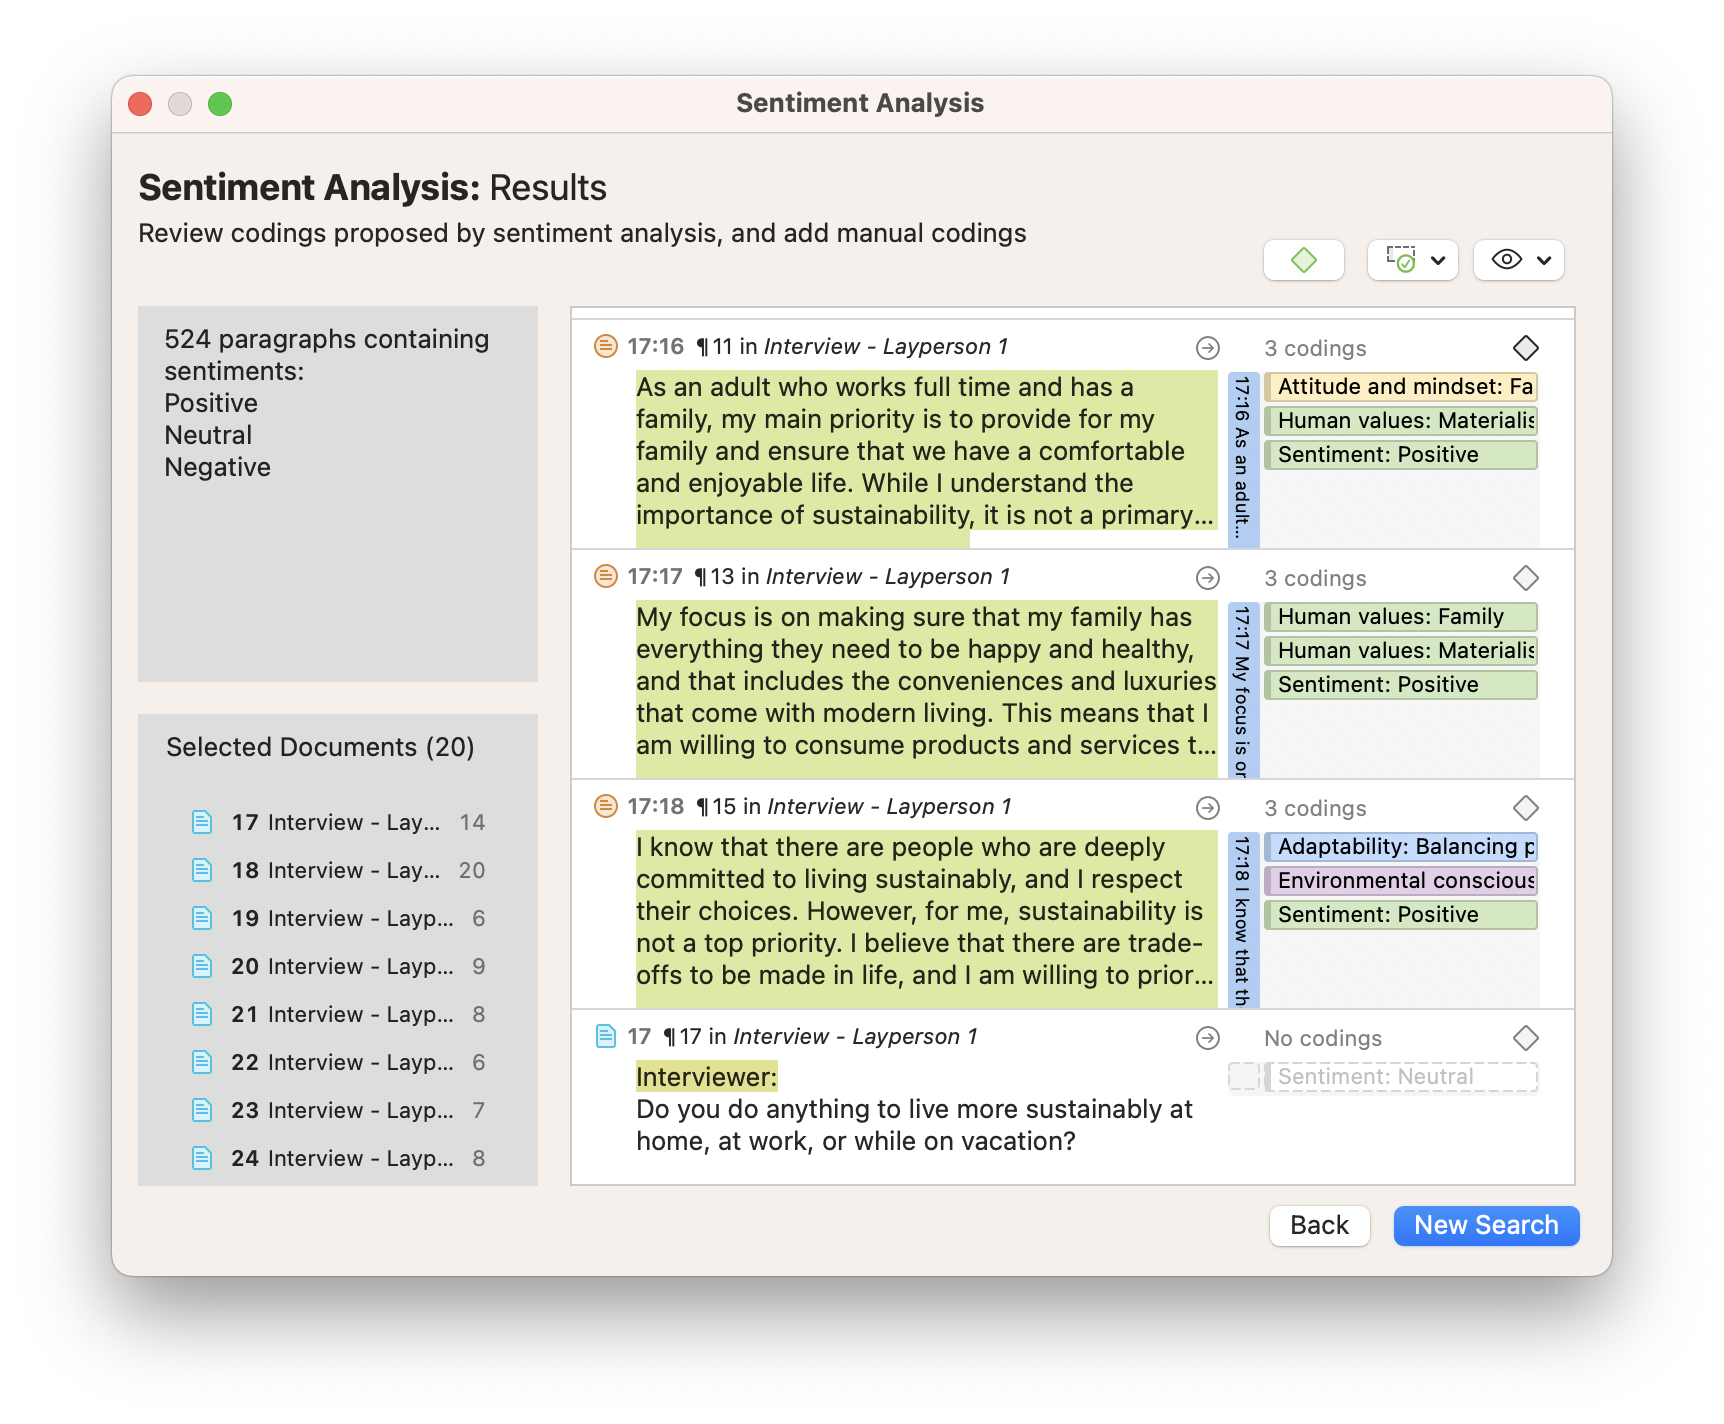
Step 4: Build a code system
Whether you start with auto-coding or manual coding, after having generated some first codes, you need to get some order in your code system to develop a cohesive understanding. You can build your code system by sorting codes into groups and creating categories and subcodes. As this process requires reading and re-reading your data, you will become very familiar with your data. Counting on a tool like ATLAS.ti qualitative data analysis software will support you in the process and make it easier to review your data, modify codings if necessary, change code labels, and write operational definitions to explain what each code means.
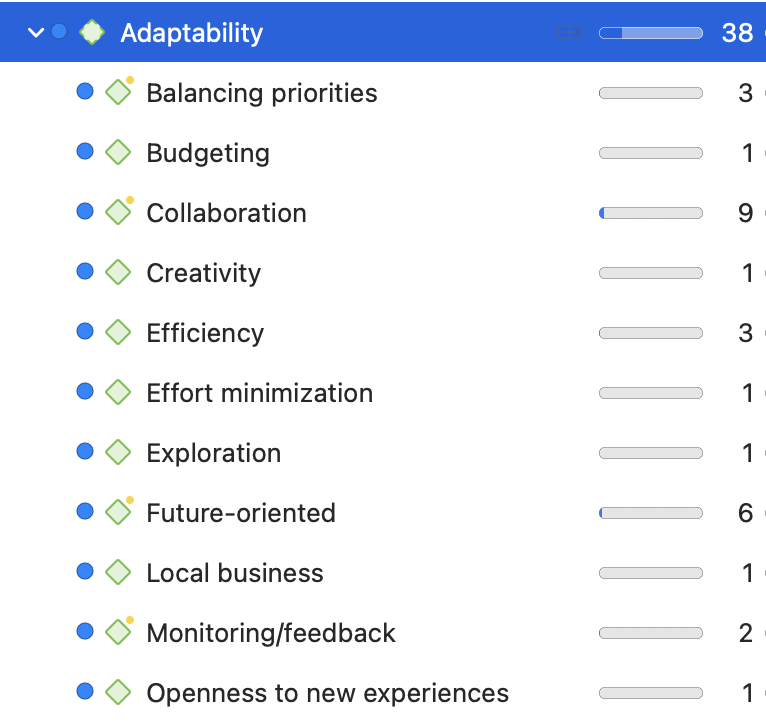
Step 5: Query your coded data and write up the analysis
Once you have coded your data, it is time to take the analysis a step further. When using software for qualitative data analysis , it is easy to compare and contrast subsets in your data, such as groups of participants or sets of themes.
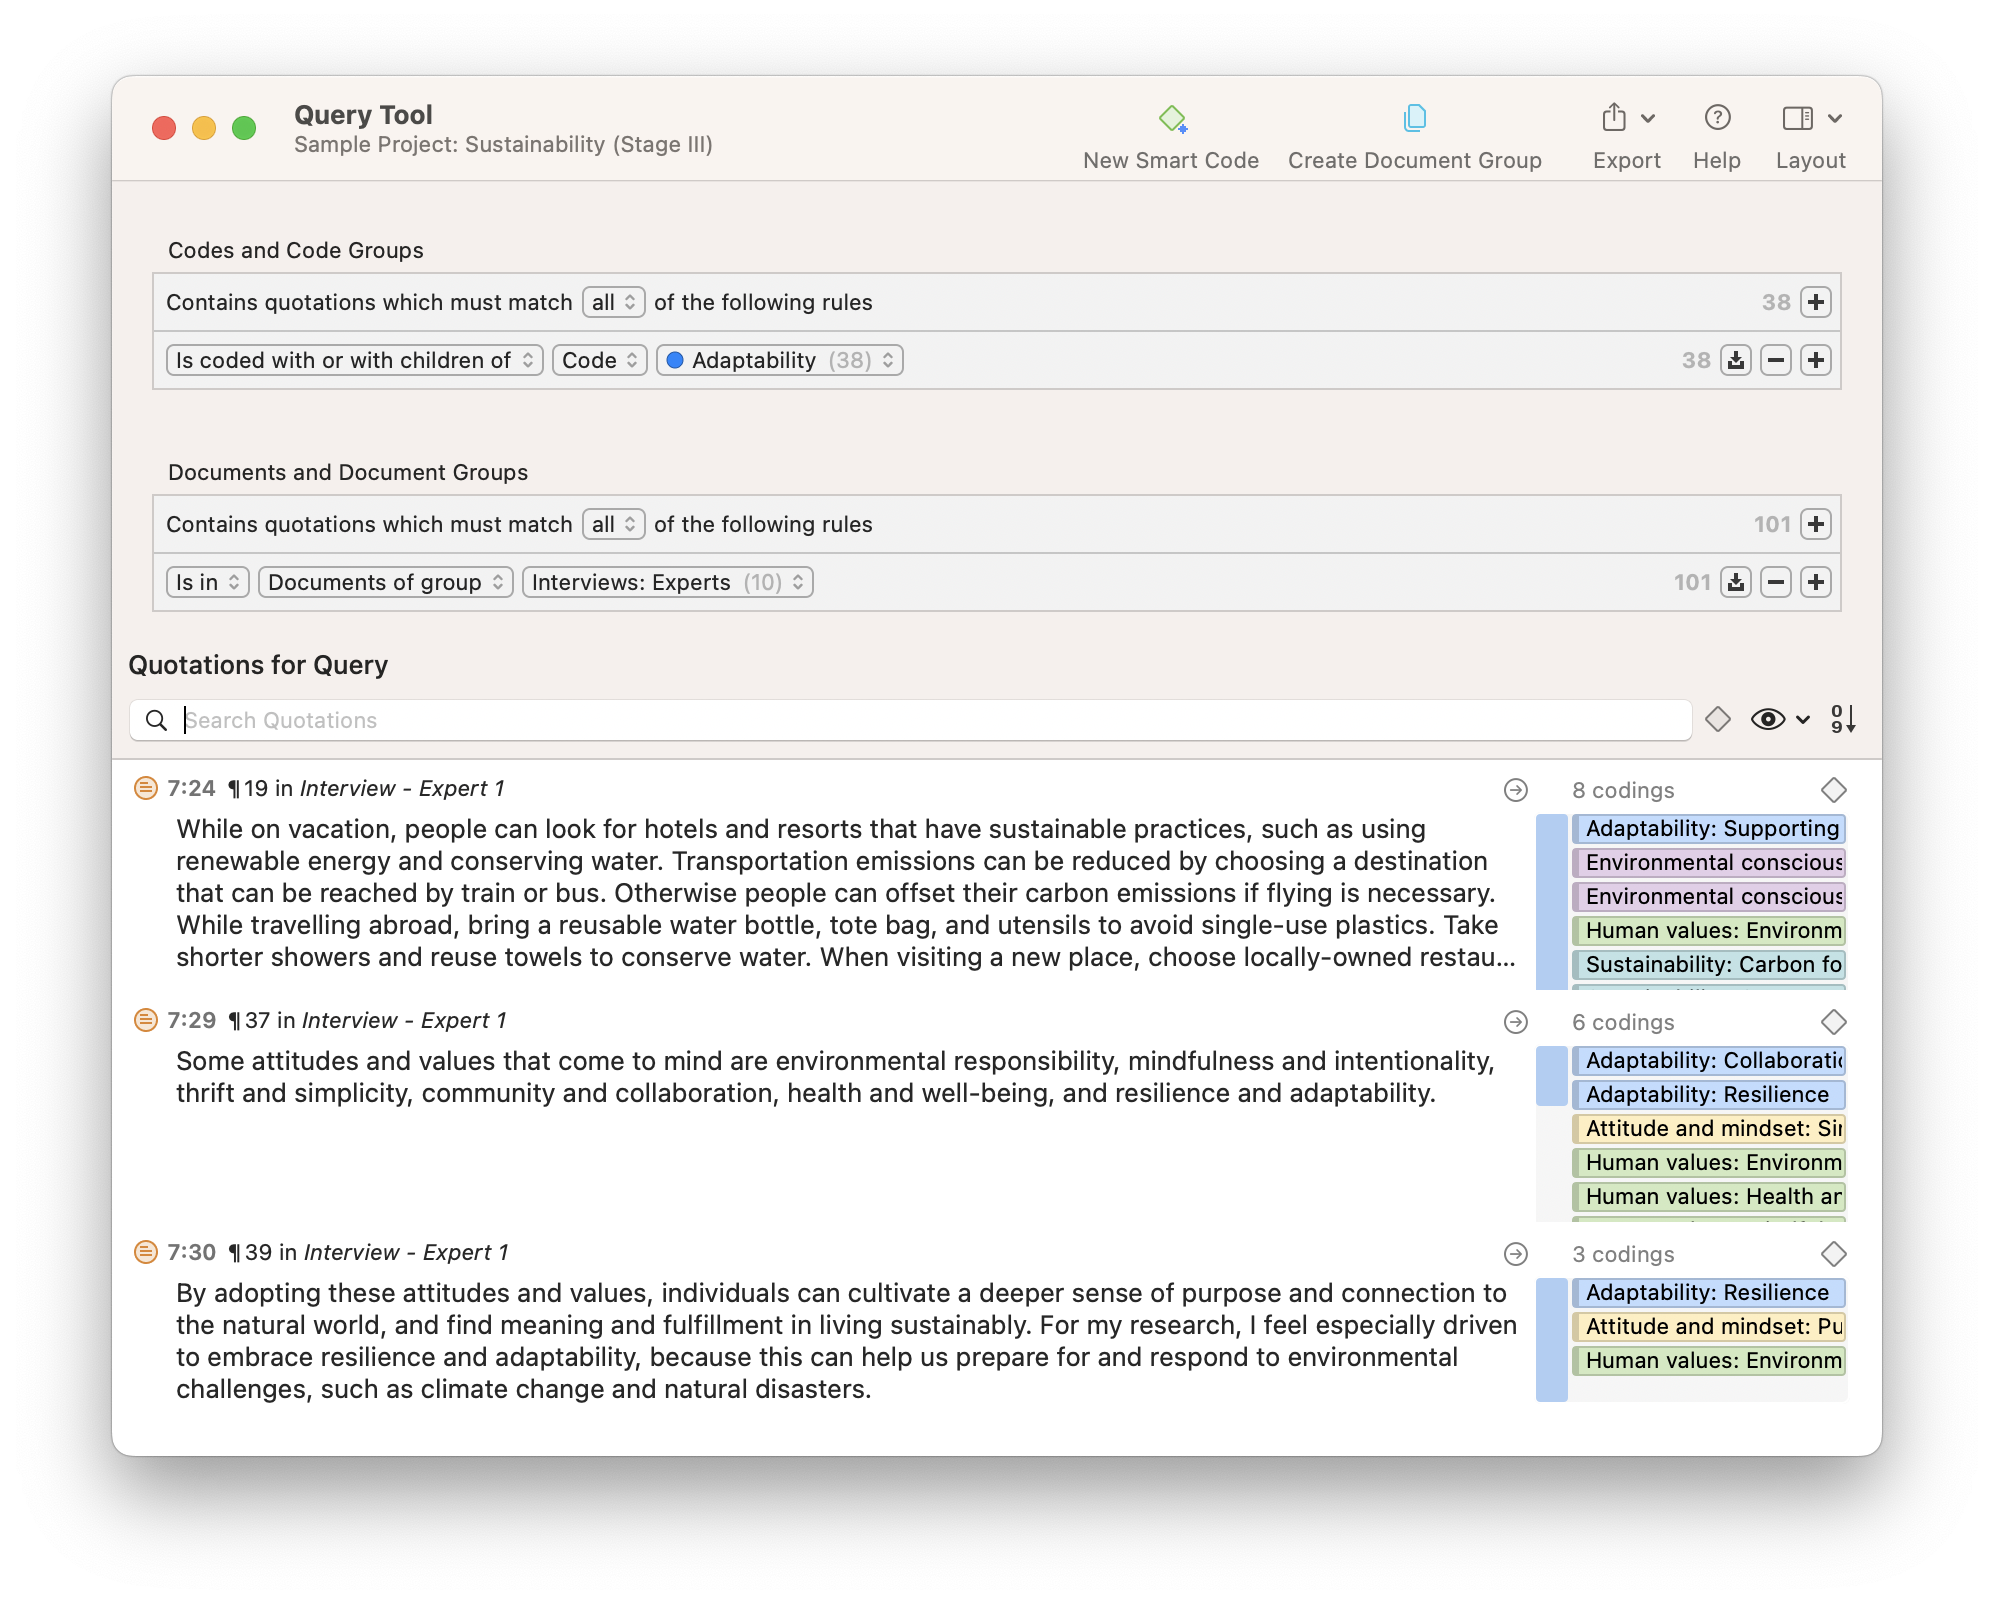
For instance, you can query the various opinions of female vs. male respondents. Is there a difference between consumers from rural or urban areas or among different age groups or educational levels? Which codes occur together throughout the data set? Are there relationships between various concepts, and if so, why?
Step 6: Data visualization
Data visualization brings your data to life. It is a powerful way of seeing patterns and relationships in your data. For instance, diagrams allow you to see how your codes are distributed across documents or specific subpopulations in your data.
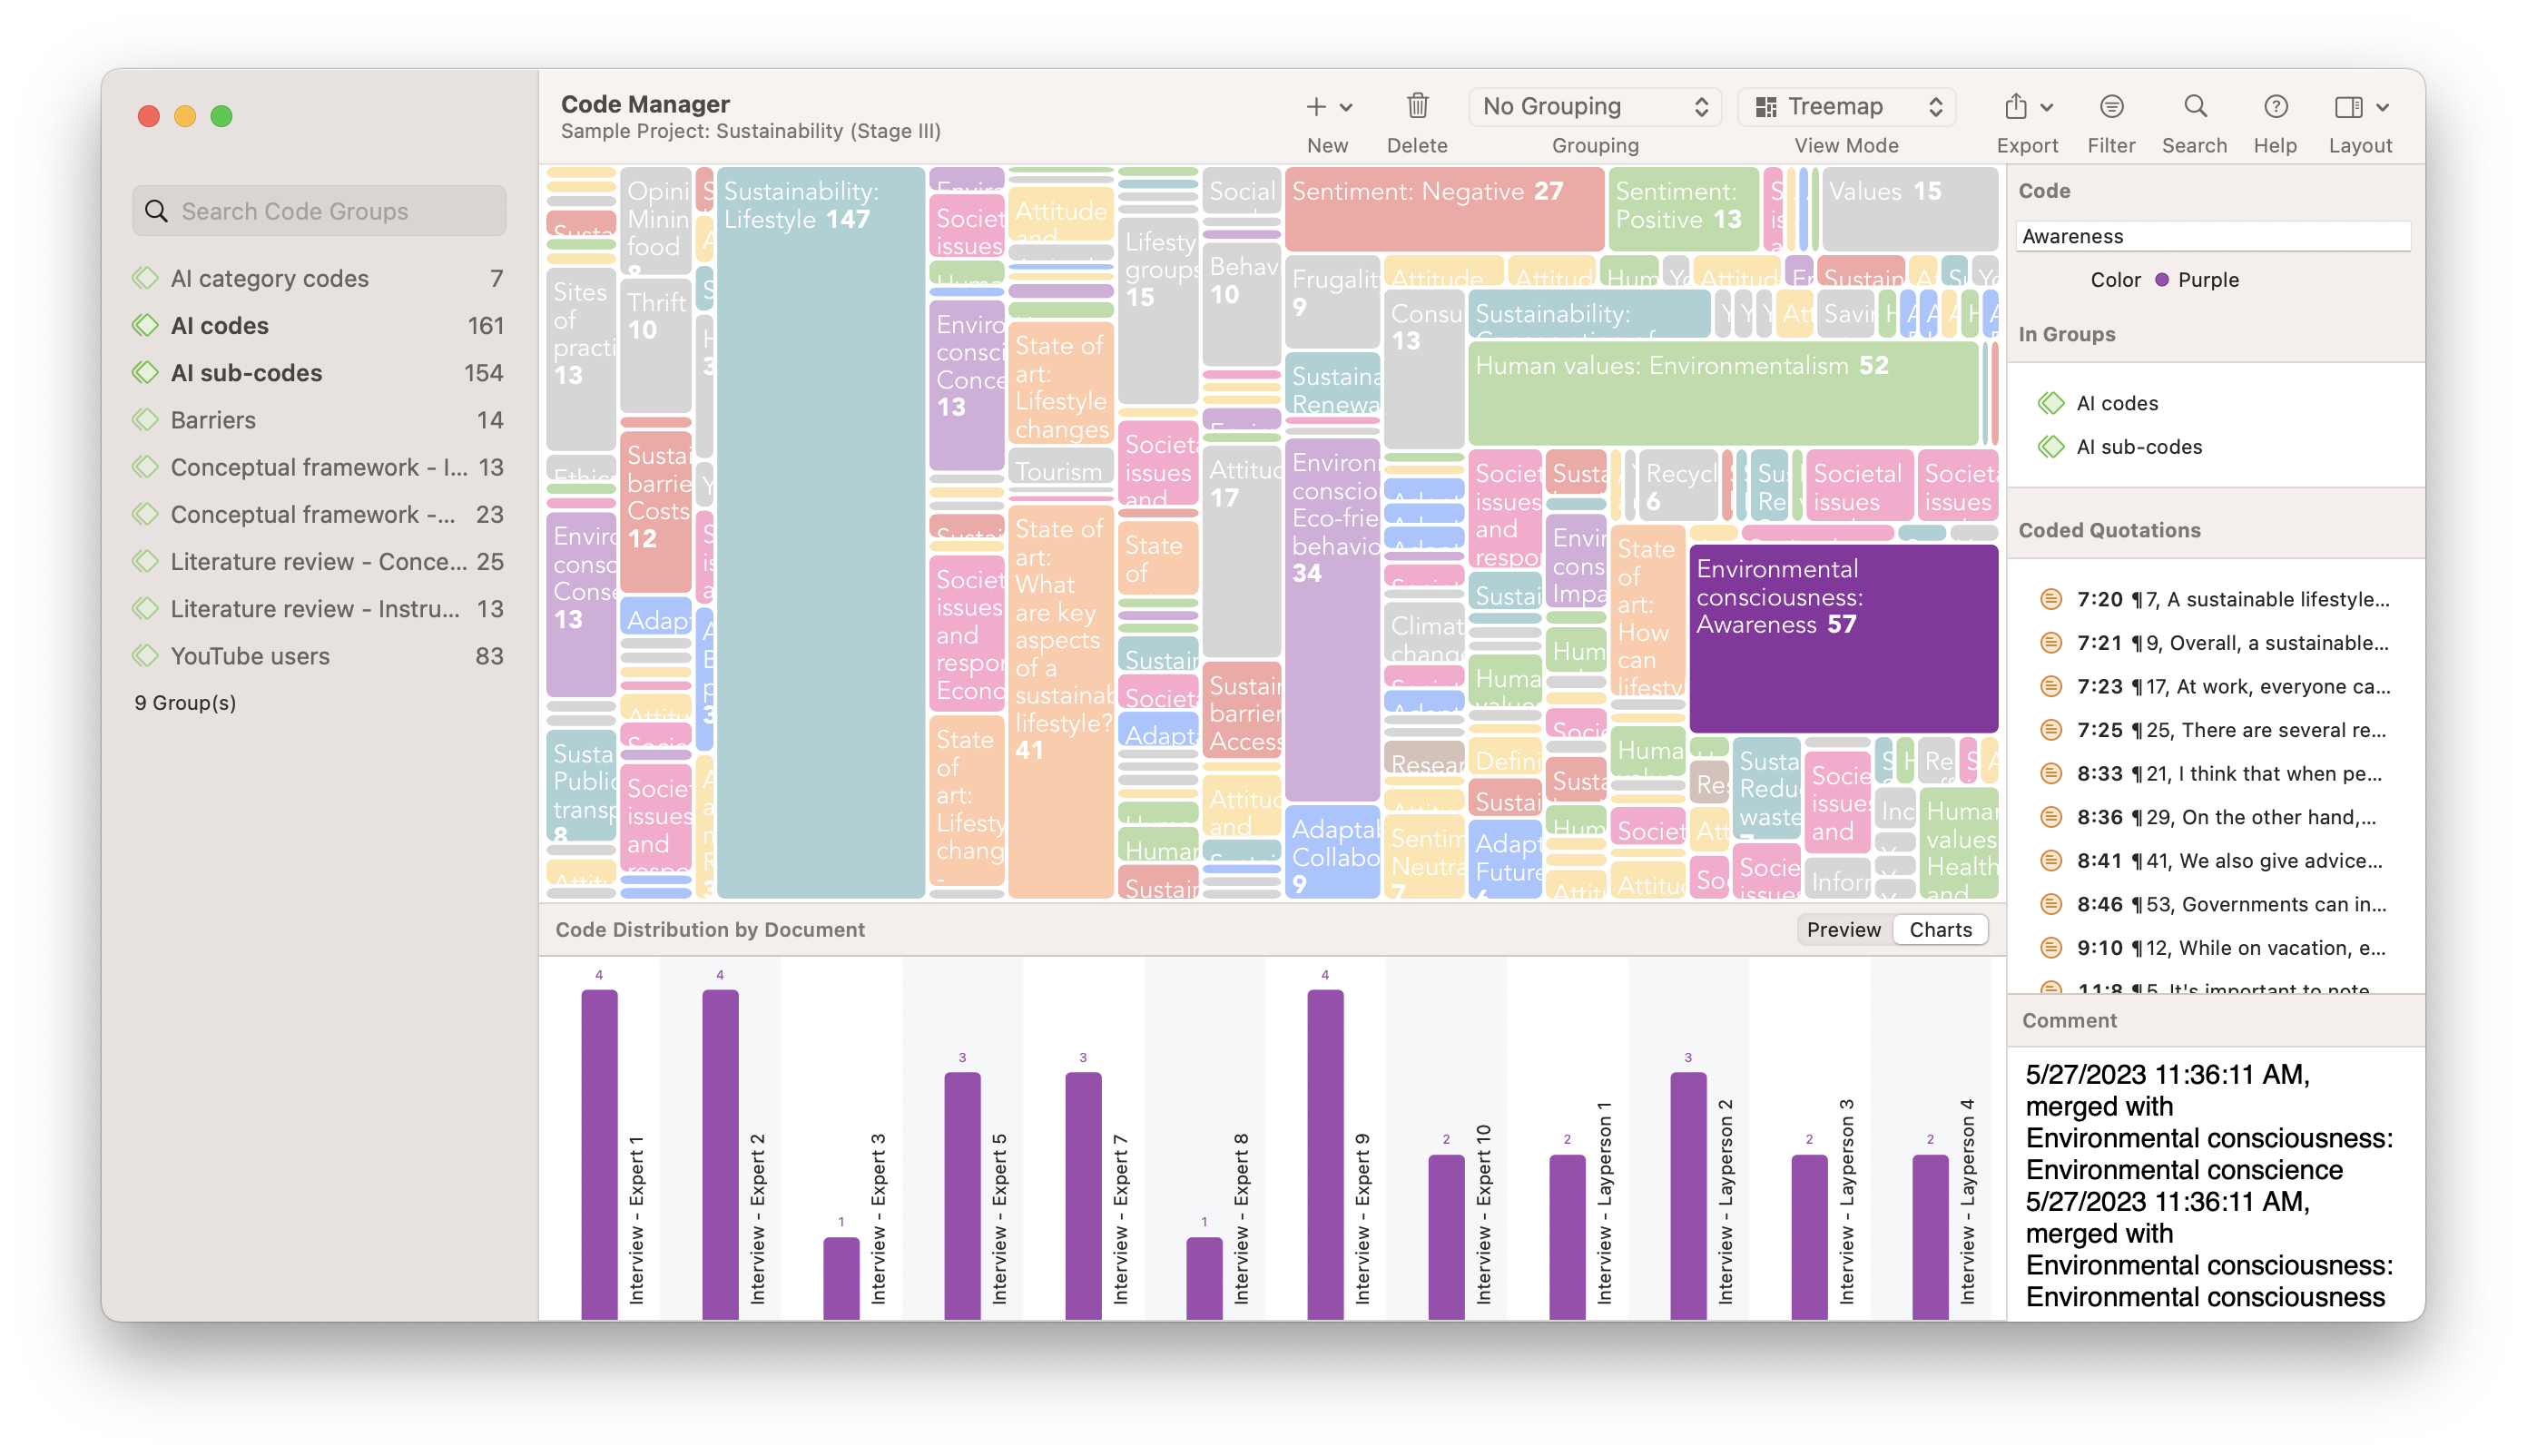
Exploring coded data on a canvas, moving around code labels in a virtual space, linking codes and other elements of your data set, and thinking about how they are related and why – all of these will advance your analysis and spur further insights. Visuals are also great for communicating results to others.
Step 7: Data presentation
The final step is to summarize the analysis in a written report . You can now put together the memos you have written about the various topics, select some salient quotes that illustrate your writing, and add visuals such as tables and diagrams. If you follow the steps above, you will already have all the building blocks, and you just have to put them together in a report or presentation.
When preparing a report or a presentation, keep your audience in mind. Does your audience better understand numbers than long sections of detailed interpretations? If so, add more tables, charts, and short supportive data quotes to your report or presentation. If your audience loves a good interpretation, add your full-length memos and walk your audience through your conceptual networks and illustrative data quotes.
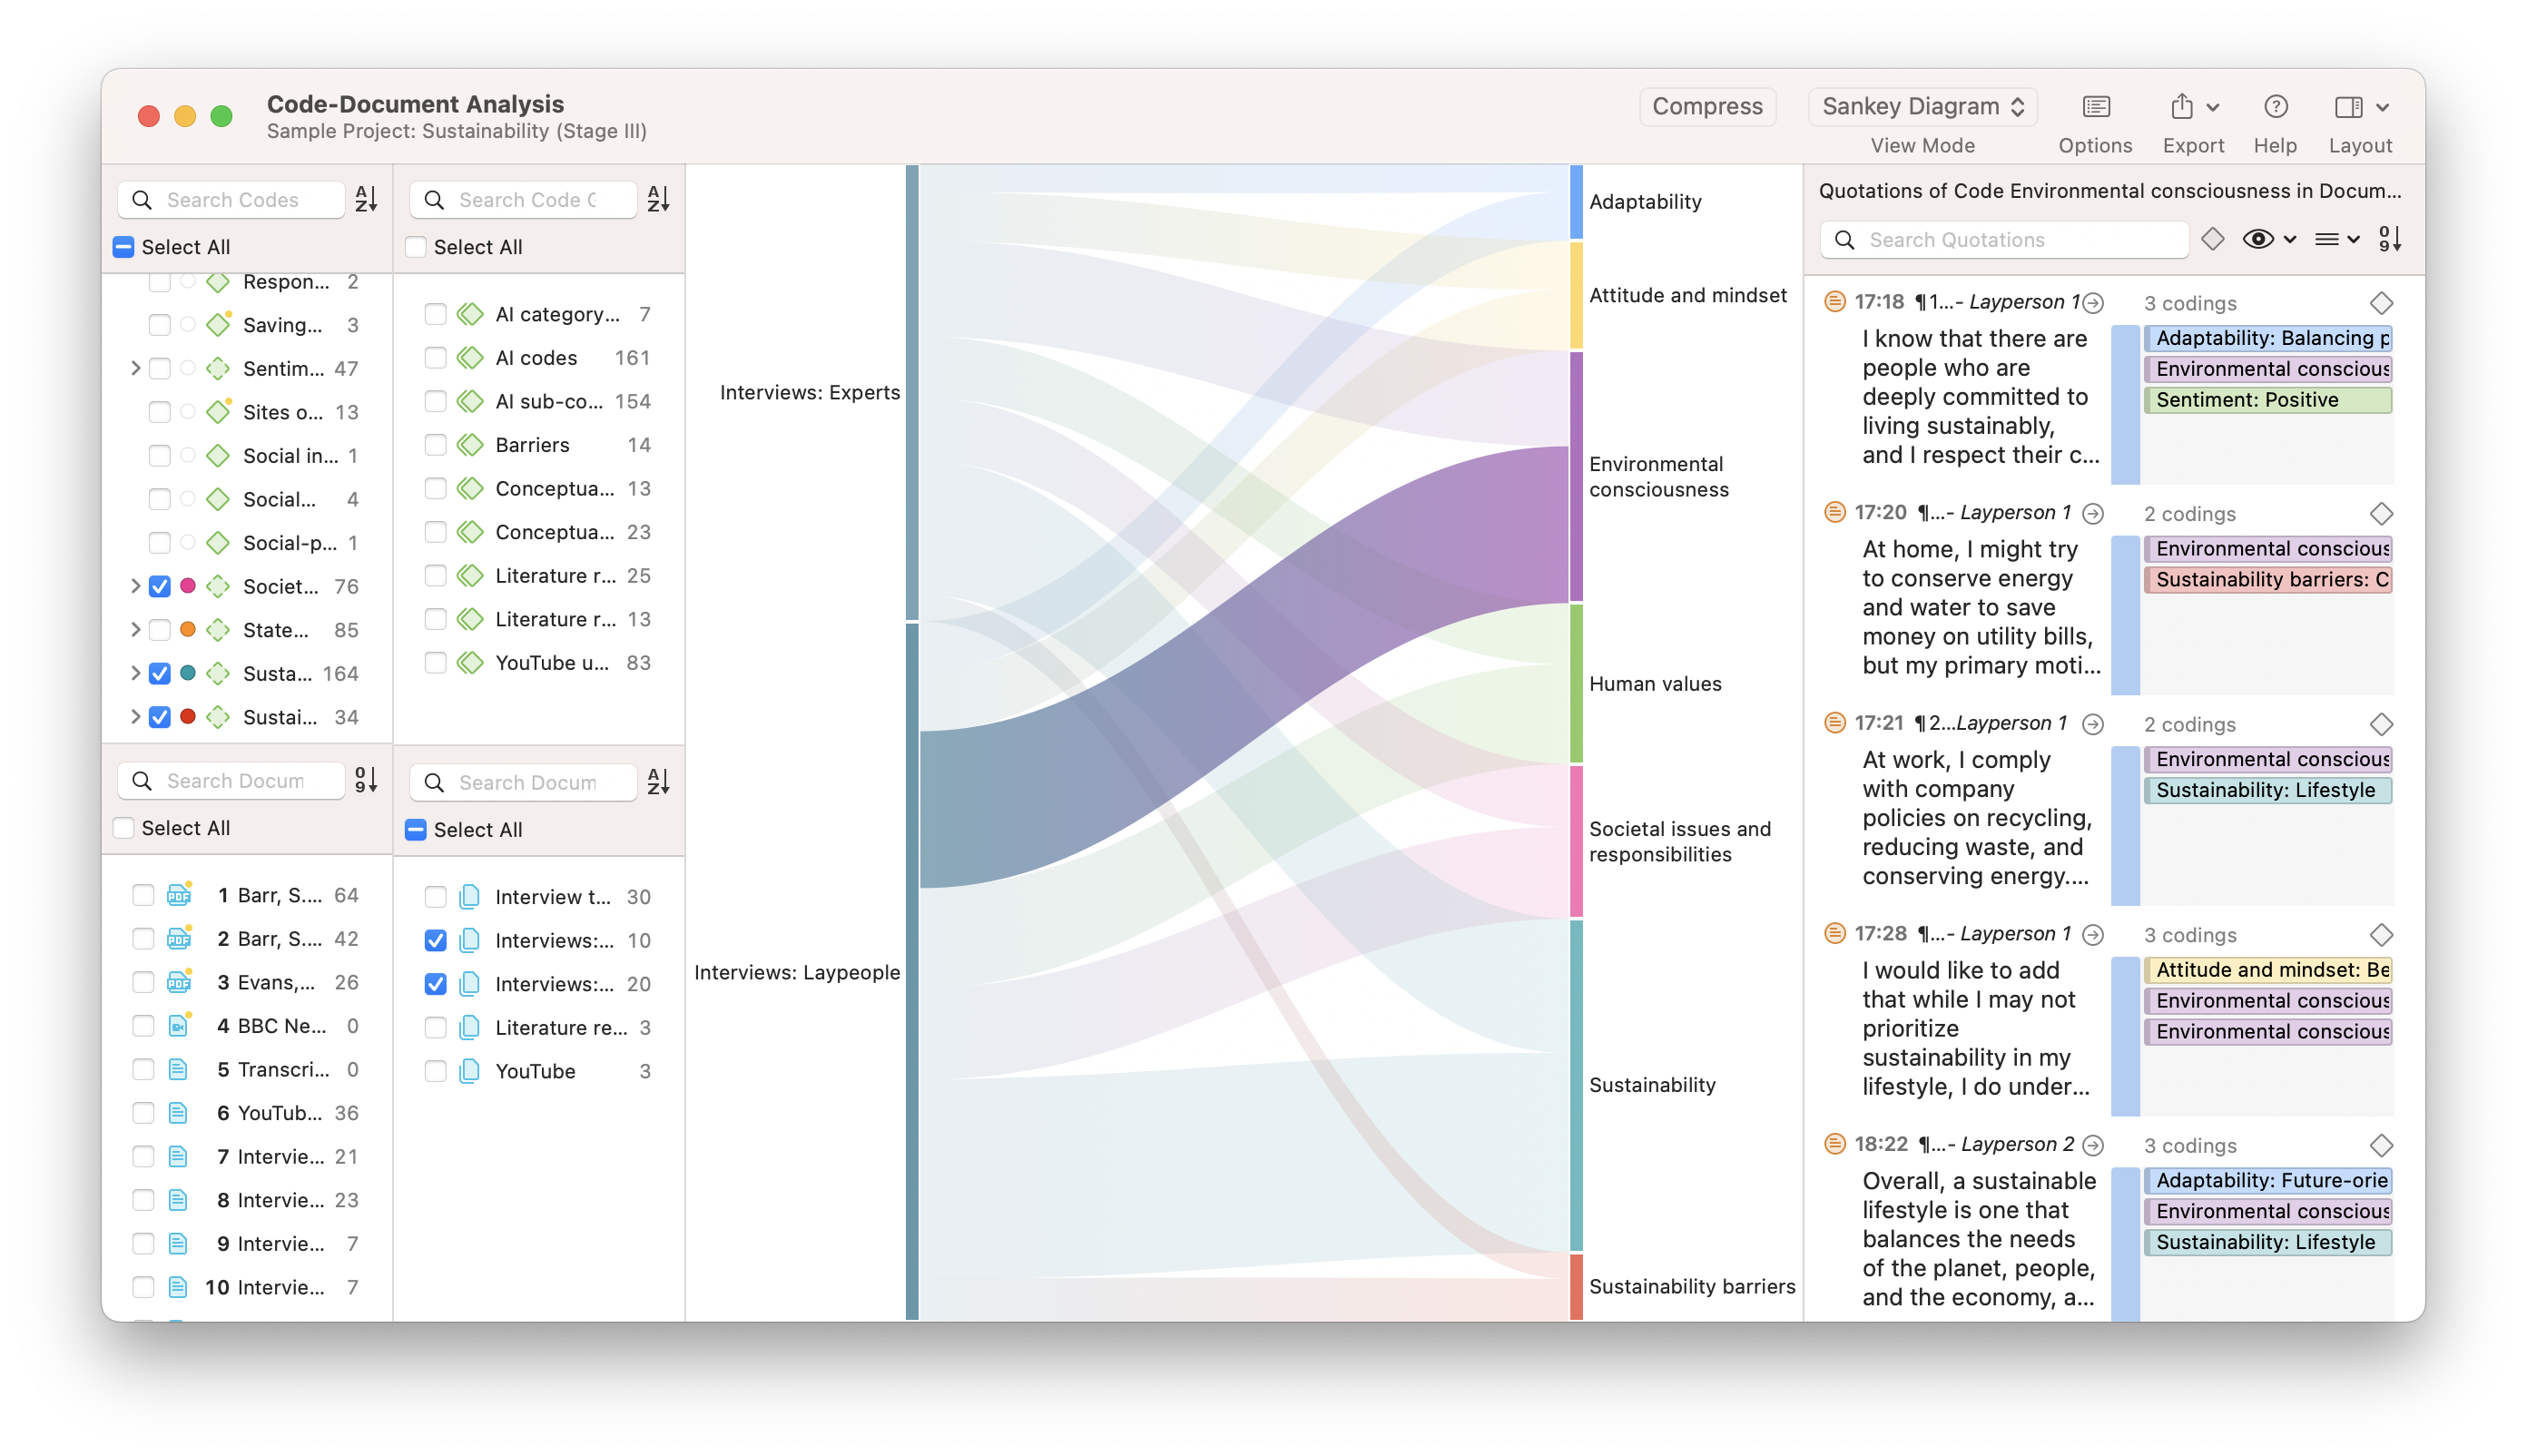
Qualitative data analysis begins with ATLAS.ti
For tools that can make the most out of your data, check out ATLAS.ti with a free trial.
- Python For Data Analysis
- Data Science
- Data Analysis with R
- Data Analysis with Python
- Data Visualization with Python
- Data Analysis Examples
- Math for Data Analysis
- Data Analysis Interview questions
- Artificial Intelligence
- Data Analysis Projects
- Machine Learning
- Deep Learning
- Computer Vision
- Types of Research - Methods Explained with Examples
- GRE Data Analysis | Methods for Presenting Data
- Financial Analysis: Objectives, Methods, and Process
- Financial Analysis: Need, Types, and Limitations
- Methods of Marketing Research
- Top 10 SQL Projects For Data Analysis
- What is Statistical Analysis in Data Science?
- 10 Data Analytics Project Ideas
- Predictive Analysis in Data Mining
- How to Become a Research Analyst?
- Data Analytics and its type
- Types of Social Networks Analysis
- What is Data Analysis?
- Six Steps of Data Analysis Process
- Multidimensional data analysis in Python
- Attributes and its Types in Data Analytics
- Exploratory Data Analysis (EDA) - Types and Tools
- Data Analyst Jobs in Pune
Data Analysis in Research: Types & Methods
Data analysis is a crucial step in the research process, transforming raw data into meaningful insights that drive informed decisions and advance knowledge. This article explores the various types and methods of data analysis in research, providing a comprehensive guide for researchers across disciplines.

Data Analysis in Research
Overview of Data analysis in research
Data analysis in research is the systematic use of statistical and analytical tools to describe, summarize, and draw conclusions from datasets. This process involves organizing, analyzing, modeling, and transforming data to identify trends, establish connections, and inform decision-making. The main goals include describing data through visualization and statistics, making inferences about a broader population, predicting future events using historical data, and providing data-driven recommendations. The stages of data analysis involve collecting relevant data, preprocessing to clean and format it, conducting exploratory data analysis to identify patterns, building and testing models, interpreting results, and effectively reporting findings.
- Main Goals : Describe data, make inferences, predict future events, and provide data-driven recommendations.
- Stages of Data Analysis : Data collection, preprocessing, exploratory data analysis, model building and testing, interpretation, and reporting.
Types of Data Analysis
1. descriptive analysis.
Descriptive analysis focuses on summarizing and describing the features of a dataset. It provides a snapshot of the data, highlighting central tendencies, dispersion, and overall patterns.
- Central Tendency Measures : Mean, median, and mode are used to identify the central point of the dataset.
- Dispersion Measures : Range, variance, and standard deviation help in understanding the spread of the data.
- Frequency Distribution : This shows how often each value in a dataset occurs.
2. Inferential Analysis
Inferential analysis allows researchers to make predictions or inferences about a population based on a sample of data. It is used to test hypotheses and determine the relationships between variables.
- Hypothesis Testing : Techniques like t-tests, chi-square tests, and ANOVA are used to test assumptions about a population.
- Regression Analysis : This method examines the relationship between dependent and independent variables.
- Confidence Intervals : These provide a range of values within which the true population parameter is expected to lie.
3. Exploratory Data Analysis (EDA)
EDA is an approach to analyzing data sets to summarize their main characteristics, often with visual methods. It helps in discovering patterns, spotting anomalies, and checking assumptions with the help of graphical representations.
- Visual Techniques : Histograms, box plots, scatter plots, and bar charts are commonly used in EDA.
- Summary Statistics : Basic statistical measures are used to describe the dataset.
4. Predictive Analysis
Predictive analysis uses statistical techniques and machine learning algorithms to predict future outcomes based on historical data.
- Machine Learning Models : Algorithms like linear regression, decision trees, and neural networks are employed to make predictions.
- Time Series Analysis : This method analyzes data points collected or recorded at specific time intervals to forecast future trends.
5. Causal Analysis
Causal analysis aims to identify cause-and-effect relationships between variables. It helps in understanding the impact of one variable on another.
- Experiments : Controlled experiments are designed to test the causality.
- Quasi-Experimental Designs : These are used when controlled experiments are not feasible.
6. Mechanistic Analysis
Mechanistic analysis seeks to understand the underlying mechanisms or processes that drive observed phenomena. It is common in fields like biology and engineering.
Methods of Data Analysis
1. quantitative methods.
Quantitative methods involve numerical data and statistical analysis to uncover patterns, relationships, and trends.
- Statistical Analysis : Includes various statistical tests and measures.
- Mathematical Modeling : Uses mathematical equations to represent relationships among variables.
- Simulation : Computer-based models simulate real-world processes to predict outcomes.
2. Qualitative Methods
Qualitative methods focus on non-numerical data, such as text, images, and audio, to understand concepts, opinions, or experiences.
- Content Analysis : Systematic coding and categorizing of textual information.
- Thematic Analysis : Identifying themes and patterns within qualitative data.
- Narrative Analysis : Examining the stories or accounts shared by participants.
3. Mixed Methods
Mixed methods combine both quantitative and qualitative approaches to provide a more comprehensive analysis.
- Sequential Explanatory Design : Quantitative data is collected and analyzed first, followed by qualitative data to explain the quantitative results.
- Concurrent Triangulation Design : Both qualitative and quantitative data are collected simultaneously but analyzed separately to compare results.
4. Data Mining
Data mining involves exploring large datasets to discover patterns and relationships.
- Clustering : Grouping data points with similar characteristics.
- Association Rule Learning : Identifying interesting relations between variables in large databases.
- Classification : Assigning items to predefined categories based on their attributes.
5. Big Data Analytics
Big data analytics involves analyzing vast amounts of data to uncover hidden patterns, correlations, and other insights.
- Hadoop and Spark : Frameworks for processing and analyzing large datasets.
- NoSQL Databases : Designed to handle unstructured data.
- Machine Learning Algorithms : Used to analyze and predict complex patterns in big data.
Applications and Case Studies
Numerous fields and industries use data analysis methods, which provide insightful information and facilitate data-driven decision-making. The following case studies demonstrate the effectiveness of data analysis in research:
Medical Care:
- Predicting Patient Readmissions: By using data analysis to create predictive models, healthcare facilities may better identify patients who are at high risk of readmission and implement focused interventions to enhance patient care.
- Disease Outbreak Analysis: Researchers can monitor and forecast disease outbreaks by examining both historical and current data. This information aids public health authorities in putting preventative and control measures in place.
- Fraud Detection: To safeguard clients and lessen financial losses, financial institutions use data analysis tools to identify fraudulent transactions and activities.
- investing Strategies: By using data analysis, quantitative investing models that detect trends in stock prices may be created, assisting investors in optimizing their portfolios and making well-informed choices.
- Customer Segmentation: Businesses may divide up their client base into discrete groups using data analysis, which makes it possible to launch focused marketing efforts and provide individualized services.
- Social Media Analytics: By tracking brand sentiment, identifying influencers, and understanding consumer preferences, marketers may develop more successful marketing strategies by analyzing social media data.
- Predicting Student Performance: By using data analysis tools, educators may identify at-risk children and forecast their performance. This allows them to give individualized learning plans and timely interventions.
- Education Policy Analysis: Data may be used by researchers to assess the efficacy of policies, initiatives, and programs in education, offering insights for evidence-based decision-making.
Social Science Fields:
- Opinion mining in politics: By examining public opinion data from news stories and social media platforms, academics and policymakers may get insight into prevailing political opinions and better understand how the public feels about certain topics or candidates.
- Crime Analysis: Researchers may spot trends, anticipate high-risk locations, and help law enforcement use resources wisely in order to deter and lessen crime by studying crime data.
Data analysis is a crucial step in the research process because it enables companies and researchers to glean insightful information from data. By using diverse analytical methodologies and approaches, scholars may reveal latent patterns, arrive at well-informed conclusions, and tackle intricate research inquiries. Numerous statistical, machine learning, and visualization approaches are among the many data analysis tools available, offering a comprehensive toolbox for addressing a broad variety of research problems.
Data Analysis in Research FAQs:
What are the main phases in the process of analyzing data.
In general, the steps involved in data analysis include gathering data, preparing it, doing exploratory data analysis, constructing and testing models, interpreting the results, and reporting the results. Every stage is essential to guaranteeing the analysis’s efficacy and correctness.
What are the differences between the examination of qualitative and quantitative data?
In order to comprehend and analyze non-numerical data, such text, pictures, or observations, qualitative data analysis often employs content analysis, grounded theory, or ethnography. Comparatively, quantitative data analysis works with numerical data and makes use of statistical methods to identify, deduce, and forecast trends in the data.
What are a few popular statistical methods for analyzing data?
In data analysis, predictive modeling, inferential statistics, and descriptive statistics are often used. While inferential statistics establish assumptions and draw inferences about a wider population, descriptive statistics highlight the fundamental characteristics of the data. To predict unknown values or future events, predictive modeling is used.
In what ways might data analysis methods be used in the healthcare industry?
In the healthcare industry, data analysis may be used to optimize treatment regimens, monitor disease outbreaks, forecast patient readmissions, and enhance patient care. It is also essential for medication development, clinical research, and the creation of healthcare policies.
What difficulties may one encounter while analyzing data?
Answer: Typical problems with data quality include missing values, outliers, and biased samples, all of which may affect how accurate the analysis is. Furthermore, it might be computationally demanding to analyze big and complicated datasets, necessitating certain tools and knowledge. It’s also critical to handle ethical issues, such as data security and privacy.
Please Login to comment...
Similar reads.
- Data Science Blogathon 2024
- Data Analysis
Improve your Coding Skills with Practice
What kind of Experience do you want to share?
Have a thesis expert improve your writing
Check your thesis for plagiarism in 10 minutes, generate your apa citations for free.
- Knowledge Base
The Beginner's Guide to Statistical Analysis | 5 Steps & Examples
Statistical analysis means investigating trends, patterns, and relationships using quantitative data . It is an important research tool used by scientists, governments, businesses, and other organisations.
To draw valid conclusions, statistical analysis requires careful planning from the very start of the research process . You need to specify your hypotheses and make decisions about your research design, sample size, and sampling procedure.
After collecting data from your sample, you can organise and summarise the data using descriptive statistics . Then, you can use inferential statistics to formally test hypotheses and make estimates about the population. Finally, you can interpret and generalise your findings.
This article is a practical introduction to statistical analysis for students and researchers. We’ll walk you through the steps using two research examples. The first investigates a potential cause-and-effect relationship, while the second investigates a potential correlation between variables.
Table of contents
Step 1: write your hypotheses and plan your research design, step 2: collect data from a sample, step 3: summarise your data with descriptive statistics, step 4: test hypotheses or make estimates with inferential statistics, step 5: interpret your results, frequently asked questions about statistics.
To collect valid data for statistical analysis, you first need to specify your hypotheses and plan out your research design.
Writing statistical hypotheses
The goal of research is often to investigate a relationship between variables within a population . You start with a prediction, and use statistical analysis to test that prediction.
A statistical hypothesis is a formal way of writing a prediction about a population. Every research prediction is rephrased into null and alternative hypotheses that can be tested using sample data.
While the null hypothesis always predicts no effect or no relationship between variables, the alternative hypothesis states your research prediction of an effect or relationship.
- Null hypothesis: A 5-minute meditation exercise will have no effect on math test scores in teenagers.
- Alternative hypothesis: A 5-minute meditation exercise will improve math test scores in teenagers.
- Null hypothesis: Parental income and GPA have no relationship with each other in college students.
- Alternative hypothesis: Parental income and GPA are positively correlated in college students.
Planning your research design
A research design is your overall strategy for data collection and analysis. It determines the statistical tests you can use to test your hypothesis later on.
First, decide whether your research will use a descriptive, correlational, or experimental design. Experiments directly influence variables, whereas descriptive and correlational studies only measure variables.
- In an experimental design , you can assess a cause-and-effect relationship (e.g., the effect of meditation on test scores) using statistical tests of comparison or regression.
- In a correlational design , you can explore relationships between variables (e.g., parental income and GPA) without any assumption of causality using correlation coefficients and significance tests.
- In a descriptive design , you can study the characteristics of a population or phenomenon (e.g., the prevalence of anxiety in U.S. college students) using statistical tests to draw inferences from sample data.
Your research design also concerns whether you’ll compare participants at the group level or individual level, or both.
- In a between-subjects design , you compare the group-level outcomes of participants who have been exposed to different treatments (e.g., those who performed a meditation exercise vs those who didn’t).
- In a within-subjects design , you compare repeated measures from participants who have participated in all treatments of a study (e.g., scores from before and after performing a meditation exercise).
- In a mixed (factorial) design , one variable is altered between subjects and another is altered within subjects (e.g., pretest and posttest scores from participants who either did or didn’t do a meditation exercise).
- Experimental
- Correlational
First, you’ll take baseline test scores from participants. Then, your participants will undergo a 5-minute meditation exercise. Finally, you’ll record participants’ scores from a second math test.
In this experiment, the independent variable is the 5-minute meditation exercise, and the dependent variable is the math test score from before and after the intervention. Example: Correlational research design In a correlational study, you test whether there is a relationship between parental income and GPA in graduating college students. To collect your data, you will ask participants to fill in a survey and self-report their parents’ incomes and their own GPA.
Measuring variables
When planning a research design, you should operationalise your variables and decide exactly how you will measure them.
For statistical analysis, it’s important to consider the level of measurement of your variables, which tells you what kind of data they contain:
- Categorical data represents groupings. These may be nominal (e.g., gender) or ordinal (e.g. level of language ability).
- Quantitative data represents amounts. These may be on an interval scale (e.g. test score) or a ratio scale (e.g. age).
Many variables can be measured at different levels of precision. For example, age data can be quantitative (8 years old) or categorical (young). If a variable is coded numerically (e.g., level of agreement from 1–5), it doesn’t automatically mean that it’s quantitative instead of categorical.
Identifying the measurement level is important for choosing appropriate statistics and hypothesis tests. For example, you can calculate a mean score with quantitative data, but not with categorical data.
In a research study, along with measures of your variables of interest, you’ll often collect data on relevant participant characteristics.

In most cases, it’s too difficult or expensive to collect data from every member of the population you’re interested in studying. Instead, you’ll collect data from a sample.
Statistical analysis allows you to apply your findings beyond your own sample as long as you use appropriate sampling procedures . You should aim for a sample that is representative of the population.
Sampling for statistical analysis
There are two main approaches to selecting a sample.
- Probability sampling: every member of the population has a chance of being selected for the study through random selection.
- Non-probability sampling: some members of the population are more likely than others to be selected for the study because of criteria such as convenience or voluntary self-selection.
In theory, for highly generalisable findings, you should use a probability sampling method. Random selection reduces sampling bias and ensures that data from your sample is actually typical of the population. Parametric tests can be used to make strong statistical inferences when data are collected using probability sampling.
But in practice, it’s rarely possible to gather the ideal sample. While non-probability samples are more likely to be biased, they are much easier to recruit and collect data from. Non-parametric tests are more appropriate for non-probability samples, but they result in weaker inferences about the population.
If you want to use parametric tests for non-probability samples, you have to make the case that:
- your sample is representative of the population you’re generalising your findings to.
- your sample lacks systematic bias.
Keep in mind that external validity means that you can only generalise your conclusions to others who share the characteristics of your sample. For instance, results from Western, Educated, Industrialised, Rich and Democratic samples (e.g., college students in the US) aren’t automatically applicable to all non-WEIRD populations.
If you apply parametric tests to data from non-probability samples, be sure to elaborate on the limitations of how far your results can be generalised in your discussion section .
Create an appropriate sampling procedure
Based on the resources available for your research, decide on how you’ll recruit participants.
- Will you have resources to advertise your study widely, including outside of your university setting?
- Will you have the means to recruit a diverse sample that represents a broad population?
- Do you have time to contact and follow up with members of hard-to-reach groups?
Your participants are self-selected by their schools. Although you’re using a non-probability sample, you aim for a diverse and representative sample. Example: Sampling (correlational study) Your main population of interest is male college students in the US. Using social media advertising, you recruit senior-year male college students from a smaller subpopulation: seven universities in the Boston area.
Calculate sufficient sample size
Before recruiting participants, decide on your sample size either by looking at other studies in your field or using statistics. A sample that’s too small may be unrepresentative of the sample, while a sample that’s too large will be more costly than necessary.
There are many sample size calculators online. Different formulas are used depending on whether you have subgroups or how rigorous your study should be (e.g., in clinical research). As a rule of thumb, a minimum of 30 units or more per subgroup is necessary.
To use these calculators, you have to understand and input these key components:
- Significance level (alpha): the risk of rejecting a true null hypothesis that you are willing to take, usually set at 5%.
- Statistical power : the probability of your study detecting an effect of a certain size if there is one, usually 80% or higher.
- Expected effect size : a standardised indication of how large the expected result of your study will be, usually based on other similar studies.
- Population standard deviation: an estimate of the population parameter based on a previous study or a pilot study of your own.
Once you’ve collected all of your data, you can inspect them and calculate descriptive statistics that summarise them.
Inspect your data
There are various ways to inspect your data, including the following:
- Organising data from each variable in frequency distribution tables .
- Displaying data from a key variable in a bar chart to view the distribution of responses.
- Visualising the relationship between two variables using a scatter plot .
By visualising your data in tables and graphs, you can assess whether your data follow a skewed or normal distribution and whether there are any outliers or missing data.
A normal distribution means that your data are symmetrically distributed around a center where most values lie, with the values tapering off at the tail ends.

In contrast, a skewed distribution is asymmetric and has more values on one end than the other. The shape of the distribution is important to keep in mind because only some descriptive statistics should be used with skewed distributions.
Extreme outliers can also produce misleading statistics, so you may need a systematic approach to dealing with these values.
Calculate measures of central tendency
Measures of central tendency describe where most of the values in a data set lie. Three main measures of central tendency are often reported:
- Mode : the most popular response or value in the data set.
- Median : the value in the exact middle of the data set when ordered from low to high.
- Mean : the sum of all values divided by the number of values.
However, depending on the shape of the distribution and level of measurement, only one or two of these measures may be appropriate. For example, many demographic characteristics can only be described using the mode or proportions, while a variable like reaction time may not have a mode at all.
Calculate measures of variability
Measures of variability tell you how spread out the values in a data set are. Four main measures of variability are often reported:
- Range : the highest value minus the lowest value of the data set.
- Interquartile range : the range of the middle half of the data set.
- Standard deviation : the average distance between each value in your data set and the mean.
- Variance : the square of the standard deviation.
Once again, the shape of the distribution and level of measurement should guide your choice of variability statistics. The interquartile range is the best measure for skewed distributions, while standard deviation and variance provide the best information for normal distributions.
Using your table, you should check whether the units of the descriptive statistics are comparable for pretest and posttest scores. For example, are the variance levels similar across the groups? Are there any extreme values? If there are, you may need to identify and remove extreme outliers in your data set or transform your data before performing a statistical test.
From this table, we can see that the mean score increased after the meditation exercise, and the variances of the two scores are comparable. Next, we can perform a statistical test to find out if this improvement in test scores is statistically significant in the population. Example: Descriptive statistics (correlational study) After collecting data from 653 students, you tabulate descriptive statistics for annual parental income and GPA.
It’s important to check whether you have a broad range of data points. If you don’t, your data may be skewed towards some groups more than others (e.g., high academic achievers), and only limited inferences can be made about a relationship.
A number that describes a sample is called a statistic , while a number describing a population is called a parameter . Using inferential statistics , you can make conclusions about population parameters based on sample statistics.
Researchers often use two main methods (simultaneously) to make inferences in statistics.
- Estimation: calculating population parameters based on sample statistics.
- Hypothesis testing: a formal process for testing research predictions about the population using samples.
You can make two types of estimates of population parameters from sample statistics:
- A point estimate : a value that represents your best guess of the exact parameter.
- An interval estimate : a range of values that represent your best guess of where the parameter lies.
If your aim is to infer and report population characteristics from sample data, it’s best to use both point and interval estimates in your paper.
You can consider a sample statistic a point estimate for the population parameter when you have a representative sample (e.g., in a wide public opinion poll, the proportion of a sample that supports the current government is taken as the population proportion of government supporters).
There’s always error involved in estimation, so you should also provide a confidence interval as an interval estimate to show the variability around a point estimate.
A confidence interval uses the standard error and the z score from the standard normal distribution to convey where you’d generally expect to find the population parameter most of the time.
Hypothesis testing
Using data from a sample, you can test hypotheses about relationships between variables in the population. Hypothesis testing starts with the assumption that the null hypothesis is true in the population, and you use statistical tests to assess whether the null hypothesis can be rejected or not.
Statistical tests determine where your sample data would lie on an expected distribution of sample data if the null hypothesis were true. These tests give two main outputs:
- A test statistic tells you how much your data differs from the null hypothesis of the test.
- A p value tells you the likelihood of obtaining your results if the null hypothesis is actually true in the population.
Statistical tests come in three main varieties:
- Comparison tests assess group differences in outcomes.
- Regression tests assess cause-and-effect relationships between variables.
- Correlation tests assess relationships between variables without assuming causation.
Your choice of statistical test depends on your research questions, research design, sampling method, and data characteristics.
Parametric tests
Parametric tests make powerful inferences about the population based on sample data. But to use them, some assumptions must be met, and only some types of variables can be used. If your data violate these assumptions, you can perform appropriate data transformations or use alternative non-parametric tests instead.
A regression models the extent to which changes in a predictor variable results in changes in outcome variable(s).
- A simple linear regression includes one predictor variable and one outcome variable.
- A multiple linear regression includes two or more predictor variables and one outcome variable.
Comparison tests usually compare the means of groups. These may be the means of different groups within a sample (e.g., a treatment and control group), the means of one sample group taken at different times (e.g., pretest and posttest scores), or a sample mean and a population mean.
- A t test is for exactly 1 or 2 groups when the sample is small (30 or less).
- A z test is for exactly 1 or 2 groups when the sample is large.
- An ANOVA is for 3 or more groups.
The z and t tests have subtypes based on the number and types of samples and the hypotheses:
- If you have only one sample that you want to compare to a population mean, use a one-sample test .
- If you have paired measurements (within-subjects design), use a dependent (paired) samples test .
- If you have completely separate measurements from two unmatched groups (between-subjects design), use an independent (unpaired) samples test .
- If you expect a difference between groups in a specific direction, use a one-tailed test .
- If you don’t have any expectations for the direction of a difference between groups, use a two-tailed test .
The only parametric correlation test is Pearson’s r . The correlation coefficient ( r ) tells you the strength of a linear relationship between two quantitative variables.
However, to test whether the correlation in the sample is strong enough to be important in the population, you also need to perform a significance test of the correlation coefficient, usually a t test, to obtain a p value. This test uses your sample size to calculate how much the correlation coefficient differs from zero in the population.
You use a dependent-samples, one-tailed t test to assess whether the meditation exercise significantly improved math test scores. The test gives you:
- a t value (test statistic) of 3.00
- a p value of 0.0028
Although Pearson’s r is a test statistic, it doesn’t tell you anything about how significant the correlation is in the population. You also need to test whether this sample correlation coefficient is large enough to demonstrate a correlation in the population.
A t test can also determine how significantly a correlation coefficient differs from zero based on sample size. Since you expect a positive correlation between parental income and GPA, you use a one-sample, one-tailed t test. The t test gives you:
- a t value of 3.08
- a p value of 0.001
The final step of statistical analysis is interpreting your results.
Statistical significance
In hypothesis testing, statistical significance is the main criterion for forming conclusions. You compare your p value to a set significance level (usually 0.05) to decide whether your results are statistically significant or non-significant.
Statistically significant results are considered unlikely to have arisen solely due to chance. There is only a very low chance of such a result occurring if the null hypothesis is true in the population.
This means that you believe the meditation intervention, rather than random factors, directly caused the increase in test scores. Example: Interpret your results (correlational study) You compare your p value of 0.001 to your significance threshold of 0.05. With a p value under this threshold, you can reject the null hypothesis. This indicates a statistically significant correlation between parental income and GPA in male college students.
Note that correlation doesn’t always mean causation, because there are often many underlying factors contributing to a complex variable like GPA. Even if one variable is related to another, this may be because of a third variable influencing both of them, or indirect links between the two variables.
Effect size
A statistically significant result doesn’t necessarily mean that there are important real life applications or clinical outcomes for a finding.
In contrast, the effect size indicates the practical significance of your results. It’s important to report effect sizes along with your inferential statistics for a complete picture of your results. You should also report interval estimates of effect sizes if you’re writing an APA style paper .
With a Cohen’s d of 0.72, there’s medium to high practical significance to your finding that the meditation exercise improved test scores. Example: Effect size (correlational study) To determine the effect size of the correlation coefficient, you compare your Pearson’s r value to Cohen’s effect size criteria.
Decision errors
Type I and Type II errors are mistakes made in research conclusions. A Type I error means rejecting the null hypothesis when it’s actually true, while a Type II error means failing to reject the null hypothesis when it’s false.
You can aim to minimise the risk of these errors by selecting an optimal significance level and ensuring high power . However, there’s a trade-off between the two errors, so a fine balance is necessary.
Frequentist versus Bayesian statistics
Traditionally, frequentist statistics emphasises null hypothesis significance testing and always starts with the assumption of a true null hypothesis.
However, Bayesian statistics has grown in popularity as an alternative approach in the last few decades. In this approach, you use previous research to continually update your hypotheses based on your expectations and observations.
Bayes factor compares the relative strength of evidence for the null versus the alternative hypothesis rather than making a conclusion about rejecting the null hypothesis or not.
Hypothesis testing is a formal procedure for investigating our ideas about the world using statistics. It is used by scientists to test specific predictions, called hypotheses , by calculating how likely it is that a pattern or relationship between variables could have arisen by chance.
The research methods you use depend on the type of data you need to answer your research question .
- If you want to measure something or test a hypothesis , use quantitative methods . If you want to explore ideas, thoughts, and meanings, use qualitative methods .
- If you want to analyse a large amount of readily available data, use secondary data. If you want data specific to your purposes with control over how they are generated, collect primary data.
- If you want to establish cause-and-effect relationships between variables , use experimental methods. If you want to understand the characteristics of a research subject, use descriptive methods.
Statistical analysis is the main method for analyzing quantitative research data . It uses probabilities and models to test predictions about a population from sample data.
Is this article helpful?
Other students also liked, a quick guide to experimental design | 5 steps & examples, controlled experiments | methods & examples of control, between-subjects design | examples, pros & cons, more interesting articles.
- Central Limit Theorem | Formula, Definition & Examples
- Central Tendency | Understanding the Mean, Median & Mode
- Correlation Coefficient | Types, Formulas & Examples
- Descriptive Statistics | Definitions, Types, Examples
- How to Calculate Standard Deviation (Guide) | Calculator & Examples
- How to Calculate Variance | Calculator, Analysis & Examples
- How to Find Degrees of Freedom | Definition & Formula
- How to Find Interquartile Range (IQR) | Calculator & Examples
- How to Find Outliers | Meaning, Formula & Examples
- How to Find the Geometric Mean | Calculator & Formula
- How to Find the Mean | Definition, Examples & Calculator
- How to Find the Median | Definition, Examples & Calculator
- How to Find the Range of a Data Set | Calculator & Formula
- Inferential Statistics | An Easy Introduction & Examples
- Levels of measurement: Nominal, ordinal, interval, ratio
- Missing Data | Types, Explanation, & Imputation
- Normal Distribution | Examples, Formulas, & Uses
- Null and Alternative Hypotheses | Definitions & Examples
- Poisson Distributions | Definition, Formula & Examples
- Skewness | Definition, Examples & Formula
- T-Distribution | What It Is and How To Use It (With Examples)
- The Standard Normal Distribution | Calculator, Examples & Uses
- Type I & Type II Errors | Differences, Examples, Visualizations
- Understanding Confidence Intervals | Easy Examples & Formulas
- Variability | Calculating Range, IQR, Variance, Standard Deviation
- What is Effect Size and Why Does It Matter? (Examples)
- What Is Interval Data? | Examples & Definition
- What Is Nominal Data? | Examples & Definition
- What Is Ordinal Data? | Examples & Definition
- What Is Ratio Data? | Examples & Definition
- What Is the Mode in Statistics? | Definition, Examples & Calculator

QualiFLY™ Institutions
You can QualiFLY™ to a prestigious DASCA Credential if you are a student or an alumnus of a DASCA-recognized institution!
Discover QualiFLY™
QualiFLY™ Accelerate your journey to the World's most powerful Data Science Credentials!
Check if You QualiFLY™!
Dasca recognized institutions, qualifly™ tracks.
As part of our mission to catalyze the development of a new crop of data analysts, data scientists, and data engineers, we are thrilled to announce the launch of new online communities for data science professionals - Data Science Current and Data Engineering Digest.
Visit now to sign up and receive your custom newsletters.

Insider stories of the moving and shaking in the big and exciting world of Data Science!
Sharp recap on the groundbreaking in Data Science thoughts, practices, and technologies!
- Expert Talks
The bridge between knowledge and insight: Expert conversations that delve into data science's most critical aspects.
Contribute to the DASCA community with your unique insights and expert knowledge.
A quick round-up of the latest DASCA press releases, announcements, news, and updates.
- Examination
- Get Started
Certifications
- Big Data Engineering Certifications

- Big Data Analytics Certifications

- Data Scientist Certifications

DASCA Certification Exams
Available across 180+ countries, DASCA certification exams are built on 5th generation TEI technologies delivered.
- Careers in Big Data
DASCA-EKF™ for Data Science Professionals
Digitally badged credentials.
- QualiFLY™
Exam Policies
- Which Certification is right for you

DASCA Certifications for Big Data Engineers, Big Data Analysts, & Data Scientists are the world's most powerful independent professional credentials today. Choose the credential that suits you best!
- Accreditation
DASCA Partnership Opportunities
Big Data technology stables, Big Data consulting outfits, IT training companies, leading universities, business schools, higher education institutions, and government ICT academies – all are adding to the rapidly growing DASCA worldwide network. And if your organization is yet to ally with us, well, then just start the process now! We'll be privileged to have you join in.

- For Universities & Institutions
Get your academic programs DASCA accredited. Become a prized DASCA institutional partner. Leverage the subsidy program of the World Data Science Initiative.

For Tech Companies & Other Organizations
Get your data analysts, data engineers and data scientists DASCA certified. Establish a long-term partnership with DASCA for sustainable development of data science talent.

- For Training Companies
Enrich your analytics and data science training programs with DASCA certifications. Make your academy a prestigious DASCA education and exam-prep training provider.

- For Advocacy Partnership
Join hands for propagating standards-backed education in data science. Collaborate to align data science curricula in colleges and schools with the DASCA body of knowledge.

The DASCA Credentialing Rigor
The DASCA Body of Knowledge and the DASCA Essential Knowledge Framework together present the world’s most rigorous and complete definition of professional excellence drivers for Big Data stakeholders.
DASCA Body Of Knowledge
The comprehensive DASCA Body of Knowledge underlies the assessment and credentialing mechanisms of DASCA Certifications.
Essential Knowledge Framework (EKF™)
The Essential Knowledge Framework (EKF™) codes down the world’s most authoritative skills-framework for Data Science professionals.
- Initiatives
DASCA standards, knowledge frameworks, certifications, and knowledgeware together reflect industry-leading initiatives to develop big data analyst, engineers and data scientists who can work across a range of analytics technologies and platforms.
- The Big Data ERA
- Data Science Professions
- DASCA Governance
DASCA Advantage
DASCA's pioneering credentials for big data analysts, application developers and data scientists are powerfully cross-platform, vendor-neutral and deployable across a range of operational levels in most industries.
- For Analysts, Developers & Data Scientists
- For Graduating Students
- For Organizations & Recruiters
Get yourself, your students, or your employees DASCA certified. Partner DASCA for education. Get your institution DASCA accredited. It’s easy, fast and online.
We're eager to listen to you.
- About DASCA
- DASCA Benefits
- Certifications for Professionals
- Associate Big Data Engineer (ABDE™)
- Renewal for ABDE™
- Upgrade for ABDE™
- Senior Big Data Engineer (SBDE™)
- Renewal for SBDE™
- Associate Big Data Analyst (ABDA™)
- Renewal for ABDA™
- Upgrade for ABDA™
- Senior Big Data Analyst (SBDA™)
- Renewal for SBDA™
- Senior Data Scientist (SDS™)
- Renewal for SDS™
- Upgrade for SDS™
- Principal Data Scientist (PDS™)
- Examinations
- Partnerships
- For Universities & Institutions
- For Big Data & IT Companies
- Earn yourself a DASCA Certification
- Get your Employees Certified
- Get your Students Certified
- Get your Institution DASCA-Accredited
- Become a DASCA Authorized Education Provider
- Become a DASCA Advocacy Partner
- How to become DASCA Certified
- World of Data Science
- The Credentialing Framework
- Frequently Asked Questions
- Apply for certifications

How to Choose the Perfect Data Analysis Tool: A Step-by-Step Guide

The ability of Data analysis to provide relevant information to diverse firms is achieved in contemporary businesses. Thus, with the huge quantities of information generated in recent times, Data analysis tools have become even more critical. They simplify processes of sorting through complicated information and make it easier for the professional to process information and research data for meaningful conclusions from large sets. There is an effective guide on the best services for data analysis with key features, the purpose of the application, and selection criteria based on the type of data analysis.
Criteria for Choosing Data Analysis Tools
Selecting the right data analysis tools involves considering several critical factors:
- Type of Data and Complexity: Some of the critical factors that influence when choosing the right tool are derived from the nature of the collected data which may be structured, unstructured, or big. Software such as Apache Hadoop best serves large data sets, but Excel is reasonable for modest tasks.
- Types of Data Analysis Required: Another advantage is that there are unique tools for specific data analysis. For example, Python and R are suitable for exploratory data analysis and machine learning in contrast with Tableau which has been deemed favorable for producing interactive reports.
- User Expertise and Technical Skills: Assess the overall technological expertise of the team. Microsoft Excel and tablet apps are mostly preferred because they are easy to use, while Python and R are based on some knowledge of computer programming.
- Integration with Existing Systems: Check that the tool fits in with the existing infrastructure and other software in place.
- Scalability and Performance: Determine if the tool can meet your current and future data volumes and learn if it has efficient performance when it is dealing with large amounts of data.
Top Data Analysis Tools and Their Use Cases
Choosing the right data analysis tools can significantly enhance the efficiency and accuracy of data-driven decision-making processes. Here’s a detailed list of some top tools and their best use cases:

1. Microsoft Excel
Overview of features:
- Microsoft Excel is a very common spreadsheet with advanced calculating and graphical tools.
- It comprises tools like pivot tables, conditional formatting, and the like; as built-in formulas for statistical, financial, and logical calculations.
- Microsoft Excel allows importing content from other sources and using other Office programs.
Best suited for:
- An example of such simple analytics is sorting, filtering, and aggregation of data.
- Fast data analysis and data visualization with the help of charts and graphs.
- Distributed data that is of small to medium size and is going to be accessed by several users without delays and with little focus on the usability of the system.
- Working with prototyped assignments for more difficult data analysis before progressing to sophisticated software.
Advantages and limitations:
- Advantages: Possesses a user-friendly GUI, is well-documented, and is available with a large number of users. It also supports a wide range of add-ins, and it allows the user to have complete control through VBA.
- Limitations: Inability to deal with large dataset size, shortcomings in advanced statistics and machine learning, and using excessive memory in handling very large models.
2. Apache Hadoop
- Apache Hadoop is an open-source Big Data platform, which is responsible for distributed storage and processing using the MapReduce programming model.
- It consists of four main modules: Hadoop Common, Hadoop Distributed File System (HDFS), Hadoop YARN, and Hadoop MapReduce.
- Hadoop also has tools like Apache Hive, Apache Pig, and Apache Hbase which makes it a bit more powerful in processing and analyzing the data.
- Processing and storing massive amounts of structured and unstructured data across distributed machines.
- They distributed environments where work is partitioned directly into sub-tasks to work in parallel.
- Analytical intelligence in industries such as banking, medical services, and retail.
- Advantages: Scalability to manage data increases, cost-effectiveness in data storage, fault tolerance of data over the network, and flexibility in data storage management.
- Limitations: To install and maintain the solution the organization needs highly qualified engineers who can manage it. It also has higher latency for some types compared to competitors’ offerings and includes somewhat complicated debugging and troubleshooting procedures.
3. IBM SPSS
- SPSS (Statistical Package for the Social Sciences) is an advanced analytical software solution for statistical analysis in business. It has added statistical analysis, data editing, and documentation capabilities.
- Statistical analysis in social sciences: SPSS is one of the most preferred statistical analytic software in academia for social science research because of the large number of statistical tests required in such studies and the software’s user-friendliness.
- Handling complex survey data: SPSS is suitable for processing and analyzing survey data, which is a major component of work in market research, health research, and education research fields.
- Predictive data analysis: As a statistical data analysis tool, SPSS can use past data to identify trends and predict future occurrences.
- Advantages: Friendly for its GUI, offers statistical function highly, robust on big datasets, and good on survey data analysis.
- Limitations: Expensive for professional editions, complicated user interface for more advanced tools, and weak connectivity with other trendy data science platforms by comparison to open-source platforms like Python and R .
4. RapidMiner
- RapidMiner is an easy-to-use yet versatile tool that offers much to the field of data analysis and machine learning. It creates an easy design workflow for users with both technical and technical expertise. RapidMiner accepts several data formats and is easily incorporated with other tools and databases, thus increasing its flexibility.
Best Suited For:
- Data mining and machine learning: In terms of algorithms available for both data analysis and model building, rapid mining is sufficient for advanced data analysis.
- End-to-end data science workflows: RapidMiner is a process of data science with a solution for each step of the analyst process.
- Predictive data analysis: RapidMiner is considered powerful for modeling historical data to predict outcomes.
Advantages and Limitations:
- Advantages: RapidMiner has an interesting graphical interface that enables the user to create complex data analysis workflows without using programming.
- Limitations: RapidMiner is simple to use but there are some of the features that will take the not-so-technically inclined user a while to figure out.
5. Google Data Studio
- Google Data Studio is a business intelligence application that provides free report and dashboard creation and sharing.
- It is possible to connect GA to various Google services like Google Analytics, Google Ads, Google Sheets, and other sources of data.
- The customers can independently develop graphs, use templates, and use drag and drop to simplify the operations.
- Strategy for the development of visually appealing and interactive reports and dashboards.
- Working with and displaying data from different sources specifically those from the Google world.
- Using descriptive statistics procedures to analyze data for trends and patterns.
- Advantages: Easy to use, complete with live sharing, not available at a cost, and highly supported on Google applications.
- Limitations: Compared to more specialized tools, reduced scope of advanced analytics capabilities, need for Internet connectivity, and reliance on the Cloud for data storage.
Matching Tools to Use Cases
The choice of statistical analysis tools also depends on the nature of the analysis that needs to be carried out. Here are three key factors to consider
1. Type of Analysis Required:
- For descriptive analysis: Microsoft Excel and Google Data Studio are perfect with their user-friendliness and visualization power.
- For predictive analysis : Python and R are perfect examples of scientific languages due to their strong focus on advanced statistical and machine learning opportunities.
- For prescriptive analysis: The best software solutions to process massive data and model complicated data are SAS and Apache Hadoop.
2. Data Volume and Complexity:
- Small to medium datasets: For these some basic analysis and visualization capabilities can easily be supported by Microsoft Excel and Tableau.
- Large datasets: The Apache Hadoop and SQL are meant to aid in handling immense volumes of data that a database can be expected to handle without compromising on the speed.
3. User Expertise:
- Beginners: The interface of Microsoft Excel and IBM SPSS is quite simple and has simple analysis functions.
- Advanced users: Python and R have rich libraries and possibilities for deep exploratory data analysis.
The right data analysis tools in data analytics are essential for collecting useful information and making decisions. All the above discussed tools are useful in their own right and have a specific range of applications – from simple manipulations in Microsoft Excel to calculating statistics in R and Python. The choice depends on your project’s specifics, the data complexity, the level of users’ skills, and the ability to integrate tools. The right balance of tools improves analytical skills, empowers organizations to develop and maintain effective techniques for decision-making, and helps to produce planned results that are easily actionable and reliable for any organization.

Brought to you by DASCA

Top KPIs for Data Teams: A Blueprint for Data-Driven Success
This guide provides valuable insights into how KPIs enable data teams to monitor goals, track progress, identify opportunities, and make informed decisions for optimal performance.
This Guide Covers
- Essential Characteristics of KPIs
- Importance of Measuring KPIs for Data Teams
- The Critical Role of Data Teams Across Business Functions
- Top 6 KPIs for Data Teams
- How to create KPIs in 5 simple steps
Suggested Articles

Stay Updated!
Keep up with the latest in Data Science with the DASCA newsletter.
This website uses cookies to enhance website functionalities and improve your online experience. By browsing this website, you agree to the use of cookies as outlined in our privacy policy .
Mastering Qualitative Data Analysis: The Step-by-Step Process & 5 Essential Methods
12 min read

Wondering how to analyze qualitative data and get actionable insights? Search no further!
This article will help you analyze qualitative data and fuel your product growth . We’ll walk you through the following steps:
- 5 Qualitative data analysis methods.
- 5 Steps to analysing qualitative data.
- How to act on research findings.
Let’s get started!
- Qualitative data analysis turns non-numerical data into insights, including customer feedback , surveys, and interviews.
- Qualitative data provides rich insights for refining strategies and uncovering growth opportunities.
- The benefits of qualitative data analysis include deep insight, flexibility, contextual understanding, and amplifying participant voices.
- Challenges include data overload, reliability, and validity concerns, as well as time-intensive nature.
- Qualitative and quantitative data analysis differ in analyzing numerical vs. non-numerical data.
- Qualitative data methods include content analysis, narrative analysis, discourse analysis, thematic analysis, and grounded theory analysis.
- Content analysis involves systematically analyzing text to identify patterns and themes.
- Narrative analysis interprets stories to understand customer feelings and behaviors.
- The thematic analysis identifies patterns and themes in data.
- Grounded theory analysis generates hypotheses from data.
- Choosing a method depends on research questions, data type, context, expertise, and resources.
- The qualitative data analysis process involves defining questions, gathering data, organizing, coding, and making hypotheses.
- Userpilot facilitates qualitative data collection through surveys and offers NPS dashboard analytics.
- Building in-app experiences based on qualitative insights enhances user experience and drives satisfaction.
- The iterative qualitative data analysis process aims to refine understanding of the customer base.
- Userpilot can automate data collection and analysis, saving time and improving customer understanding. Book a demo to learn more!

Try Userpilot and Take Your Qualitative Research to the Next Level
- 14 Day Trial
- No Credit Card Required

What is a qualitative data analysis?
Qualitative data analysis is the process of turning qualitative data — information that can’t be measured numerically — into insights.
This could be anything from customer feedback, surveys , website recordings, customer reviews, or in-depth interviews.
Qualitative data is often seen as more “rich” and “human” than quantitative data, which is why product teams use it to refine customer acquisition and retention strategies and uncover product growth opportunities.
Benefits of qualitative data analysis
Here are the key advantages of qualitative data analysis that underscore its significance in research endeavors:
- Deep Insight: Qualitative data analysis allows for a deep understanding of complex patterns and trends by uncovering underlying meanings, motivations, and perspectives.
- Flexibility: It offers flexibility in data interpretation, allowing researchers to explore emergent themes and adapt their analysis to new insights.
- Contextual Understanding: Qualitative analysis enables the exploration of contextual factors, providing rich context to quantitative findings and uncovering hidden dynamics.
- Participant Voice: It amplifies the voices of participants, allowing their perspectives and experiences to shape the analysis and resulting interpretations.
Challenges of qualitative data analysis
While qualitative data analysis offers rich insights, it comes with its challenges:
- Data Overload and Management: Qualitative data often comprises large volumes of text or multimedia, posing challenges in organizing, managing, and analyzing the data effectively.
- Reliability and Validity: Ensuring the reliability and validity of qualitative findings can be complex, as there are fewer standardized measures compared to quantitative analysis, requiring meticulous attention to methodological rigor.
- Time-Intensive Nature: Qualitative data analysis can be time-consuming, involving iterative processes of coding, categorizing, and synthesizing data, which may prolong the research timeline and increase resource requirements.
Quantitative data analysis vs. Qualitative data analysis
Here let’s understand the difference between qualitative and quantitative data analysis.
Quantitative data analysis is analyzing numerical data to locate patterns and trends. Quantitative research uses numbers and statistics to systematically measure variables and test hypotheses.
Qualitative data analysis , on the other hand, is the process of analyzing non-numerical, textual data to derive actionable insights from it. This data type is often more “open-ended” and can be harder to conclude from.
However, qualitative data can provide insights that quantitative data cannot. For example, qualitative data can help you understand how customers feel about your product, their unmet needs , and what motivates them.
Other differences include:

What are the 5 qualitative data analysis methods?
There are 5 main methods of qualitative data analysis. Which one you choose will depend on the type of data you collect, your preferences, and your research goals.

Content analysis
Content analysis is a qualitative data analysis method that systematically analyses a text to identify specific features or patterns. This could be anything from a customer interview transcript to survey responses, social media posts, or customer success calls.
The data is first coded, which means assigning it labels or categories.
For example, if you were looking at customer feedback , you might code all mentions of “price” as “P,” all mentions of “quality” as “Q,” and so on. Once manual coding is done, start looking for patterns and trends in the codes.
Content analysis is a prevalent qualitative data analysis method, as it is relatively quick and easy to do and can be done by anyone with a good understanding of the data.

The advantages of content analysis process
- Rich insights: Content analysis can provide rich, in-depth insights into how customers feel about your product, what their unmet needs are, and their motives.
- Easily replicable: Once you have developed a coding system, content analysis is relatively quick and easy because it’s a systematic process.
- Affordable: Content analysis requires very little investment since all you need is a good understanding of the data, and it doesn’t require any special software.
The disadvantages of content analysis process
- Time-consuming: Coding the data is time-consuming, particularly if you have a large amount of data to analyze.
- Ignores context: Content analysis can ignore the context in which the data was collected which may lead to misinterpretations.
- Reductive approach: Some people argue that content analysis is a reductive approach to qualitative data because it involves breaking the data down into smaller pieces.
Narrative analysis
Analysing qualitative data with narrative analysis involves identifying, analyzing, and interpreting customer or research participants’ stories. The input can be in the form of customer interviews, testimonials, or other text data.
Narrative analysis helps product managers to understand customers’ feelings toward the product identify trends in customer behavior and personalize their in-app experiences .
The advantages of narrative analysis
- Provide a rich form of data: The stories people tell give a deep understanding of customers’ needs and pain points.
- Collects unique, in-depth data based on customer interviews or testimonials.
The disadvantages of narrative analysis
- Hard to implement in studies of large numbers.
- Time-consuming: Transcribing customer interviews or testimonials is labor-intensive.
- Hard to reproduce since it relies on unique customer stories.
Discourse analysis
Discourse analysis is about understanding how people communicate with each other. It can be used to analyse written or spoken language. For instance, product teams can use discourse analysis to understand how customers talk about their products on the web.
The advantages of discourse analysis
- Uncovers motivation behind customers’ words.
- Gives insights into customer data.
The disadvantages of disclosure analysis
- Takes a large amount of time and effort as the process is highly specialized and requires training and practice. There’s no “right” way to do it.
- Focuses solely on language.
Thematic analysis
Thematic analysis is a popular qualitative data analysis method that identifies patterns and themes in data. The process of thematic analysis involves coding the data, which means assigning it labels or categories.
It can be paired with sentiment analysis to determine whether a piece of writing is positive, negative, or neutral. This can be done using a lexicon (i.e., a list of words and their associated sentiment scores).
A common use case for thematic analysis in SaaS companies is customer feedback analysis with NPS surveys and NPS tagging to identify patterns among your customer base.
The advantages of thematic analysis
- Doesn’t require training: Anyone with little training on how to label the data can perform thematic analysis.
- It’s easy to draw important information from raw data: Surveys or customer interviews can be easily converted into insights and quantitative data with the help of labeling.
- An effective way to process large amounts of data if done automatically: you will need AI tools for this.
The disadvantages of thematic analysis
- Doesn’t capture complex narratives: If the data isn’t coded correctly, it can be difficult to identify themes since it’s a phrase-based method.
- Difficult to implement from scratch because a perfect approach must be able to merge and organize themes in a meaningful way, producing a set of themes that are not too generic and not too large.
Grounded theory analysis
Grounded theory analysis is a method that involves the constant comparative method, meaning qualitative researchers analyze and code the data on the fly.
The grounded theory approach is useful for product managers who want to understand how customers interact with their products . It can also be used to generate hypotheses about how customers will behave in the future.
Suppose product teams want to understand the reasons behind the high churn rate , they can use customer surveys and grounded theory to analyze responses and develop hypotheses about why users churn and how to reengage inactive ones .
You can filter the disengaged/inactive user segment to make analysis easier.
The advantages of ground theory analysis
- Based on actual data, qualitative analysis is more accurate than other methods that rely on assumptions.
- Analyse poorly researched topics by generating hypotheses.
- Reduces the bias in interpreting qualitative data as it’s analyzed and coded as it’s collected.
The disadvantages of ground theory analysis
- Overly theoretical
- Requires a lot of objectivity, creativity, and critical thinking
Which qualitative data analysis method should you choose?
We have covered different qualitative data analysis techniques with their pros and cons but choosing the appropriate qualitative data analysis method depends on various factors, including:
- Research Question : Different qualitative methods are suitable for different research questions.
- Nature of Data : Consider the type of data you have collected—interview transcripts, reviews, or survey responses—and choose a method that aligns with the data’s characteristics. For instance, thematic analysis is versatile and can be applied to various types of qualitative data, while narrative analysis focuses specifically on stories and narratives.
- Research Context : Take into account the broader context of your research. Some qualitative methods may be more prevalent or accepted in certain fields or contexts.
- Researcher Expertise : Consider your own skills and expertise in qualitative analysis techniques. Some methods may require specialized training or familiarity with specific software tools. Choose a method that you feel comfortable with and confident in applying effectively.
- Research Goals and Resources : Evaluate your research goals, timeline, and resources available for analysis. Some methods may be more time-consuming or resource-intensive than others. Consider the balance between the depth of analysis and practical constraints.
How to perform qualitative data analysis process in steps
With all that theory above, we’ve decided to elicit the essential steps of qualitative research methods and designed a super simple guide for gathering qualitative data.
Let’s dive in!
Step 1: Define your qualitative research questions
The qualitative analysis research process starts with defining your research questions . It’s important to be as specific as possible, as this will guide the way you choose to collect qualitative research data and the rest of your analysis.
Examples are:
- What are the primary reasons customers are dissatisfied with our product?
- How does X group of users feel about our new feature?
- What are our customers’ needs, and how do they vary by segment?
- How do our products fit into our customers’ lives?
- What factors influence the low feature usage rate of the new feature ?
Step 2: Gather your qualitative customer data
Now, you decide what type of data collection to use based on previously defined goals. Here are 5 methods to collect qualitative data for product companies:
- User feedback

- NPS follow-up questions

- Review sites

- User interviews
- Focus groups
We recommend using a mix of in-app surveys and in-person interviews. The former helps to collect rich data automatically and on an ongoing basis. You can collect user feedback through in-product surveys, NPS platforms, or use Zoom for live interviews.
The latter enables you to understand the customer experience in the business context as you can ask clarifying questions during the interviews.
Try Userpilot and Easily Collect Qualitative Customer Data
Step 3: organize and categorize collected data.
Before analyzing customer feedback and assigning any value, unstructured feedback data needs to be organized in a single place. This will help you detect patterns and similar themes more easily.
One way to do this is to create a spreadsheet with all the data organized by research questions. Then, arrange the data by theme or category within each research question.
You can also organize NPS responses with Userpilot . This will allow you to quickly calculate scores and see how many promoters, passives, and detractors there are for each research question.

Step 4: Use qualitative data coding to identify themes and patterns
Themes are the building blocks of analysis and help you understand how your data fits together.
For product teams, an NPS survey might reveal the following themes: product defect, pricing, and customer service. Thus, the main themes in SaaS will be around identifying friction points, usability issues, UI issues, UX issues, missing features, etc.
You need to define specific themes and then identify how often they occur. In turn, the pattern is a relationship between 2 or multiple elements (e.g. users who have specific JTBD complain of a specific missing feature).
You can detect those patterns from survey analytics.

Pair themes with in-app customer behavior and product usage data to understand whether different user segments fall under specific feedback themes.

Following this step, you will get enough data to improve customer loyalty .
Step 5: Make hypotheses and test them
The last step in qualitative research is to analyze the data collected to find insights. Segment your users based on in-app behavior, user type, company size, or job to be done to draw meaningful decisions.
For instance, you may notice that negative feedback stems from the customer segment that recently engaged with XYZ features. Just like that, you can pinpoint friction points and the strongest sides of your product to capitalize on.
How to perform qualitative data analysis with Userpilot
Userpilot is a product growth platform that helps product managers collect and analyze qualitative data. It offers a suite of features to make it easy to understand how users interact with your product, their needs, and how you can improve user experience.
When it comes to performing qualitative research, Userpilot is not a qualitative data analysis software but it has some very useful features you could use.
Collect qualitative feedback from users with in-app surveys
Userpilot facilitates the collection of qualitative feedback from users through in-app surveys.
These surveys can be strategically placed within your application to gather insights directly from users while they interact with your product.
By leveraging Userpilot’s in-app survey feature, you can gather valuable feedback on user experiences, preferences, pain points , and suggestions for improvement.

Benefit from NPS dashboard and survey analytics
With Userpilot, you can harness the power of the NPS (Net Promoter Score) dashboard and survey analytics to gain valuable insights into user sentiment and satisfaction levels.
The NPS dashboard provides a comprehensive overview of your NPS scores over time, allowing you to track changes and trends in user loyalty and advocacy.
Additionally, Userpilot’s survey analytics offer detailed insights into survey responses, enabling you to identify common themes, uncover actionable feedback, and prioritize areas for improvement.
Build different in-app experiences based on the insights from qualitative data analysis
By analyzing qualitative feedback collected through in-app surveys, you can segment users based on these insights and create targeted in-app experiences designed to address specific user concerns or enhance key workflows.

Whether it’s guiding users through new features, addressing common user challenges, or personalizing the user journey based on individual preferences, Userpilot empowers you to deliver a more engaging and personalized user experience that drives user satisfaction and product adoption.
The qualitative data analysis process is iterative and should be revisited as new data is collected. The goal is to constantly refine your understanding of your customer base and how they interact with your product.
Want to get started with qualitative analysis? Get a Userpilot Demo and automate the data collection process. Save time on mundane work and understand your customers better!
Try Userpilot and Take Your Qualitative Data Analysis to the Next Level
Leave a comment cancel reply.
Save my name, email, and website in this browser for the next time I comment.

Get The Insights!
The fastest way to learn about Product Growth,Management & Trends.
The coolest way to learn about Product Growth, Management & Trends. Delivered fresh to your inbox, weekly.
The fastest way to learn about Product Growth, Management & Trends.
You might also be interested in ...
How to build a churn prediction model to predict customer churn, what is net revenue retention and how to calculate it.
Userpilot Content Team
Feedback Analysis: How To Analyze Both Qualitative and Quantitative Feedback Data
Aazar Ali Shad
Click through the PLOS taxonomy to find articles in your field.
For more information about PLOS Subject Areas, click here .
Loading metrics
Open Access
Peer-reviewed
Research Article
Initial data analysis for longitudinal studies to build a solid foundation for reproducible analysis
Roles Conceptualization, Data curation, Formal analysis, Methodology, Project administration, Software, Supervision, Validation, Visualization, Writing – original draft, Writing – review & editing
* E-mail: [email protected]
Affiliations Department of Mathematics, Faculty of Mathematics, Natural Sciences and Information Technologies, University of Primorska, Koper, Capodistria, Slovenia, Institute for Biostatistics and Medical Informatics, Faculty of Medicine, University of Ljubljana, Ljubljana, Slovenia
Roles Conceptualization, Methodology, Writing – original draft, Writing – review & editing
Affiliation Univ. Bordeaux, Inserm, Bordeaux Population Health Research Center, UMR1219, Bordeaux, France
Roles Conceptualization, Methodology, Writing – review & editing
Affiliation Institute for community Medicine, SHIP-KEF University Medicine of Greifswald, Greifswald, Germany
Affiliations Clinical Epidemiology and Biostatistics Unit, Murdoch Children’s Research Institute, Melbourne, Australia, University of Melbourne, Melbourne, Australia
Affiliations Department of Clinical Epidemiology and Department of Biomedical Data Sciences, Leiden University Medical Center, Leiden, The Netherlands, Department of Biomedical Data Sciences, Leiden University Medical Center, Leiden, The Netherlands
Roles Visualization, Writing – review & editing
Affiliation Novartis, Basel, Switzerland
Roles Methodology, Writing – review & editing
Affiliation Center for Statistical Training and Consulting, Michigan State University, East Lansing, MI, United States of America
Affiliations Center for Statistical Training and Consulting, Michigan State University, East Lansing, MI, United States of America, Department of Statistics and Probability, Michigan State University, East Lansing, MI, United States of America
¶ Membership list can be found in the Acknowledgments Section.
- Lara Lusa,
- Cécile Proust-Lima,
- Carsten O. Schmidt,
- Katherine J. Lee,
- Saskia le Cessie,
- Mark Baillie,
- Frank Lawrence,
- Marianne Huebner,
- on behalf of TG3 of the STRATOS Initiative
- Published: May 29, 2024
- https://doi.org/10.1371/journal.pone.0295726
- Reader Comments
Initial data analysis (IDA) is the part of the data pipeline that takes place between the end of data retrieval and the beginning of data analysis that addresses the research question. Systematic IDA and clear reporting of the IDA findings is an important step towards reproducible research. A general framework of IDA for observational studies includes data cleaning, data screening, and possible updates of pre-planned statistical analyses. Longitudinal studies, where participants are observed repeatedly over time, pose additional challenges, as they have special features that should be taken into account in the IDA steps before addressing the research question. We propose a systematic approach in longitudinal studies to examine data properties prior to conducting planned statistical analyses. In this paper we focus on the data screening element of IDA, assuming that the research aims are accompanied by an analysis plan, meta-data are well documented, and data cleaning has already been performed. IDA data screening comprises five types of explorations, covering the analysis of participation profiles over time, evaluation of missing data, presentation of univariate and multivariate descriptions, and the depiction of longitudinal aspects. Executing the IDA plan will result in an IDA report to inform data analysts about data properties and possible implications for the analysis plan—another element of the IDA framework. Our framework is illustrated focusing on hand grip strength outcome data from a data collection across several waves in a complex survey. We provide reproducible R code on a public repository, presenting a detailed data screening plan for the investigation of the average rate of age-associated decline of grip strength. With our checklist and reproducible R code we provide data analysts a framework to work with longitudinal data in an informed way, enhancing the reproducibility and validity of their work.
Citation: Lusa L, Proust-Lima C, Schmidt CO, Lee KJ, le Cessie S, Baillie M, et al. (2024) Initial data analysis for longitudinal studies to build a solid foundation for reproducible analysis. PLoS ONE 19(5): e0295726. https://doi.org/10.1371/journal.pone.0295726
Editor: Arka Bhowmik, Memorial Sloan Kettering Cancer Center, UNITED STATES
Received: November 27, 2023; Accepted: March 13, 2024; Published: May 29, 2024
Copyright: © 2024 Lusa et al. This is an open access article distributed under the terms of the Creative Commons Attribution License , which permits unrestricted use, distribution, and reproduction in any medium, provided the original author and source are credited.
Data Availability: Data are available for research purposes at https://share-eric.eu/data/data-access .
Funding: Lara Lusa was partially supported by the research program "Methodology for data analysis in medicine" (P3-0154) of the Slovenian Research and Innovation Agency (ARIS). The funders had no role in study design, data collection and analysis, decision to publish, or preparation of the manuscript.
Competing interests: The authors have declared that no competing interests exist.
1 Introduction
Initial data analysis (IDA) is the part of the data pipeline that commonly takes place between the end of data retrieval and the beginning of data analysis that addresses the research question. The main aim of IDA is to provide reliable knowledge about data so that appropriate statistical analyses can be conducted, ensuring transparency, integrity, and reproducibility. This is necessary for accurate interpretation of results to answer predefined research questions.
A general framework of IDA for observational studies includes the following six steps: (1) metadata setup (to summarize the background information about data), (2) data cleaning (to identify and correct technical errors), (3) data screening (to examine data properties), (4) initial data reporting (to document findings from the previous steps), (5) refining and updating the research analysis plan, and (6) documenting and reporting IDA in research papers [ 1 ]. Statistical practitioners often do not perform such necessary steps in a systematic way. They may combine data screening steps with analyses steps leading to ad-hoc decisions; however, maintaining a structured workflow is a fundamental step towards reproducible research [ 2 ].
The value of an effective IDA strategy for data analysts lies in ensuring that data are of sufficient quality, that model assumptions made in the analysis strategy are satisfied and are adequately documented; IDA also supports decisions for the statistical analyses [ 3 ]. IDA data screening investigations could lead to discovery of data properties that may identify errors beyond those addressed in data cleaning, affect the interpretation of results of statistical models, and/or modify the choices linked to the specification of the model.
There are many tools for data screening, including numerical data summaries and data visualizations, that are common for IDA and for exploratory data analysis (EDA, [ 4 ]) [ 5 ]. However, IDA and EDA have different objectives and differ in emphasis. EDA inspects data to uncover patterns in the data or identifies possible errors and anomalies, typically through graphical approaches [ 6 ]. In addition, EDA may include investigations for model building and hypothesis generation in a cyclical manner [ 7 , 8 ].
In contrast, IDA systematically examines data properties and their appropriateness for the intended statistical analyses to answer a pre-specified research question. Thus, IDA is more closely linked to inference than EDA, prioritizing the assurance that data quality is sufficient. A systematic process for IDA is crucial, and steps for IDA should be included in a statistical analysis plan.
The term IDA was first used by Chatfield [ 9 ], aimed at data description and model formulation. However, Chatfield also recognized that post-IDA decisions could bias analyses with spurious deviations to the original analysis plan [ 10 ]. For a more in-depth discussion on the relationship between IDA and EDA, interested readers can refer to [ 11 ] and the introduction chapter of [ 6 ].
The STRengthening Analytical Thinking for Observational Studies (STRATOS) Topic Group 3 on Initial data analysis was established in 2014 [ 12 ] to provide guidance on these controversial issues; they proposed an IDA framework aimed at separating activities to understand data properties and purposefully refraining from hypothesis-generating activities.
An IDA checklist for data screening in the context of regression models for continuous, count or binary outcomes was proposed recently [ 13 ], not considering outcomes that were of survival-type, multivariate or longitudinal. The goal of this study is to extend the checklist to longitudinal studies, where participants are measured repeatedly over time and the main research question is addressed using a regression model; the focus is on data screening (IDA step 3), where the examination of the data properties provide the data analyst with important information related to the intended analysis. While an investigation of missing data, and univariate and multivariate description of variables is common across studies [ 13 ], longitudinal studies pose additional challenges for IDA. Different time metrics, the description of how much much data was collected through the study (how many observations and at which times), missing values across time points, including drop-out, and longitudinal trends of variables should be considered. Model building and inference for longitudinal studies have received much attention [ 14 ], and many textbooks on longitudinal studies discuss data exploration and the specific challenges due to missing values [ 14 – 16 ]; however, a systematic process for data screening is missing.
We propose a comprehensive checklist for the data screening step of the IDA framework, which includes data summaries to help understanding data properties, and their potential impact on the analyses and interpretation of results. The checklist can be used for observational longitudinal studies, which include panel studies, cohort studies, or retrospective studies. Potential applications include medical studies designed to follow-up with patients over time and electronic health records with longitudinal observations and complex surveys. Other aspects of the IDA framework such as data preparation and data cleaning have been discussed elsewhere [ 17 , 18 ].
This paper is an effort to bring attention to a systematic approach of initial data analysis for longitudinal studies that could affect the analysis plan, presentation, or interpretation of modeling results. This contributes to the general aim of the international initiative STRATOS ( http://stratos-initiative.org , [ 12 ]).
We outline the setting and scope of our paper in Section 2. We describe the necessary steps for data screening of longitudinal studies in Section 3, where a check list is also provided. A case study is presented in Section 4, using hand grip strength from a data collection across several waves in a complex survey [ 19 ]; we present several data summarizations and visualizations, and provide a reproducible R vignette for this application. Possible consequences of the IDA findings for the analyses in this case study are presented in Section 4.5, where we discuss the potential implications to the statistical modeling or interpretation of results based on the evaluation of the data properties. In the discussion we emphasize the importance of integrating IDA into study protocols and statistical analysis plans and comment on the anticipated utility of our checklist and reproducible code for researchers working with longitudinal data.
2 Setting and scope
A plan for data screening should be matched to the research aims, study settings, and analysis strategy. We assume that the study protocol describes a research question that involves longitudinal data, where the outcome variable is measured repeatedly over time, and is analysed using a regression model applied to all time points or measurements. We assume that baseline explanatory variables are measured, and consider also the possibility of time-varying explanatory variables.
“Measurement” in longitudinal studies could refer to a data collection with survey instruments, interviews, physical examinations, or laboratory measurements. Time points at which the measurements are obtained and the number of measurements can vary between individuals. Time series, time-to-event models, or applications where the number of explanatory variables is extremely large (omics/high-dimensional) are out-of-scope for this paper. We assume that only one outcome variable is measured repeatedly over time, but most of the considerations would apply also to longitudinal studies with multiple outcomes. We focus on observational longitudinal studies, but most of the explorations that we propose would also be appropriate for experimental studies.
Important prerequisites for a data-screening checklist have been described in [ 13 ]. A clearly defined research question must be defined, and an analysis strategy for addressing it must be known. The analysis strategy includes the type of statistical model for longitudinal data, defines variables to be considered for the model, expected methods for handling missing data, and model performance measurements. A statistical analysis plan can be built from the analysis strategy and the data screening plan. Structural variables in the context of IDA were introduced in [ 13 ]; these are variables that are likely to be critical for describing the sample (e.g. variables that could highlight specific patterns) and that are used to structure IDA results. They can be demographic variables, variables central to the research aim, or process variables (e.g., variables that describe the process under which data was collected, might be centers where data is collected, providers, locations); they may or be not also explanatory variables used in the analysis strategy. They help to organize IDA results to provide a clear overview of data properties. In particular, this might reduce the number of cocievable multivariable explorations. For example, the attention can be directed towards a detailed exploration of the association between the explanatory variables and structural variables, rather than presenting all possible associations among explanatory variables [ 13 ].
Moreover, data summaries stratified by structural variables can provide further insights about the data. For example, important characteristics of the data collection process can be apparent when the data are stratified by the center where data were collected. Key predictors in a model, such as sex and age could reveal important information about the variable distributions in the study population.
We assume that data retrieval, data management and data cleaning (identification of errors and inconsistencies) have already been performed. These aspects comprise specific challenges with longitudinal data, where data sets are prepared in multiple formats (long, one row per measurement, the preferred format for data modeling, and wide, one row per participant, for data visualizations), the harmonization of variable definitions across measurements/over time is often needed, and inconsistencies of repeated measurements across time might be identified during data cleaning. A data dictionary and sufficient meta-data should be available to clarify the meaning and expected values of each variable and information about study protocol and data collection.
An important principle of IDA is, as much as possible, to avoid hypothesis-generating activities. Therefore, in the data-screening process, associations between the outcome variable and the explanatory variables are not evaluated. However, evaluating the changes of the outcome in time is part of the outcome assessment in the IDA for longitudinal data.
Because longitudinal studies can be very heterogeneous in their data structure, it is challenging to propose a unified data-screening checklist. The topics addressed in this paper and summarized in our checklist can be considered a minimum set of analyses to include in an IDA report for transparency and reproducibility to prepare for the statistical modeling that addresses the research questions; the optional extensions present explorations that might be relevant only in some studies.
3 IDA data-screening checklist for longitudinal data
An IDA data-screening domain refers to the type of explorations, such as evaluating missing data, describing univariate and multivariate distributions, as proposed in the checklist for regression models in cross-sectional studies [ 13 ]. To address the specificities of longitudinal studies we extend these IDA domains to include participation profile and longitudinal aspects. The missing values domain is substantially extended, and the univariate and multivariate descriptions include explorations at time points after baseline.
Several items of the IDA screening checklist suggest to summarize data for each time point, which is sensible for study designs where all the individuals have pre-planned common times of measurements or when the number of different times is limited; in this case these times can be used as structural variables in IDA (for instance time visits or waves). For studies where the time points are many and/or uncommon, or not determined by design (random times of observation), we suggest that, for description purposes, the time metric is summarized in intervals and the summaries are provided by time intervals rather than for each of the time points.
The aims of the IDA screening domains and the main aspects of each domain are presented in the following sections, and summarized in Table 1 .
- PPT PowerPoint slide
- PNG larger image
- TIFF original image
https://doi.org/10.1371/journal.pone.0295726.t001
3.1 Participation profile
Aim: (1) to summarize the participation pattern of individuals in the study over time; (2) to describe the time metric(s).
A participation profile represents the temporal patterns in participation. The number of participating individuals, the number of times they were measured, and the distribution of the number of measurements per time point and per individual are described in this IDA screening domain.
Different choices of time metrics are possible depending on the research question. It can be time since inclusion in the study, time since an event, calendar time, age, or measurement occasion (defined as order of pre-planned measurement times for a participant). In some studies, it may be useful to use more than one time metric to describe the study.
Most timescales induce subject-specific times of measurements, which is naturally handled in regression analyses (for instance with mixed models that use the actual times of measurement and where using measurements at time points that are not common for all subject is not problematic), but this poses an additional challenge for summary statistics during IDA steps. When subject-specific times remain closely linked to a shared timescale, for instance planned visits or waves (nominal times), IDA can be done according to the shared timescale, with a mention of the variability the approximation in time induced. The deviations between nominal and actual times should also be explored. In other contexts, for instance, when using age as the time scale in cohorts with heterogeneous ages at baseline, relevant intervals of time need to be considered for summary statistics and overall trends.
The description of the number of observations at each time point in studies with pre-planned times of observations provides information about missing values (discussed more in detail in the next domain), while it does not in study designs that foresee random times of observation [ 16 ].
3.2 Missing values
Aim: (1) to describe missing data over time and by types of missingness (non-enrollment, intermittent visit missingness, loss to follow-up, missing by design, or death); (2) to summarize the characteristics of participants with missing values over time; (3) to describe the variables with missing values; (4) to find possible patterns of missing data across variables; and (5) to evaluate possible predictors of missingness and missing values.
Longitudinal data with complete information are very rare, and missing data are one of the major challenges in the design and analysis of longitudinal studies. Different analysis methods can rely on different assumptions about the missing data mechanism. An incorrect handling of missing data can lead to biased and inefficient inference [ 20 ]. Therefore, a thorough investigation of the pattern of observed missingness before the beginning of the statistical analysis can have major implications for the interpretation of the results or imply possible changes in the analysis strategy.
In longitudinal studies it is important to distinguish between unit missingness (of participants) due to non-enrollment (participants that fulfill inclusion criteria that do not participate in the study), intermittent visit missingness (a missing visit) and drop-out, defined as visit missingness due to attrition/loss-to-follow-up (missing values for participants that previously participated in the study). Additionally, participants may have incomplete follow-up due to death.
It is also possible that some variables (outcome and/or explanatory variables) are missing among participants for which the measurements of the other variables are available at the same visit. This type of partial missingness, at variable rather than participant level, is often defined as variable or item missingness. The methods used to handle different types of missingness in the analyses may differ (for example, survey weights, multiple imputation, maximum likelihood estimation). The analysis strategy determines which aspects of missing value is important to describe.
Missing values in explanatory variables can be handled either by considering complete cases or by performing multiple imputation (MI) [ 21 , 22 ]. In maximum likelihood mixed-based models the imputation of outcome is not needed, as the model intrinsically handles the missing data in the outcome. In survey studies, unit non-enrollment missingness is often addressed using survey weights, which can be used to adjust the analyses for the selection of participants that makes the sample non-representative of its target population.
The number and the known characteristics of the non-responders should be described, along with the characteristics of the participants that are lost during follow-up, the corresponding time points and reasons, if available, and the time of last observed response.
To understand how non-enrollment influences the characteristics of the available sample, some of the main characteristics of the enrolled and non-enrolled (the participants that were selected but did not enter the study) can be compared, if data are available, or the sample of enrolled can be compared to the target population. It is also useful to estimate the probability of drop-out after inclusion during study, stratifying by structural variables. The display of the mean outcome as a function of time stratified by different drop-out times can suggest a relationship between the outcome and the drop-out process [ 15 ].
For item missingness, the frequency and reasons for missing data within single explanatory variable, and the co-occurrence of missing values across different variables (for example, using visualization techniques such as clustering of indicators of missing values) may be used to identify patterns of missingness. The characteristics and number of the participants for which an individual item is missing can also be described separately.
Predictors of missing values can be identified by comparing the characteristics of subjects with complete and incomplete data at each measurement occasion; it is common to compare the baseline characteristics, where the extent of missing values is usually smaller compared to longitudinal measurements.
Another aim within this domain can be to identify potential auxiliary variables, i.e., variables not required for the analysis but that can be used to recover some missing information through their association with the incomplete variables, for example via inclusion in an imputation model (if envisioned in the analysis strategy) or for the construction of survey weights. As this often requires looking at the association between variables, this can be assessed via the multivariate descriptions.
3.3 Univariate descriptions
Aim: (1) to describe all variables that are used in the analysis (outcomes, explanatory variables, structural variables, auxiliary variables) with numerical and graphical summaries at baseline; (2) to describe the time-varying variables at all time points.
The univariate descriptions explore the characteristics of the variables, one at a time. The results can be used to evaluate if the observed distributions are as expected, or to identify problematic aspects (unexpected values, sparse categories, etc). Descriptive statistics can be used to summarize the variables, as described in [ 13 ].
The time-varying variables should be summarized also at time points after baseline. As evoked earlier, discretization into intervals may be indicated if the time metric is on a continuous rather than on a categorical scale and the number of different observed times is large. Different time metrics can be used to summarize the variables. Using the time metric of the data collection process can be useful for the identification of data collection problems (e.g., specific characteristics or problems in some waves). In contrast, the time metric linked to the analysis strategy can provide more useful information about the distributions of the variables to be modelled.
3.4 Multivariate descriptions
Aim: (1) to describe associations between explanatory variables and structural variables or process variables; (2) to describe associations between explanatory variables (focusing mostly on baseline values); (3) to provide stratified summaries of the data.
The explorations proposed in the multivariate domain are very similar to those proposed in the context of IDA for regression modeling [ 13 ], and include the exploration of associations between explanatory variables with structural variables, and the evaluations of associations among explanatory variables. If interactions between explanatory variables are considered, the exploration of the association between these variables should be carefully addressed in IDA [ 13 ].
We suggest to focus primarily on associations between variables at baseline (where usually the missing values are less common). Follow-up times can be considered if the aim is to evaluate if/how the associations change during follow-up; however, the interpretations should be cautious, as the results are based only on observed data and the missing data mechanism that occurs during follow-up can alter the associations.
The distributions of explanatory variables stratified by the values of the structural variables are also described in the multivariate descriptions; the considerations about the influence of missing values on the results apply also for these descriptions; numerical structural variables might require some type of discretization.
We emphasize that a core principle of IDA is to refrain from conducting analyses related to the research question, avoiding numerical or graphical exploration of associations between explanatory variables and the outcome.
3.5 Longitudinal aspects
Aim: (1) to describe longitudinal trends of the time-varying variables including changes and variability within and between subjects; (2) to evaluate the strength of correlation of the repeated measurements across time points.
The exploration of the characteristics of the participants through time is of upmost importance and should be described using the time metric chosen in the analysis strategy. The repeated measurements from the same subject in longitudinal studies are usually correlated, thus IDA should explore the trend of the repeated variables but also the degree of dependence within subjects by evaluating the variance, covariance and correlation on repeated measurements of the outcome variable.
The time-varying explanatory variables can be explored; these explorations are useful for providing domain experts a description of some of the characteristics of the sample that can be compared to the expected. As discussed earlier, descriptive summaries based on the observed longitudinal data might be biased, and should therefore be interpreted carefully.
In many applications it is important to summarize the cohort (individuals who experience the same event in the same time) or period (time when the participants are measured) effect on the outcome and on the explanatory variables. The design of the longitudinal study might make the effect of age, cohort and period difficult to separate and subject to confounding. The results from IDA explorations might indicate the need to take cohort or period effects into account in the modelling.
4 Case study: Age-associated decline in grip strength in the Danish data from the SHARE study
To illustrate the use of the data-screening checklist for longitudinal data we conducted the IDA screening step for a case study, where the research aim was to evaluate the age-associated decline in grip strength. An IDA data screening plan was developed ( S1 File ) and a reproducible and structured IDA report for the analysis was implemented using R language [ 23 ] (version 4.0.2) and made available at https://stratosida.github.io/longitudinal/ ; the report presents the full IDA data screening results and provides the R code for reproducibility.
First, we briefly illustrate the data and the analysis strategy and present the IDA data screening plan; a selected set of explorations are presented in the results, and the possible consequences of the IDA findings are reported and discussed in Section 4.5.
4.1 SHARE data
We used the data from the Survey of Health, Ageing and Retirement in Europe (SHARE). SHARE is a multinational panel data survey, collecting data on medical, economic and social characteristics of about 140,000 unique participants after age 50 years, from 28 European countries and Israel [ 19 ]. The SHARE study contains health, lifestyle, and socioeconomic data at individual and household level. These data have been collected over several waves since 2004, using questionnaires and conducting a limited number of performance evaluations. The baseline and the longitudinal questionnaires differ in some aspects, and some questions were modified during the course of the study; in wave 3 and partly in wave 7 a different questionnaire (retrospective SHARELIFE) was used to collect retrospective information about participants. Leveraging these data for research purposes can be daunting due to the complex structure of the longitudinal design with refresher samples organized in 25 modules with about 1000 questions. Functions written in the R language [ 23 ] are available that facilitate data extraction and data preparation of SHARE data [ 17 ].
We provide an explanation and elaboration of an IDA checklist for data screening using SHARE data collected during the first seven waves 2004 to 2017 in Denmark, which based the selection of participants on simple random sampling.
4.2 Study aims and corresponding analysis strategy
The research question aims at assessing the age-associated decline of hand grip strength by sex, after adjusting for a set of explanatory variables that are known to be associated with the outcome (weight, height, education level, physical activity and smoking). Here we give a basic overview of the corresponding statistical analysis strategy.
The study population are individuals from Denmark aged 50 or older at first interview. The outcome is maximum grip strength measured at different interviews (recorded with a hand-held dynamometer, assessed as the maximum score out of two measurements per hand). The time metric is the age at interview. The time-fixed variables evaluated at first interview are sex, height and education (categorized in three levels); the time-varying variables are weight, physical activity (vigorous or low intensity, both dichotomized) and smoking status. Interaction terms between age and all the time-fixed variables (sex, education, height) will be included in the pre-specified statistical analysis models to evaluate the association between these time-fixed variables with the trajectory of the outcome; the main interest is in the interpretation of the interaction terms between sex and functions of age on the grip strength. Nonlinear functional forms for continuous variables will be assessed using linear, quadratic, and cubic polynomials.
A linear mixed model [ 24 ] is planned to be used to address the research question. The trajectory over time of the outcome is explained at the population level using fixed effects and individual-specific deviations from the population trajectory are captured using random effects to account for the intra-individual serial correlation. The model accommodates individual-specific times of outcome measurements.
The linear mixed model, estimated by maximum likelihood, is robust to missing at random outcome data, that is when the missingness can be predicted by the observations (outcome and explanatory). Missing data at variable/item level (for the time-fixed explanatory variables) can be handled either by considering complete cases or by performing multiple imputation. We will use data from the SHARE study that are publicly available upon registration for use for research purposes ( http://www.share-project.org/data-access.html ). All analyses will be carried out using R statistical language [ 23 ].
4.3 IDA plan
The detailed IDA data screening plan for this study includes most of the points included in our checklist, describing the specific explorations that should be addressed and their aim ( S1 File ).
Structural variables in the context of IDA are: sex and grouped age (because of their known association with the outcome), wave and type of interview (baseline vs. longitudinal) (because of differences in data collection process).
4.4 Results of IDA
Here we present the main IDA findings for each domain; the consequences are discussed in the next section.
4.4.1 Participation profile.
The interviews were carried out between April 2004 and October 2017, in seven waves ( Fig 1 ). The median time between interviews in successive waves was about 2 years, the longest times passed between wave 1 and 2 (median: 2.5 years, see the online IDA report for more details).
https://doi.org/10.1371/journal.pone.0295726.g001
Overall, 5452 unique participants were interviewed 18632 times during the study. The number of participants who attended the interview in each wave, stratified by baseline wave are shown in Fig 2 , which highlights that new participants (refreshment samples) were included during the study and that wave 5 had the most interviews. The exploration of the age at inclusion shows that full range refreshment samples were used in wave 2 and 5, and refreshment samples only of the younger people in wave 4 and 6 ( Fig 3 ), as described in the study protocol.
https://doi.org/10.1371/journal.pone.0295726.g002
The median and modal number of interviews per participant was 3, 18% were interviewed only once, only 22% were interviewed 6 or 7 times ( Table 2 ); further aspects about drop-out are discussed in the missing value domain.
https://doi.org/10.1371/journal.pone.0295726.t002
Age is the time metric of interest in the analysis described in the analysis strategy, therefore its distribution is described in the participation profile. In later waves the participants were on average older (for example, the median age increased from 62 to 66 from wave 1 to wave 7), but the age distribution in the sample and in the target population was similar. Fig 3 shows the distribution of age over waves, overall and by type of interview.
Note that SHARELIFE interviews were conducted in waves 3 (all participants) and 7 (60% of the participants).
https://doi.org/10.1371/journal.pone.0295726.g003
The participation profile highlighted the complexity of the study design and the fact that most participants were measured few times; it also provided information about the distribution of age, which is the continuous time of interest and for which we did not identify any specific problems.
4.4.2 Missing data.
The characteristics of non-enrolled subjects could be studied only through the comparison of the observed samples with some known characteristics of the target population (sex, age and education composition, data were available from the statistical office of the European Union—Eurostat https://commission.europa.eu/index_en , from year 2007, wave 2 of the study). The aim of this comparison is to evaluate if the sample differs from the target population.
The responders that participated in the survey at least once had substantially higher education compared to the population in the same age and sex groups; males in the younger age groups were slightly underrepresented, as were older females ( Fig 4 for the distribution of education for data from wave 2, the complete results are similar for the other waves and presented in the online IDA report).
The analyses were limited to the ages between 50 and 85, as population data on education were unavailable for older inhabitants; the sample displayed from wave 2 is a random sample used in this wave as refreshment sample; details are given in the online IDA report.
https://doi.org/10.1371/journal.pone.0295726.g004
Many participants that entered the study had missing data during the longitudinal follow-up. The deaths were reported with high quality and timely, as only 1% of the participants had unknown vital status at the end of the study and overall, 978 deaths were reported by wave 7.
In Fig 5 participants were classified in seven categories based on their participation at each measurement occasion. The figure highlights that some participants had intermittent missingness, missingness by design because participants were not eligible (out-of-household) was very rare, while administrative censoring was common due to the study design (for example, many new participants were included in wave 5 and the follow-up ended in wave 7), and so were deaths and losses to follow-up (missing and out-of-sample).
Interview: participant participated with a valid interview; intermittent missingness: missing at measurement occasion but with valid interview later; missing: missing at measurement occasion and no interview later; out-of-sample: was removed from the sample because lost to follow-up (by study definition after at least three missing interviews, here the definition was applied retrospectively); out-of-household: not interviewed because not member of the household; death: died at measurement occasion or earlier; administrative censoring: did not have interview because the study ended.
https://doi.org/10.1371/journal.pone.0295726.g005
For the analysis purposes, the participants of some of the groups described in Fig 5 would be classified as lost to follow-up (out-of-sample, missingness, out-of-household if not re-included in the sample later); using this definition, we estimated the probability of loss to follow-up, death and death after follow-up. Estimate of cumulative incidence functions (using Aalen-Johansen estimators for loss to follow-up and deaths) indicated that the probability of loss to follow-up was virtually the same across age groups and sex. In contrast, the probability of death prior and post loss to follow-up substantially increased with age, as expected, and tended to be higher for males at younger ages ( Fig 6 ). Additional analyses showed that participants that died differed from the others also because they were more frequently smokers, had lower education and engaged in less physical activity, and had considerably lower levels of grip strength at baseline measurement (online IDA report); compared to complete responders, those that dropped out of the study for reasons different than death, had lower education, had less physically activity and smoked more frequently (online IDA report).
The first two incidence functions are obtained using the Aalen-Johansen estimator, the third is based on the Kaplan-Maier estimator. Aalen-Johansen estimators, stratified by sex and age group at first interview, obtained using the survival R package.
https://doi.org/10.1371/journal.pone.0295726.g006
The mean outcome profiles of participants that died during follow-up were lower compared to those that survived, especially among older males ( Fig 7 , left panel), while the difference in outcome between complete and incomplete cases due to loss to follow-up was smaller ( Fig 7 , right panel).
Participants classified in the groups still in the cohort had complete measurements for 7 waves.
https://doi.org/10.1371/journal.pone.0295726.g007
We explored the amount of missing outcomes among the interviews that were conducted (item missingness in the outcome) to evaluate the frequency of outcome missingness with valid interview, and its association with the characteristics of the participants. The amount of this type of outcome missingness varied from 2.2 to 6.5% across measurement occasions, females had more missing values than males and the proportion of missingness increased with longer follow-up ( Table 4 ) and with age ( Table 3 ). Participants with missing outcome data were unable to perform the grip strength test in 36% of cases, indicating that missing values might be related to bad physical conditions; 21% refused to take the measurement, 2% had a proxy interview, while the reason for missingness was unknown for the others.
https://doi.org/10.1371/journal.pone.0295726.t003
PA: physical activity. Here we show only the first interview data for variables used as time-fixed in the model (height, education and smoking—following the change suggested by IDA) and remove the observations missing by design.
https://doi.org/10.1371/journal.pone.0295726.t004
There was no clear association between missingness in different measurement occasions in the outcome, and a relatively small proportion of subjects had outcome missingness in more than one occasion, when the interview was performed ( Fig 8 ).
The number on the bars indicate the number of participants that have certain variables missing together (the missing variables are indicated using dots on the horizontal axis, M1_NA indicates that the variable is missing at first measurement occasion, etc.).
https://doi.org/10.1371/journal.pone.0295726.g008
In this case study, item missingness of the explanatory variables is considered separately from unit missingness, as the analysis strategy considers using multiple imputations to handle item missingness of the explanatory variables, or complete case analysis if the amount of missing values is relatively small.
Some of the time-varying explanatory variables were missing by design (weight in wave 3 and physical activity variables in SHARELIFE interviews, current smoking in longitudinal interviews in waves 6 and 7), as highlighted by Fig 9 . The analyst might thus decide to consider smoking status at baseline rather than current smoking in the statistical analysis. Item missingness was very low for all variables when missing by design missingness was not considered ( Table 4 ).
By design new participants were not included in wave 3 or 7, SHARELIFE interviews were conducted in wave 3 (all participants) and in partly in wave 7 (only for participants that did not have a SHARELIFE interview in wave 3, about 60%). n is the sample size.
https://doi.org/10.1371/journal.pone.0295726.g009
4.4.3 Univariate descriptions.
The characteristics of the participants at baseline interview are summarized in Table 5 (overall and by sex, discussed in the multivariate descriptions). The summary statistics did not indicate specific problems (unexpected location or variability values for numerical variables, sparse categories for categorical variables).
Md (Q1, Q3) represent the median, lower quartile and the upper quartile for continuous variables. Numbers after percentages are frequencies.
https://doi.org/10.1371/journal.pone.0295726.t005
The variables weight, height, and grip strength were reported with terminal digit preference (values ending with 0 and 5 were more frequent than expected). Fig 10 shows the distribution of grip strength and indicates that digit preferences did occur with examiners choosing more likely numbers ending with 0 or 5. This likely increases measurement error, and the IDA suggests that the impact on regression analyses would be worth exploring. The bimodality of the distribution is due to the inclusion of males and females, as shown in multivariate descriptions.
https://doi.org/10.1371/journal.pone.0295726.g010
4.4.4 Multivariate descriptions.
Sex is a structural variable in our case study, therefore the distributions of all the explanatory variables, stratified by sex, are explored in the multivariate descriptions. Females and males differed substantially in the distribution of height, weight, vigorous (but not low-intensity) physical activity, and education, while the distribution of age and the proportion of current smokers was similar ( S2 File and online IDA report).
The bimodal distribution of grip strength was explained by the large average differences between males and females and the histogram of age indicated that a Gaussian distribution assumption at each wave is appropriate when separated by sex ( Fig 11 ).
https://doi.org/10.1371/journal.pone.0295726.g011
As expected, at baseline the couples of variables with highest positive correlation were weight and height, and the two variables measuring physical activity ( Table 6 for overall correlations and Fig 12 stratifying by sex).
https://doi.org/10.1371/journal.pone.0295726.g012
https://doi.org/10.1371/journal.pone.0295726.t006
Age was negatively correlated with all the explanatory variables, the negative association between age and education among females was the highest, which can be explained by the study design, where there is a strong association between age and birth year. The SHARE study encompasses multiple age cohorts, followed in different calendar periods, as summarized in S2 File and as expected due to the design of the cohort.
4.4.5 Longitudinal aspects.
To visualize individuals’ grip strength trajectories we used profile plots; interactive plots are also available (online IDA report). The profiles based on subgroups of participants facilitate the visualizations of individual trajectories ( Fig 13 and S2 File show 100 random participants per group of initial grip strength quantile), which are not visible using complete data when the number of participants is large ( Fig 14 and S2 File show the profiles for all data). Even though age was included as a continuous time metric in the analysis strategy, a summary stratified by ten-year groups can serve as a quick overview of the longitudinal trends by age. The graphs that use age as a time metric give an idea of the shape of trajectory for model specification (which has to be determined a priori), those based on measurement occasion give a clearer overview of the individual trajectories, as participants enter the study at different ages.
https://doi.org/10.1371/journal.pone.0295726.g013
https://doi.org/10.1371/journal.pone.0295726.g014
The profile plots highlight the trend towards the diminishing grip strength with age and show that the rate of change seems to accelerate over age (the slope at later ages is bigger than at the beginning). Older participants are followed up for shorter times, substantial increases or decreases in grip strength between measurement occasions can also be observed. The variability of the outcome tended to decrease at later measurement occasions, especially in the older age groups.
The scatterplots of the outcome measurements across waves and their correlations are shown using a generalized pairs plot ( Fig 11 ); across waves there were no substantial differences in the correlations (slightly lower in wave 1) or variability of the outcome ( Table 6 ).
The correlation of grip strength between measurements taken at different ages, indicated that the serial correlation was very high, generally above 0.70 for two-year periods and reduced slightly with the distance; correlations were generally slightly larger for males than for females ( Fig 15 ).
Only estimates based on more than 20 observations are shown; the correlation between each pair of variables is computed using all complete pairs of observations on those variables.
https://doi.org/10.1371/journal.pone.0295726.g015
Fig 16 shows the smoothed estimated association between age and outcome for females, stratifying the data for grouped year of birth cohorts, and compares them to the estimates obtained using all longitudinal data, or cross-sectional data from only the first interview. Heterogeneity in the association between age and the outcome across year of birth cohorts were observed also for males, or considering different waves, and similar year of birth cohort effects could be observed for weight or height (online IDA report). These summaries should not be overintepreted, as they are not robust to missing data and assume independence between repeated measurements, but they suggest once again the potential importance of taking into account the year of birth cohort effect in the modelling, which can be addressed more formally during the modelling of the data.
Black lines are the estimates using all longitudinal data (dashed line) and cross-sectional data from the first interview (solid line).
https://doi.org/10.1371/journal.pone.0295726.g016
Finally, the longitudinal changes of vigorous physical activity at least once a week is examined graphically, using a Sankey diagram ( Fig 17 ). The graph highlights that the transitions between active/not active state are common and that missing data are common (missing by design and losses to follow-up). These explorations are useful for providing domain experts a description of some of the characteristics of the sample that can be compared to the expected characteristics.
https://doi.org/10.1371/journal.pone.0295726.g017
4.5 Examples of potential consequences of data screening
Table 7 lists examples of how results from the IDA data screening could lead to new considerations for the data analyses.
https://doi.org/10.1371/journal.pone.0295726.t007
5 Discussion
IDA is crucial to ensure reliable knowledge about data properties and necessary context so that appropriate statistical analyses can be conducted and pitfalls avoided [ 3 ]. Often it is not transparent in publications what initial analyses researchers conducted, and the reporting is poor. A multitude of decisions after examining data have an impact on results and conclusions [ 28 ].
This work builds on the IDA checklist for regression models with a continuous, count or binary outcome [ 13 ]. Addressing longitudinal cases requires additional considerations. This includes describing time metrics, assessing participation over time, conducting a thorough examination of missing data and patterns, and examining changes in time-varying variables. In the longitudinal setting IDA explorations can quickly become overwhelming even with a small number of variables. To manage this, we provide guidance with explanations and elaborations of the items that should be explored prior to undertaking the analysis detailed in the analysis strategy or in the statistical analysis plan (SAP).
An aim of IDA is to examine data properties that support the use of statistical methods, and IDA findings may provide insights for interpretation and presentation of model results. For example, when using mixed models to analyze longitudinal data, many different options exist for using random effects across different time functions and/or addressing autocorrelation. Within a parametric model, IDA findings might suggest suitable bases for time functions. Changes to the statistical models may relate to the selection and modeling of explanatory variables, strategies for handing informative drop-outs, or adjustments for variables associated to drop-out and/or selection. One outcome of IDA could be specifying sensitivity analyses (for example, modifying the functional form of an explanatory variable and evaluating the robustness of the results).
Reporting guidelines such as the STROBE checklist [ 29 ] include a limited number of IDA elements such as characteristics of study participants, number of missing participants, information about confounders, summary of follow-up time, and summary measures over time. However, our IDA recommendations are more comprehensive and provide suggestions of summaries and visualization to understand details about the data and possible implications for the analyses.
It is important to remember that an IDA workflow is not a standalone procedure but is closely linked to the study protocol and the analysis strategy or the SAP. Per ICH guidelines for good clinical practice [ 30 ], a SAP describes the variables and outcomes that will be collected and includes ‘detailed procedures for executing the statistical analysis of the primary and secondary variables and other data’.
Guidelines for SAPs in clinical trials [ 31 ] and in observational studies [ 32 ] mention time points at which the outcomes are measured, timing of lost to follow-up, missing data, description of baseline characteristics and outcomes. By describing choices for the statistical methods, the SAP identifies what data properties should be explored and then anticipates how these could be addressed in the statistical models. However, a carefully conducted IDA workflow as proposed here can improve the understanding of potential sources of bias. There may be unanticipated findings, or IDA could potentially reveal different ways of conducting the analyses. Adjustments to the analytic strategy in light of IDA discoveries are permissible, but they should be thoroughly documented and justified to ensure complete transparency [ 33 , 34 ]. For example, the recently proposed framework for the treatment and reporting of missing data in observational studies places a strong emphasis on pre-specifying how missing data will be handled, highlighting the need to assess the validity of the pre-planned methods once the data are available by examining the data [ 22 ]. Thus, a SAP needs to include both an IDA plan and details of the analysis strategy for transparency and reproducibility and to avoid ad-hoc decisions.
A worked example with available data and reproducible R code including many effective data visualizations is provided to help data analysts with performing IDA data screening for longitudinal studies.
To summarize, we provide recommendations for a check list for IDA data screening in longitudinal studies. This includes examples for data visualizations to enable researchers follow a systematic approach and reproducible strategies. IDA reports examine data properties to assure assumptions for statistical models are satisfied and aid in accurately interpreting model results. It can facilitate discussion among research teams about expectations of data properties and lead to a more thorough understanding about the potential for their study.
Supporting information
S1 file. ida plan for the application presented in the paper..
Detailed description of the IDA plan.
https://doi.org/10.1371/journal.pone.0295726.s001
S2 File. Additional tables and figures.
https://doi.org/10.1371/journal.pone.0295726.s002
Acknowledgments
This work was developed as part of the international initiative of Strengthening Analytical Thinking for Observational Studies (STRATOS). The objective of STRATOS is to provide accessible and accurate guidance in the design and analysis of observational studies ( http://stratos-initiative.org/ ). Members of the Topic Group Initial Data Analysis of the STRATOS Initiative are Mark Baillie (Switzerland), Marianne Huebner (USA), Saskia le Cessie (Netherlands), Lara Lusa (Slovenia), Michael Schell (USA) and Carsten Oliver Schmidt (Germany).
- View Article
- Google Scholar
- PubMed/NCBI
- 4. Tukey JW. Explanatory Data Analysis. vol. 2. Reading, MA; 1977.
- 6. Cook D, Swayne DF. Interactive and Dynamic Graphics for Data Analysis: With R and Ggobi. New York, NY: Springer New York; 2007.
- 8. Wickham H, Çetinkaya-Rundel M, Grolemund G. R for data science. O’Reilly Media, Inc.; 2023.
- 13. Heinze G, Baillie M, Lusa L, Sauerbrei W, Schmidt C, Harrell F, et al. Regression without regrets—initial data analysis is an essential prerequisite to multivariable regression; PREPRINT (Version 1) available at Research Square https://doi.org/10.21203/rs.3.rs-3580334/v1 . November 14, 2023.
- 14. Verbeke G, Molenberghs G. Linear Mixed Models for Longitudinal Data. Springer—Verlag, New York; 2000.
- 15. Diggle P, Heagerty P, Liang KY, Zeger S. Analysis of Longitudinal Data. Oxford University Press; 2002.
- 16. Weiss RE. Modeling Longitudinal Data. Springer; 2005.
- 21. Little RJ, Rubin DB. Statistical Analysis with Missing Data. John Wiley & Sons; 2019.
- 23. R Core Team. R: A Language and Environment for Statistical Computing; 2021. Available from: https://www.R-project.org/ .
Clinical Trials Data Management and Analysis
Medical research is a process of gathering data that will expand scientists' understanding of human health. Researchers take steps to ensure the accuracy of all their data, then use sophisticated methods to analyze their findings to ensure the accuracy of their conclusions.
Table of Contents:
How Researchers Use Biostatistics to Analyze Data
How researchers protect data integrity during clinical trials, how researchers use real-world evidence in clinical studies, continuing data collection after clinical trials, learn more about clinical trials.
Putting together a medical research study is no simple task. Scientists must create a detailed study design that lays out every aspect of the research. This careful process allows the research team to have a clear plan for gathering and using all the data for their research.
Clinical trial data management is one of the biggest priorities in research. Scientists must ensure that study participants understand what the team is trying to learn and what information they will need in the process. Researchers must accurately record data and analyze it carefully to ensure their findings are correct. This requires multiple data management techniques.
Biostatistics is a branch of statistics that deals with data about living organisms. Statisticians analyze data related to humans, animals, and plants to identify patterns. These patterns can be used to assess important scientific information. Biostatistics can also be used to predict health risks in certain groups and give doctors an idea of how different health conditions progress under different circumstances.
In research, biostatistics and clinical data analysis are essential parts of study design and analysis at all phases. Researchers can also use biostatistics when designing a new study. Data from past studies can be used for modeling, pre-study simulations, and feasibility analysis. Preclinical modeling can be used during clinical trials to adapt the study design if needed. Once the study is complete, biostatistical analysis is a key component in writing reports about the study findings.
Good science requires good data and good clinical data management. Researchers need to ensure that the information they collect is correct and obtained appropriately. One key step in ensuring data integrity is getting informed consent from study participants. Participants must knowingly agree to all research activities, with sufficient understanding of the potential consequences. Data acquired without appropriate informed consent casts doubt on the study's overall validity.
Once researchers have proper informed consent , all data gathered in the study must be valid, complete, and well-documented. The goal of data gathering and storage is to ensure that the collected information can be used to reconstruct the study and confirm the findings.
Data protection is another aspect of data management. Researchers need to protect participant privacy . They need to have adequate security tools to make sure all data is protected and participants' identities are concealed .
Quality assurance is the process of checking data and data collection methods throughout the trial. This can be done by the research team or quality management experts at the facility where the research is taking place. Government regulators may also conduct audits to ensure all the methods and findings are appropriate and follow best practices.
Real-world evidence is data collected outside the parameters of a study. It can offer valuable insight into how certain behaviors, health conditions, or treatments affect people daily without the rules or oversight imposed by a clinical trial. Real-world data can also offer insights into how particular conditions or treatments affect people over different periods.
Researchers can collect real-world data from various sources, including electronic health records (EHRs), registries (e.g., cancer registries or veterans health condition registries), insurance data, patient-reported data like surveys, or data from mobile health applications and wearable devices.
Real-world evidence can help with designing new clinical trials. The data can be used as a biostatistic to model the potential outcomes of the trial. In some cases, real-world data can replace the placebo arm of a study. Researchers can administer the treatment to all participants and compare study outcomes to real-world data instead of monitoring a control group of participants who receive the placebo instead of treatment.
Data gathering and clinical data analysis continue after a successful study is completed and a new treatment has been approved. Clinical trials are one way of determining a treatment's effectiveness, but they cannot predict all the possible outcomes when people start using the treatment outside the study.
Both researchers and regulatory agencies collect information about how the treatment affects people. This allows researchers to understand the long-term effects of new treatments. It also ensures that regulators identify any unexpected safety issues and take steps to protect people from harm.
Post-market data gathering and management may involve patient reporting systems where people can send information about the adverse effects of treatments to the FDA . Researchers may arrange post-study follow-ups with participants to gather more information about their outcomes over the long term. Researchers may also use real-world data from insurance companies or healthcare systems to understand better how the treatment affects people. This post-market data is another set of biostatistics that can be used to assess current and future research.
Clinical trials and the medical advances they provide wouldn't be possible without the help of people who participate in clinical research. If you want to learn how you can be a part of medical research studies, connect with Studypages and sign up for our free Pulse Newsletter. Our platform helps you join real clinical studies and take part in the advancement of healthcare research.
The Reflective Practice Framework for Phenomenographic Data Analysis
- Open access
- Published: 31 May 2024
Cite this article
You have full access to this open access article

- Olga Rotar ORCID: orcid.org/0000-0001-7298-6444 1
In phenomenographic studies, the use of reflection is not commonly reported. Drawing on the different schools of thought and reported frameworks, this paper introduces the Reflective Practice Framework for phenomenographic data analysis. The article describes theoretical stances and constituent elements of the framework, which consist of the two levels and five steps of reflection. The application of the framework allows for a systemic account of situational factors and personal influences during the process of phenomenographic data analysis. The framework provides a clear-cut guideline for novice phenomenographers on how to maintain reflection when working on the analysis of unstructured phenomenographic data and considering assumptions, biases, and alternative perspectives.
Avoid common mistakes on your manuscript.
Introduction
Over the last two decades, researchers have shown considerable interest in reflective qualitative inquiry and practice (Crathern 2001 ; Cokely & Deplacido 2012 ; Call-Cummings and Ross 2019 ; Donohoe 2019 ; Foley 2002 ; Simpson and Courtney 2007 ). Reflective practice as a methodological tool emerged in feminist research and initially involved asking questions about power imbalances (Day 2012 ). The concept has expanded to include reflection on personal biases, subjectivity, and theoretical commitments. Articulating a researcher’s position through writing is another instance of the use of reflection within qualitative studies, allowing the author’s voice to be visible to the reader (Harding, 1989 ; Day 2012 ). Thus, over time, reflection has become associated with the researcher’s subjectivity, positionality and their influences on the research (Brown, 2019 ).
While reflection (a process of careful, considered, deep thinking) and reflexivity (a process of questioning one’s own thinking) are well-recognised concepts in many qualitative methodologies, their practical application remains relatively understudied (Donohoe 2019 ; Oxford English Dictionary). Call-Cummings and Ross ( 2019 ) argued that reflection and reflexivity are “issued as a call - an important step to take to establish the validity, rigour, or ethical nature of the research” (p. 4). However, there is little consensus on how reflection as a practice should be conducted. As Pillow ( 2003 ) put it, she remains “puzzled by how to teach students to be reflexive” (p. 171).
Reflection is an important tool in many qualitative methodologies, such as phenomenology, ethnography, narrative or feminist research. In phenomenography, however, the explicit use of reflection is less common, despite the highly iterative and interpretative nature of this approach to research. A peculiar feature of phenomenographic data analysis is that it deals with rich and unstructured data. Phenomenographers emphasise that there is no single algorithm to analyse such data, although general suggestions have been provided on how to uncover the meanings participants attribute to the phenomenon under investigation (Marton, 1986 ; Dahlgren and Fallsberg 1991 ). Participants’ perspectives must be carefully analysed, ensuring the preservation of the second-order perspective represented by individuals’ subjective experiences of reality (Marton 1981 ).
The argument of this paper centres around the premise that a holistic approach to reflection, considering situational factors and a researcher’s personal influences and biases, is paramount for ensuring quality research outcomes in phenomenographic inquiry. Yet, despite the potential of reflection to enhance phenomenographic data analysis, its value is somewhat neglected. To address this gap, the Reflective Practice Framework (RPF) was developed to provide a systemic approach that integrates personal and situational factors with a step-by-step guidance for reflection on phenomenographic data analysis. This systemic approach fosters and guides critical thinking, enabling phenomenographic researchers to navigate the complexities of data analysis.
The article is structured as follows: firstly, it provides a literature review of various perspectives on reflection within phenomenological research, and outlines frameworks and models for reflection used in other methodologies. Secondly, it introduces a theoretical framework, discussing different schools of thought on reflection and reflexivity. Thirdly, it describes the methodology used to develop the RPF. Following this are the Results and Discussion sections. Finally, the conclusion and limitations of the study are presented.
Literature Review
Reflection in phenomenological studies.
Reflection is an important tool in phenomenological studies. Husserl’s descriptive phenomenology ( 1965 ) emphasised the practice of reduction or bracketing, wherein researchers set aside personal assumptions and preconceptions regarding a phenomenon. Sanders ( 1982 ) also advocated a descriptive phenomenological approach, describing phenomenology as a technique which aims to “make explicit the implicit structure and meaning of human experiences” by elucidating the universal pure essences underlying human consciousness (p. 354). This is achieved through four levels of analysis: describing the phenomenon based on research participants’ experiences, identifying common themes, exploring individual perceptions of the phenomenon while retaining these themes, and finally, interpreting and abstracting the essences of individuals’ perceptions (Sanders 1982 ). A limitation of Sanders’ methodology is the lack of guidance on how to rigorously bracket assumptions and biases, especially during the process of abstracting the research participants’ interpretations. Heidegger ( 1988 ) challenged the idea of bracketing and emphasised the role of interpretation, influencing the development of “hermeneutic” or “interpretive” phenomenological inquiry.
In the field of education, Van Manen ( 1990 ) contributed to the further development of hermeneutic phenomenology, which combined the elements of the descriptive and interpretive approaches. Specifically, hermeneutic phenomenology adopts a descriptive (phenomenological) approach aiming to observe how things manifest themselves. Additionally, it employs an interpretive (hermeneutic) method, asserting that all phenomena are inherently interpreted experiences (Van Manen 1990 ). Like Heidegger, Van Manen ( 1990 ) advocated against bracketing and stressed the importance of documenting the process of thinking through multiple writing sessions to practise consideration and thoughtfulness.
Further, Smith and his colleagues played a role in advancing interpretative phenomenological analysis (IPA) (Smith & Osborne, 2008 ; Smith et al. 2009 ). Smith and Osborne ( 2008 ) offered a framework to assist researchers in their interpretation of their study participants’ accounts of a particular experience or phenomenon - the approach referred to as double hermeneutic. IPA framework offers flexible guidelines to make lucid the interpretation of individuals’ accounts of their social and individual environments and the importance they attach to specific experiences or events (Smith and Osborn 2003 ).
To summarise, phenomenological research provides insights into the need for intentional and thoughtful reflection, recognising the inherent interconnectedness between individuals and how they experience the world. However, conventional reflective methods, such as bracketing, have faced criticism (Heidegger, 1988 ; Van Manen 1990 ). Furthermore, representatives of both descriptive and IPA approaches lack sufficient methodological guidance compatible with phenomenographic methodology. These limitations highlight the need for exploring more suitable tools and models for reflection that can be adopted to phenomenographic data analysis.
Frameworks for Reflection
In this section, I discuss practical tools and models for reflection within various research methodologies that have been reported in the literature (see Table 1 ).
A model developed by Van Manen ( 1977 ), based on the work of Habermas, has a hierarchical structure with three levels of reflection. At the first level of technical reflection, the effectiveness and efficiency of achieving set goals are considered, e.g., reflection upon the competencies and means required to realise research goals. At the second level, means identified for achieving research goals, their adequacy and rationale are examined against these goals and anticipated outcomes. Finally, at the third level, critical reflection, ethical and moral considerations to address individual biases are incorporated. A model of reflection by Valli ( 1997 ) contains elements of Schon’s ( 1983 ) and Van Manen’s ( 1977 ) frameworks. Valli proposed five levels of reflection. First, technical reflection requires an individual to match competencies with professional standards and external goals, and continuously improve professional performance concerning these predetermined benchmarks. At the second level, an individual must engage in ongoing reflection during and after an activity to ensure continuous internal discussion and reconsideration of emerging issues. The third level requires an active search for alternative viewpoints on the identified issues. At the fourth level, personalistic reflection, an individual develops awareness of the impact of emotions, intuition, past knowledge, and experience on cognitive processes. Finally, critical reflection focuses on the ethical, moral, social, and political aspects. It aims to ensure an open-minded and rational judgement and the creativity of an individual when arriving at a particular conclusion. Although showing significant overlap with the reflective frameworks and models discussed earlier, Valli’s ( 1997 ) model is unique because it recognises the impact of emotions and personal characteristics and background on cognitive and metacognitive processes. Furthermore, although the frameworks of Van Manen ( 1977 ) and Valli ( 1997 ) have been criticised as hierarchies (Hatton and Smith 1995 ), they are certainly helpful in that they incorporate multiple aspects of reflective practice.
Gore and Zeichner ( 1991 ) offered a model that distinguishes four kinds of reflection, namely academic reflection, social efficacy reflection, developmental reflection, and social reconstructionist reflection. Sellars ( 2017 ) elaborated on Gore and Zeichner’s ( 1991 ) framework by providing a set of questions to engage in more considered reflection within all four dimensions, arguing that for educators, to develop a deep understanding of classroom interactions, questioning and reflecting on all four domains of their practice in crucial.
In the study reported by Fook ( 2015 ), participants were encouraged to reflect on their practice in a confidential setting. Each participant is asked to present a piece of work that was important to them in some way, whilst being encouraged to reflect on this work by an experienced facilitator. Fook’s ( 2015 ) model has two stages, an analytical stage with the exposure to and examination of the hidden assumptions, and a guided transformation of the identified assumptions into new ways of understanding practice. Another tool for guided reflection was suggested by Körkkö ( 2019 ). In her phenomenographic study, participants used a video app as a tool to follow a five-stage reflection procedure: the creation of an individual tag set based on personal learning aims; an authentic lesson observation and feedback (optional); a selection of a lesson for video recording; a supervisory conversation; and a written reflection. Körkkö’s ( 2019 ) framework embraces ideas of the social constructivism and situatedness of learning, emphasising the interrelationships of personal and social environments which construct and shape learning. Similarly to Sellars, Fook ( 2015 ) and Körkkö ( 2019 ) placed an emphasis on the role of questions in engaging with reflection.
Building on the earlier work, Korthagen ( 2017 ) reported a model with five layers that can be used to facilitate reflection, arguing that to achieve “a deeper meaning in a teaching situation, one has to include the more inner levels” (Korthagen, 2004 , p. 395). Finally, Soedirgo and Glas ( 2020 ) suggested a framework for active reflection. The first step is the documentation of the process of reflection at all stages, including the design of the research project. Documentation of reflection allows the articulation of a researcher’s voice and a consideration of potential power disbalances between actors involved in the research process. Furthermore, early documentation creates a foundation for benchmarking how thinking evolves at later stages. The second step involves systematising reflective thoughts into a summary of individual positionality. At the third step, the researcher addresses the limitations of subjective reflexivity and seeks to include others in that process. For instance, a researcher can discuss self-positionality and individual assumptions with colleagues or seek feedback from a broader audience. The fourth step advocates sharing the thought process in writing. This step ensures transparency about how a researcher arrived at a particular conclusion, making it possible to evaluate the quality of data and its interpretation.
Although it’s acknowledged that reflection is a personal practice that can vary among individuals, the models and frameworks discussed above provide valuable insights into reflection and reflexivity as both concepts and a practice. However, there is a notable absence of empirical studies integrating reflection with phenomenographic research design (see exception by Körkkö 2019 ). Yet, reflection is an important tool for ensuring the rigour and reliability of phenomenographic data analysis, as it provides an opportunity to demystify what is going on in the “black box” of this process.
Theoretical Framework
This study falls within the broader research area of reflective methodology, which emphasises the importance of reflective thinking as advocated by prominent scholars like Dewey, Kolb, Archer, Schon, Alvesson and Sköldberg, and others. In this section, I discuss reflection and reflective practice from the perspective of these scholars aiming to develop a more nuanced understanding of the theoretical foundations of critical reflection.
Dewey: Reflection
Dewey ( 1910 ) described reflection as the
active, persistent, and careful consideration of any belief or supposed form of knowledge in the light of the grounds that support it, and the further considerations to which it tends (p. 6).
According to Dewey ( 1910 ), reflective thought is only possible when the ground of a suggested interpretation is intentionally sought, and the sufficiency of its evidence is critically considered. He argued that the process of reflection is a consequence, rather than just a sequence, of ideas that are ordered in a way that the previous idea supports and justifies the next one. The origin of reflective thinking, according to Dewey, is the confusion that occurs when available data cannot provide a definitive explanation of a phenomenon or a problem. When an individual faces such confusion, the most apparent interpretation known to the individual is the one rooted in one’s experience and knowledge. Such a tendency to accept the most apparent explanation is due to the mental uneasiness associated with thinking. However, accepting the initial interpretation without questioning represents uncritical thinking with minimum reflection, whereas reflective thinking represents a judgement that has been suspended until further inquiry. In other words, reflective thinking always requires more effort and is more painful due to the need to overcome thinking inertia and endure a condition of mental unrest and discomfort.
In his later work, Dewey also emphasised the importance to consider the context of a situation, arguing that “we live and act in connection with the existing environment, not in connection with isolated objects” ( 1939 , p. 68). The meaning of isolated facts can be easily misconstrued and corrupted, leading to biased, incomplete, or irrelevant results (Dewey 1939 ; p. 70). Thus, the “sensitivity to the quality of a situation as a whole” is of highest importance to allow for the controlled “selection and the weighing of observed facts and their conceptual ordering” (Dewey 1939 ; p. 71).
Schon: Reflective Practice
Despite the importance of his work, Dewey has been criticised for conceptualising reflection as a process of thinking rather than action. To address this issue, Schon ( 1983 , 1987 ) developed and adapted Dewey’s ideas to the practice of reflection. Reflective practice proposed by Schon ( 1983 , 1987 ) aimed to reduce the gap between theory and professional practice. Schon argued that reflection is not necessarily an activity that happens after the event. Instead, it represents a way of approaching an understanding of one’s life and actions.
The two dimensions of reflection suggested by Schon ( 1983 , 1987 ) are reflection-in-action and reflection-on-action. Although based on Dewey’s ( 1910 , 1933 ) work, Schon emphasised the importance of acknowledging that professional knowledge involves knowing both organisational rules and exercising creativity. The rules and actual professional practice differ from each other. By aiming to close the gap between these two areas, reflection-in-action and reflection-on-action provide instruments to translate theory into concrete professional practice.
Although having theoretical and practical value, Schon’s theory is not clear about the criteria for determining reflection. This lack of clarity suggests that as far as there is a reflection on something, then reflection is present (Gore and Zeichner 1991 ).
Kolb: A Personalised Model of Reflection
Kolb’s ( 1984 ) Experiential Learning Cycle, which consists of four stages, offers a framework that incorporates a reflection on an individual’s experience that is then reviewed and evaluated. The first stage, concrete experience, involves acknowledgement and a description of the initial experience, the context of that experience and an individual’s response to it. The next stage, reflective observation, involves a deeper reflection of the situation or a phenomenon that has been experienced, to evaluate the initial response and underlying reasons for such a response. Abstract conceptualisation, the third stage, involves reflecting on what could have been done better or differently, seeking alternative approaches and strategies for similar situations in the future. This stage also includes consulting colleagues and literature to enhance understanding and generate new ideas. The last stage, active experimentation, entails putting newly acquired theoretical knowledge into practice, testing out reflections and improvements, and implementing new strategies. Such an approach to reflection ensures that initial interpretation of experience and its response are carefully considered, to form a basis for the next round of reflection. Kolb’s model reinforces the idea of reflection as a cyclic process where the initial interpretation of experience and an individual response to it are revised in a conscious way. The adaptation of the elements of the model can support phenomenographic data analysis, as it acknowledges reflective practice as a metacognitive process that involves emotional responses and offers practical guidance that promotes an internal discussion and consideration of an individual’s values, beliefs, and context- specific understanding of reality.
Archer: Reflexivity
Like Kolb, Archer extensively focuses on reflection in action. While for Dewey ( 1910 ) the importance of reflection was in its power to address a problem of misunderstanding or a mistake, Archer ( 2007 ) conceptualises reflexivity as a mediator, an “unknown soldier of social life”, that can influence social action and social outcomes (p. 52). For Archer, reflexivity is represented by the “inner speech”, an “individual reflection”, which is contrasted with external speech (Archer 2007 ; p. 63). In other words, reflexive thought takes place through internal conversation.
By questioning and answering questions, we are holding an internal conversation with ourselves and inter alia about ourselves. This is the nature of reflective thought (Archer 2007 ; p. 73).
Archer advocated a reflexive inner dialogue and supported the statement that without “an effective inner voice, it is very difficult to initiate ideas, develop thought, be creative, and respond intelligently to discourse, plan, control our feelings, solve problems, or develop self-esteem” (Archer 2007 ; p. 64). Therefore, reflection is a way of researching personal practice or experience to better understand ourselves as knowers and makers of knowledge. Understanding how social contexts and dominant discourses influence ideas, beliefs, and assumptions helps individuals to make specific connections within and between themselves and broader social and cultural environments.
Alvesson and Sköldberg: Reflective Methodology
Alvesson and Sköldberg ( 2000 ), proponents of reflexive methodology, argued that “data and facts […] are the constructions or results of interpretation”, and that a researcher’s interpretation of them needs to be controlled (p.1). Similarly, Steedman ( 1991 ) emphasised that the knower and the produced knowledge cannot be separated. The excessive focus on procedures and techniques to ensure rigour that are common in quantitative research “draws attention away from fundamental problems associated with such things as the role of language, interpretation and selectivity” (Alvesson & Sköldberg, 2000 , p. 2). As Alvesson and Sköldberg emphasised, researchers should avoid a trap of assuming that quantitative results are more rigorous and robust than those produced in a qualitative inquiry, as qualitative materials can provide rich information and valuable insights about reality (Alvesson & Sköldberg, 2000 ).
Alvesson and Sköldberg ( 2000 ) explain that the reflexive approach to research starts with scepticism towards “unproblematic replicas of the way reality functions”, which consequently “opens up […] opportunities for understanding rather than establishing “truths” (Alvesson &Sköldberg, 2000 , p. 5). The authors distinguish two elements of reflective inquiry, namely “careful interpretation and reflection” (Alvesson & Sköldberg, 2000 , p. 5). The first element puts interpretation to the fore of the research process, emphasising that empirical data (e.g., observations, interviews, measurements), as well as secondary data (e.g., statistics, archival data), are subjects of interpretation. Reflection, in turn, provides an opportunity to systematically consider the influence of “the researcher, the relevant research community, society as a whole, intellectual and cultural traditions, […].language and narrative” on the interpretation and the research processes (Alvesson & Sköldberg, 2000 , p. 6). Alvesson and Sköldberg ( 2000 ) draw attention that during such reflective inquiry “the centre of gravity is shifted from the handling of empirical material towards […] a consideration of the perceptual, cognitive, theoretical, linguistic, (inter)textual, political and cultural circumstances that form the backdrop to the interpretations” (Alvesson & Sköldberg, 2000 , p. 6).
Methodology
Approach to analysis.
The overarching question in this study is “What framework might be developed from the literature on reflection to guide the reflection process during the phenomenographic data analysis?” To address this question, a comprehensive methodology was required. A search for relevant examples in the Scopus database using terms such as “phenomenography”, “phenomenographic”, “reflection”, “reflective practice”, and “reflexivity” over the last 20 years revealed few studies discussing tools or frameworks for reflection, with some reporting the use of reflection ex post facto (Gustafsson et al. 2009 ; Korhonen et al. 2017 ; Körkkö et al. 2019 ). To explore the variety of methods and ideas on reflection, I turned to theoretical research and empirical studies that documented its application in practice. A consideration of the literature was also helpful in understanding different schools of thought and approaches to reflection within various methodologies. Practical examples of reflection served as a starting point for the development of the RPF, with the methodology for its development presented in Table 2 .
Reflective thinking originates from confusion (Dewey 1910 ).
A proposed solution or interpretation of the data needs to be continuously examined against the empirical data.
Reasoning should involve searching for the evidence within the broader context of data to support the initially proposed interpretation. Locating the interpreted pieces of data within the broader data pool is crucial to avoid misconstrued interpretations (Dewey 1939 ).
Documenting the reasoning process is crucial for ensuring that the proposed interpretation is carefully considered, with a close attention to the available evidence found in data.
A decision to accept or reject a proposed interpretation is evaluated against the evidence of how 1) it is grounded in the data and 2) its fit to the broader context.
In addition, prior research advocates the formulation of a written positionality statement, to disclose personal standpoint, beliefs, values, assumptions, and accepted paradigms, as well as document how they are evolving throughout the research process (D’Arcangelis 2018 ; Soedirgo and Glas 2020 ). By engaging in this cyclic reflection, a phenomenographer overcomes thinking inertia by proposing a number of alternative interpretations of the data, and evaluating each interpretation against the evidence found in data. In doing so, a researcher suspends initial unreflective interpretation of the data, maintaining the analysis in a controlled, considered and transparent way.
The following principles reflect the cyclic nature of reflective practice of the proposed framework, as visualised in Fig. 1 .

(Source: Rotar 2023 )
Elements of the reflective practice framework.
The application of RPF was tested in the author’s publications (see Rotar 2021 ; Rotar 2022 ; Rotar 2023 ).
A Systemic Approach to Reflection
There is no single algorithm to analyse phenomenographic data as this process is “iterative and genuinely interpretive in nature” (Marton, 1986 , p. 282). Bowden and Walsh ( 2000 ) suggested that the categories of description that derive from the data are not discovered but rather constructed by a researcher. Marton ( 1986 ) proposed four steps of the analysis of phenomenographic data, although those are very general. The model suggested by Dahlgren and Fallsberg ( 1991 ) contains seven steps and provides more explicit guidance than that offered by Marton. However, it does not offer a scaffolding to maintain the transparency of the analytical process. Considering these limitations, I advanced Dahlgren and Fallsberg’s ( 1991 ) analytical model by adding an additional step (see Appendix 1 ) and propose supporting the analysis with reflective practice using the RPF to increase transparency and maintain the rigour of phenomenographic data analysis.
Ison ( 2018 ) stated that “systems practice comprises systemic and systematic practice understood as a duality” (p. 5). The RPF offers dual guidelines that include step-by-step reflection on the data analysis and a reflection on personal and situational factors, making this process holistic. It initiates and guides critical thinking to understand the complexities of a researcher’s engagement with the data. It also allows us to scrutinise the contributors to the knowledge production, as well as to understand their contexts, as “all practice is situated” and is “the product of an evolutionary, biological, cultural, family and intellectual/social history” (Ison 2018 ; p. 5). Consideration of systemic factors mentioned above through reflective, relational thinking is critical for uncovering hidden interests and to be open to alternative perspectives (Ison 2018 ). This is what an application of RPF can assist with.
This section describes the constituent parts of the PRF: the positionality statement (level one) and five steps of reflection (level two), namely confusion, the proposition of a solution, reasoning, recording and either verification or rejection of the proposed solution (see Fig. 1 ). The framework helps to make the personal perspectives of the researcher which are embedded in the thinking and decision-making processes transparent, reasoned, and based on facts. In addition, it allows ethical considerations and inclusion of professional values and is open to the discussion of alternative perspectives. In other words, the five elements of the framework serve as tools for considered and ongoing reflection during the eight steps of phenomenographic data analysis (see Appendix 1 ). The application of the RPF to the data analysis is shown in Table 3 , and explained in detail in the following part of the paper.
Level One: Developing a Positionality Statement
Harding ( 1989 ) argued that understanding a researcher’s position is critical in qualitative inquiry as it makes the voice of the research visible and confident. Commitment to reflexivity provides an opportunity to assess qualitative research with a consideration of a researcher’s position (MacLean et al. 2019 ; Soedirgo and Glas 2020 ). To make use of this opportunity, D’Arcangelis ( 2018 ) and Soedirgo and Glas ( 2020 ) advocate the disclosure of self-positionality. The development of positionality statements allows for what Archer ( 2007 ) calls internal conversation, where self-questioning is conducted in a conscious manner. In a phenomenographic study, articulating individual positionality is particularly important. When analysing data, a phenomenographer interprets a participant’s interpretation of the phenomenon, and thus, it is critical to distinguish the two voices explicitly. In the positionality statement, a researcher acknowledges that the interpretation of the phenomenographic data is mediated by a researcher’s beliefs, values, assumptions, and accepted paradigms. Another aim of the positionality statement is the gradual construction of a researcher’s position in relation to a research study. Habermas ( 1974 ) regarded this act as a self-determined action. Calderhead ( 1989 ) agrees with this perspective, noting that:
Reflection is viewed as a process of becoming aware of one’s context, of the influence of societal and ideological constraints on previously taken-for-granted practices and gaining control over the direction of these influences. (p. 44)
Developing a positionality statement continuously throughout the research process authentically engages a researcher in each aspect of reflection and allows the recognition and acknowledgement of the origins and impact of the researcher’s own belief systems, values, and prior knowledge and experience on the research process.
The identification of positionality is not a straightforward process. Even with reflection, there is a risk of “reflexive inclusion” of the self into the piece of research (Day 2012 ; p. 69), which comes from the idea that a researcher actively contributes to knowledge production. Thus, an analysis of the self rather than mere disclosure is an essential element of the reflexive technique. Self-analysis involves reflection on one’s theoretical perspectives and past methodological practices, and how those may influence the study. In addition, the researcher may clarify which of their identities is most significant for research outcomes, e.g., a woman, a parent, a student, an adult, or a multidimensional identity.
By continuously working on the positionality statement, a researcher is committed to acknowledging the evolution of his or her position, identity, authority, the dependence of research on participants’ accounts, and to thinking about the potential implication of all of these on the data analysis process.
Level Two: Five Steps of Reflection
Step 1. confusion.
As depicted in Fig. 1 , I propose that reflection on phenomenographic data analysis necessarily starts with a state of confusion. Confusion arises when a researcher encounters rich, unstructured phenomenographic data. When working with unstructured data, a researcher can only suggest how to organise the participants’ utterances and how to approach the interpretation of their accounts. At this stage, the risk of uncritical thinking is high. Since insights and suggestions that arise in a researcher’s mind are inevitably influenced by their prior experience and knowledge (Dewey 1910 ), he or she must not terminate the thinking process by accepting initially emerged interpretations of the data and explanation of their own patterns of thinking. Without suspending judgement, the immediate conclusion removes the possibility of reflective thinking and the exploration of the subjective influence of a researcher.
When dealing with unstructured phenomenographic data, experiencing difficulty or confusion is common. An essential part of the reflective thinking technique in phenomenographic inquiry is the cultivation of such uneasiness or confusion. This postpones the first suggestion of a solution until the nature of confusion has been thoroughly explored. Such practice, according to Dewey ( 1910 ), is an indicator of critical and reflective thinking.
Step 2. Proposition of the Solution
The next step of reflection—proposition of the solution—presumes a more intimate and extensive consideration of the interpretation proposed by a researcher and involves a careful examination of the empirical data. Working with unstructured phenomenographic data entails transitioning from what is present (raw data) to what is absent and can only be proposed (interpretation of the data) (Dewey 1910 ). Hence, the process of interpretation is somewhat speculative and exploratory.
The initially suggested interpretation constitutes an idea, proposition, guess, hypothesis, or theory (Dewey 1910 ). Once suspended, the postponement of an initial interpretation awaits further evidence. At this stage of reflection, a researcher is required to cultivate a variety of alternative interpretations. The final conclusion depends on the existence of evidence and the presence of rival conjectures of probable explanation in its favour. Cultivating a variety of alternative suggestions is a crucial factor in good reflective thinking, which is in line with the third level of reflection in Valli’s ( 1997 ) model that advocates an active seeking of alternative viewpoints in interpreting the situation.
Step 3. Reasoning
At the reasoning stage, accepting the interpretation in its initial form is prevented until alternative options are exhausted and evaluated with scrutiny (Alvesson & Sköldberg, 2000 ; Dewey 1910 ). Conjectures that seemed plausible at first glance could be found lacking grounding in data. Even when the reasoning does not lead to the rejection of the proposed interpretation, it refines the interpretation into a form that is more reflective of the study participants’ accounts of the phenomenon. Simultaneously, interpretations that initially seemed weak may gain more elaboration and transform during this stage of reflection. Dewey ( 1910 ) emphasised that the development of interpretation through reasoning helps to “supply the intervening or intermediate terms that link together into a consistent whole apparently discrepant extremes” (Dewey 1910 ; p. 76).
While interpretation is inferred from given data, reasoning begins with an interpretation. Reasoning has the same effect on a suggested interpretation as more extensive observation has on the original problem. By searching for evidence in data to support the proposed interpretation and by examining the context within which that evidence is found to better understand the interpretation, a researcher engages in the reasoning process and facilitates deeper reflection.
Step 4. Documenting or Recording
One of the most challenging tasks of qualitative research is to represent the truth in the findings and allow the voices of those involved in the study to be heard. This is especially true for phenomenographic research, which takes a second-order perspective. The documenting step within the RPF allows researchers to consolidate outcomes of reflective thought and ensure transparency and validity of analysis and interpretation. Just like emphasised by Van Manen ( 1990 ) who advocated written reflection as a tool for more in-depth interpretation, documentation of reflective process enables recording an evolution of a researcher’s positionality, articulating the researcher’s voice, reflecting on potential power relations between the researchers and participants, and, finally, recording and revising identified assumptions.
There is also another important reason for documenting reflection. According to Dewey, during internal conversations, individuals understand their own meanings and often use abbreviations and shortcuts in their inner dialogue. Through the documentation of reflection, implicit ideas and insights are made explicit and visible, and what was unconsciously assumed is exposed to examination, resulting in more critical and fruitful thinking.
Step 5. Verification or Rejection
The fifth step of the RPF is the verification (or rejection) of the proposed interpretation. At this step, conditions are deliberately arranged according to the requirements of the interpretation to see if the empirical evidence supports the results. When the proposed interpretation is firmly grounded in data, the confirmation is strong enough to support a conclusion, at least until contrary facts suggest the need for revision or rejection (Dewey 1910 ). Otherwise, the suggested interpretation is rejected, and a new cycle of reflection begins again with confusion. The process of grounding the interpretation and conclusion in empirical evidence addresses potential fallacious intrinsic and extrinsic beliefs.
This paper introduces the RPF, which has been developed based on ideas adapted from theoretical and empirical studies, including works by Dewey ( 1910 , 1937 ), Schon ( 1983 , 1987 ), Kolb ( 1984 ), Archer ( 2007 ), Van Manen ( 1977 ), Valli ( 1992 ), Korthagen ( 2017 ), Soedirgo and Glas ( 2020 ), and others. The RPF incorporates the idea of translating the theory of reflection into practice (Schon, 1983 , 1987 ), while addressing a limitation of past research regarding the lack of guidance for reflection.
The first level of reflection involves the development of a positionality statement. This process authentically engages a researcher in each aspect of reflection and allows the recognition and acknowledgment of the origins and impact of the researcher’s own belief systems, values, and prior knowledge and experience on the research process. Another aim of the positionality statement is the gradual construction of a researcher’s position, making his or her voice explicit. Developing a positionality statement allows phenomenographers to conduct a more authentic reflection, as opposed to the “bracketed” reflection criticised by such phenomenological scholars as Husserl ( 1965 ) and Van Manen ( 1990 ).
The second level of reflection involves five steps: confusion, proposition of a solution or interpretation, reasoning, documentation of the reasoning process, and acceptance or rejection of the proposed solution or interpretation. The RPF guides a phenomenographic researcher to generate multiple alternative interpretations of the data (Korthagen 2017 ; Valli 1992 ), forcing the researcher into a state of mental uneasiness, a necessary condition for critical and reflective thinking (Dewey 1910 , 1939 ). An active search for alternative interpretations is particularly relevant for phenomenographic data analysis due to the highly interpretive nature of phenomenographic methodology.
Similar to Schon ( 1983 , 1987 ), the RPF promotes reflection during the analysis process rather than after it. The RPF incorporates elements from Kolb’s ( 1984 ) Experiential Learning Cycle model and the work of Archer ( 2007 ). Both scholars endorse acknowledging, examining, and negotiating personal experiences and their contexts, as well as actively questioning initial interpretations often influenced by an individual’s values, beliefs, and context-specific understandings of reality. One of the difficulties of reflective practices is the perceived importance of being objective in research. However, the philosophical debate regarding an individual’s capacity to present an objective perspective becomes muted in the face of the position that all objectivity is first understood as subjective experience (Nisbett, 2005 ). Critical scrutiny of the origins, validity, and limitations of personal subjective interpretation allows a researcher to become more open to other research perspectives.
The proposed RPF provides practical guidance to enhance the quality of thinking and judgement and offers a more realistic approach to reflection that values individuals’ holistic nature and embraces the limitations of a researcher’s subjectivity (Sellas, 2017). By acknowledging that any interpretation is likely based on experience and prior knowledge, the RPF facilitates the suspension of immediate, uncritical interpretation of data (Dewey 1910 ). By engaging in ongoing inner dialogue during the documentation process (journal writing, note-taking, and articulating the data analysis procedures to a wider audience), a researcher can better understand how they arrived at a particular conclusion. Furthermore, documenting makes the reflection process available to readers, allowing for independent evaluation of the research results and increasing the trustworthiness and credibility of the research (Anfara et al. 2002 ). Glesne and Peshkin ( 1992 ) emphasised that reflection, monitoring, and justification of a researcher’s influence are essential elements of becoming a better qualitative researcher. The RPF aims to assist novice phenomenographers in developing self-reflective awareness (Finlay 2008 ) and help avoid the typical social science trap of tending to notice evidence that “corroborates a favourite belief more readily than that which contradicts it” (Dewey 1910 ; p. 7).
Implications for Theory and Practice
This paper contributes to the body of research on reflective methodology (Alvesson and Skolberg 2009 ), complementing research on descriptive phenomenology (Husserl 1965 ; Sanders 1982 ) and hermeneutic or interpretive phenomenological methodology (Heidegger, 1988 ; Van Manen 1990 ). Åkerlind ( 2005 ) argued that phenomenographic methodology is often applied without a clear understanding of its unique methodological requirements. This paper addresses this methodological limitation. By supplementing analytical procedures with the holistic framework for in-depth reflection, this paper contributes to the methodology development. The RPF advances phenomenographic methodology with a tool that provides an opportunity to demystify the data analysis process. In doing so, this paper emphasises the importance and the role of reflection in a highly interpretive phenomenographic approach, which can ensure the rigour of the research.
On a practical level, the RPF offers a systemic approach which combines consideration of personal and situational factors with step-by-step guidance on how to reflect on the phenomenographic data analysis. The application of the RPF initiates and guides critical thinking in the process of data analysis and allows to account for the complexities of the researcher’s engagement with the data.
This article describes the RPF developed to assist phenomenographic data analysis. It begins with outlining the theory and origins of reflection and reflective thinking, reviews empirical studies on the practical application of reflection, elaborates on the development of the framework, and describes its elements.
The RPF is unique in several ways. First, it offers a tool for reflection specifically designed to enhance phenomenographic data analysis. Second, it takes a systemic approach to reflection, accounting for multiple influential factors. Finally, it contributes to methodology development, showing the value of reflection in addressing the issue of the “black box” of phenomenographic data analysis by acknowledging the subjective influence of the researcher during this process. Specifically, the application of the RPF demystifies the process of working with unstructured phenomenographic data. Guided reflection on two levels helps to make the phenomenographic data analysis more transparent, elucidating conflicting interpretations and insights, and helps the evolution of a researcher’s understanding of data. The RPF invites phenomenographers into ongoing ethical engagement and considerations of choices made throughout the research, offering what Guillemin and Gillam refer to as practical application of ethics.
Several limitations of the framework should be mentioned. First, phenomenography employs the second order perspective to examine reality, e.g. through the meaning that is assigned to reality by study participants. Although the RPF can assist in revealing assumptions and biases held by a researcher, there is still a risk of “reflexive inclusion” or “writing the self” into the piece of research (Day 2012 ; p. 69). To identify and control such practice, self-analysis, rather than the mere disclosure of a researcher’s positionality, is an essential element of the reflexive technique (Day 2012 ). This is an important concern that should be kept in mind during the development of a positionality statement. Secondly, during reflection, the process of interpretation of unstructured phenomenographic data is somewhat speculative. Thus, the quality of interpretation depends on the researcher’s willingness to sustain the uneasiness of the confusion (Step 1 of the RPF) and on a desire to generate alternative interpretations of the data (Step 2 of the RPF). There is also a risk of being stuck in a critical thinking loop, where the search for alternative solutions can develop into an obsession with finding a better interpretation. Another limitation of the framework is related to the scarcity of time required for the documentation of reflective thinking (Step 4 of the RPF), compared to the fast going process of internal dialogue associated with thinking. Although detailed documentation minimises the risks of misinterpretation and elaborates on implicit assumptions and insights, often such practice is sacrificed to meet the timeframes of the research project.
The application of the RPF raises the question of how a researcher participates in knowledge production throughout the research process and allows them to approach this process in a more considered way. By offering a tool to mitigate the risks of an individual’s subjectivity in phenomenographic research, this article provides an instrument for reflection specifically designed for novice phenomenographers, contributing to methodology development.
Appendix 1. Model of Phenomenographic Data Analysis

Source: adopted from Dahlgren and Fallsberg ( 1991 )
Data Availability
Not applicable.
Åkerlind GS (2005) Variation and commonality in phenomenographic research methods. High Educ Res Develop 24(4):321–334
Alvesson M, Sköldberg K (2000) Reflexive methodology: new vistas for qualitative research. Sage Publications, London
Alvesson M, Skolberg K (2009) Reflexive methodology, 2nd edn. Sage, London
Google Scholar
Anfara VA Jr, Brown KM, Mangione TL (2002) Qualitative analysis on stage: making the research process more public. Educational Researcher 31(7):28–38
Article Google Scholar
Archer M (2007) Making our way through the World: human reflexivity and social mobility. Cambridge University Press, Cambridge
Book Google Scholar
Ashwin P (2006) Variation in academics’ Accounts of tutorials. Stud Higher Educ 31(6):651–665
Ashwin P, Abbas A, McLean M (2014) How do students’ accounts of sociology change over the course of their undergraduate degrees? High Educ 67:219–234
Bowden JA, Walsh E (eds) (2000) Phenomenography. RMIT University Press
Brown SR (2019) Subjectivity in the human sciences. Psychol Rec 69(4):565–579
Calderhead J (1989) Reflective teaching and teacher education. Teach Teacher Educ 5(1):43–51
Call-Cummings M, Ross K (2019) Re-positioning power and re-imagining reflexivity: examining positionality and building validity through reconstructive horizon analysis. In: Strunk KM, Locke LA (eds) Research Methods for Social Justice and Equity in Education. Palgrave Macmillan, Chann, Switzerland, pp 3–13
Chapter Google Scholar
Cokely CG, DePlacido CG (2012) Fostering reflective skills in audiology practice and education. Semin Hear 33:65–77
Crathern L (2001) Reflective growth and professional development: an ABC approach for the novice reflector. J Child Health Care: Professionals Working Child Hosp Community 5(4):163–167
D’Arcangelis CL (2018) Revelations of a white settler woman scholar-activist: the fraught promise of self-reflexivity. Cult Studies- Crit Methodologies 18(5):339–353
Dahlgren LO, Fallsberg M (1991) Phenomenography as a qualitative approach in social pharmacy research. J Social Administrative Pharmacy: JSAP 8(4):150–156
Day S (2012) A reflexive lens: exploring dilemmas of qualitative methodology through the concept of reflexivity. Qualitative Sociol Rev 8(1):60–85
Dewey J (1910) How we think. D.C. Heath, Boston
Dewey J (1933) How we think: a restatement of the relation of reflective thinking to the educative process. D.C. Heath, Boston
Dewey J (1937) Education and social change. Bullet Am Assoc Univ Professors (1915-1955) 23(6):472–474
Dewey J (1939) Theory of valuation. University of Chicago Press, Chicago, IL
Donohoe A (2019) The blended reflective inquiry educators framework; origins, development and utilisation. Nurse Educ Pract 38:96–104
Finlay L (2008) Reflecting on ‘reflective practice’. Practice-based Professional Learning Centre The Open University
Foley DE (2002) Critical ethnography: the reflexive turn. Int J Qualitative Stud Educ 15(4):469–490
Fook J (2015) Reflective practice and critical TablesFigures_RPFreflection. Handbook for practice learning in social work and social care. Knowl Theory 3:440–454
Glesne C, Peshkin A (1992) Becoming qualitative researchers: an introduction. Longman, White Plains, NY
Gore JM, Zeichner KM (1991) Action research and reflective teaching in preservice teacher education: a case study from the United States. Teach Teacher Educ 7(2):119–136
Gustafsson C, Asp M, Fagerberg I (2009) Reflection in night nursing: a phenomenographic study of municipal night duty registered nurses’ conceptions of reflection. J Clin Nurs 18(10):1460–1469
Habermas J (1974) Theory and practice , trans. J. Viertel. London: Heinemann
Harding S (1989) Is there a feminist method? In: Tuana N (ed) Feminism and science. Indiana University Press, Bloomington, pp 18–32
Hatton N, Smith D (1995) Reflection in teacher education: towards definition and implementation. Teach Teacher Educ 11(1):33–49
Heidegger M (1988) The basic problems of phenomenology, vol. 478. Indiana University Press
Horsley T, Dingwall O, Sampson M (2011) Checking reference lists to find additional studies for systematic reviews. Cochrane Database Syst Reviews 8:1–23
Husserl E (1965) Phenomenology and the Crisis of Philosophy , Translated from German by Quentin Lauer, (originally published in 1911), Harper & Row, New York
Ison R (2018) Governing the human–environment relationship: systemic practice. Curr Opin Environ Sustain 33:114–123
Kolb D (1984) Experiential learning: experience as the source of learning and development. Prentice-Hall, New Jersey
Korhonen H, Heikkinen HL, Kiviniemi U, Tynjälä P (2017) Student teachers’ experiences of participating in mixed peer mentoring groups of in-service and pre-service teachers in Finland. Teach Teacher Educ 61:153–163
Körkkö M (2019) Towards meaningful reflection and a holistic approach: creating a reflection framework in teacher education. Scandinavian J Educational Res 0(0):1–18
Körkkö M, Rios M, S., Kyrö-Ämmälä O (2019) Using a video app as a tool for reflective practice. Educational Res 61(1):22–37
Korthagen FAJ (2004) In search of the essence of a good teacher: towards a more holistic approach in teacher education. Teach Teach Educ 20(1):77–97
Korthagen FA, Nuijten EE (2017) Core reflection approach in teacher education. In Oxford Research Encyclopedia of Education
MacLean S, Geddes F, Kelly M, Della P (2019) Video reflection in discharge communication skills training with simulated patients: a qualitative study of nursing students’ perceptions. Clin Simul Nurs 28:15–24
Marton F (1981) Phenomenography—describing conceptions of the world around us. Instr Sci 10(2):177–200
Marton F (1986) Phenomenography: a research approach to investigating different understandings of reality. J Thought 21(3): 28–49
Nisbett RE (2005) The geography of thought. Nicholas Brealey, Boston, MA, USA
Pillow W (2003) Confession, catharsis, or cure? rethinking the uses of reflexivity as methodological power in qualitative research. Qualitative Stud Educ 16(2):175–196
Rotar O (2021) Phenomenographic research on adult students’ experiences of learning and conceptualisations of success in their online postgraduate programmes (Doctoral dissertation, Lancaster University)
Rotar O (2022) From passing the exam to self-actualisation: different ways of conceptualising success among adult students in online higher education. Educational Stud Mosc 4:233–259
Rotar O (2023) What we have learned from adult students’ online learning experiences to enhance online learning of other students’ groups? Res Pract Technol Enhanced Learn 19(6):1–37
Sanders P (1982) Phenomenology: a new way of viewing organisational research. Acad Manage Rev 7(3):353–360
Schön DA (1983) The reflective practitioner: how professionals think in action. Basic Books, New York. (Reprinted in 1995)
Schön DA (1987) Educating the reflective practitioner. Jossey-Bass, San Francisco
Schön D (1991) The reflective practitioner. Jossey-Vass. San Francisco, USA
Sellars M (2017) Reflective practice for teachers, 2nd ed. Sage, London
Simpson E, Courtney M (2007) A framework guiding critical thinking through reflective journal documentation: a Middle Eastern experience. Int J Nurs Pract 13(4):203–208
Smith JA, Osborn M (2003) Interpretive phenomenological analysis. In: Smith JA (ed) Qualitative psychology: a practical guide to research methods. Sage, London, pp 51–80
Smith JA, Osborn M (2008) Interpretative phenomenological analysis. In: Smith JA (ed) Qualitative psychology: a practical guide to research methods. Sage, London, pp 53–81
Smith JA, Flowers P, Larkin M (2009) Interpretative phenomenological analysis: theory, method and research. Sage, London
Soedirgo J, Glas A (2020) Toward active reflexivity: positionality and practice in the production of knowledge. PS: Political Sci Politics 53(3):527–531
Steedman P (1991) On the relations between seeing, interpreting and knowing. In: Steier F (ed) Research and refexivity. Sage, London, pp 53–62
Valli L (ed) (1992) Reflective teacher education: cases and critiques. SUNY, Albany, NY
Valli L (1997) Listening to other voices: a description of teacher reflection in the United States. Peabody J Educ 72(1):67–88
Van Manen M (1977) Linking ways of knowing with ways of being practical. Curriculum Inq 6(3):205–222
Van Manen M (1990) Researching lived experience: human science for an action sensitive pedagogy. SUNY, Albany, NY
Download references
Author information
Authors and affiliations.
Institute of Education, University of Strathclyde, Glasgow, UK
You can also search for this author in PubMed Google Scholar
Contributions
Olga Rotar is a single author of the manuscript.
Corresponding author
Correspondence to Olga Rotar .
Ethics declarations
Ethical approval, competing interests.
The authors declare no competing interests.
Additional information
Publisher’s note.
Springer Nature remains neutral with regard to jurisdictional claims in published maps and institutional affiliations.
Rights and permissions
Open Access This article is licensed under a Creative Commons Attribution 4.0 International License, which permits use, sharing, adaptation, distribution and reproduction in any medium or format, as long as you give appropriate credit to the original author(s) and the source, provide a link to the Creative Commons licence, and indicate if changes were made. The images or other third party material in this article are included in the article’s Creative Commons licence, unless indicated otherwise in a credit line to the material. If material is not included in the article’s Creative Commons licence and your intended use is not permitted by statutory regulation or exceeds the permitted use, you will need to obtain permission directly from the copyright holder. To view a copy of this licence, visit http://creativecommons.org/licenses/by/4.0/ .
Reprints and permissions
About this article
Rotar, O. The Reflective Practice Framework for Phenomenographic Data Analysis. Syst Pract Action Res (2024). https://doi.org/10.1007/s11213-024-09677-z
Download citation
Accepted : 22 May 2024
Published : 31 May 2024
DOI : https://doi.org/10.1007/s11213-024-09677-z
Share this article
Anyone you share the following link with will be able to read this content:
Sorry, a shareable link is not currently available for this article.
Provided by the Springer Nature SharedIt content-sharing initiative
- Reflexivity
- Reflective practice
- Positionality
- Phenomenographic research
- Find a journal
- Publish with us
- Track your research
IMAGES
VIDEO
COMMENTS
The first step in any data analysis process is to define your objective. In data analytics jargon, this is sometimes called the 'problem statement'. ... Many organizations collect big data to create industry reports or to conduct market research. The research and advisory firm Gartner is a good real-world example of an organization that ...
A method of data analysis that is the umbrella term for engineering metrics and insights for additional value, direction, and context. By using exploratory statistical evaluation, data mining aims to identify dependencies, relations, patterns, and trends to generate advanced knowledge.
Definition of research in data analysis: According to LeCompte and Schensul, research data analysis is a process used by researchers to reduce data to a story and interpret it to derive insights. The data analysis process helps reduce a large chunk of data into smaller fragments, which makes sense. Three essential things occur during the data ...
The first step in data analysis is to clearly define the problem or question that needs to be answered. This involves identifying the purpose of the analysis, the data required, and the intended outcome. ... Market research: Data analysis can help you understand customer behavior and preferences, identify market trends, and develop effective ...
Data analysis is the central step in qualitative research. Whatever the data are, it is their analysis that, in a decisive way, forms the outcomes of the research. Sometimes, data collection is limited to recording and docu-menting naturally occurring phenomena, for example by recording interactions. Then qualitative research is concentrated on ...
The term "data analysis" can be a bit misleading, as it can seemingly imply that data analysis is a single step that's only conducted once. In actuality, data analysis is an iterative process. And while this is obvious to any experienced data analyst, it's important for aspiring data analysts, and those who are interested in a career in ...
Written by Coursera Staff • Updated on Apr 19, 2024. Data analysis is the practice of working with data to glean useful information, which can then be used to make informed decisions. "It is a capital mistake to theorize before one has data. Insensibly one begins to twist facts to suit theories, instead of theories to suit facts," Sherlock ...
Step 1: Write your hypotheses and plan your research design. To collect valid data for statistical analysis, you first need to specify your hypotheses and plan out your research design. Writing statistical hypotheses. The goal of research is often to investigate a relationship between variables within a population. You start with a prediction ...
Data analysis step 4: Analyze data. One of the last steps in the data analysis process is analyzing and manipulating the data, which can be done in various ways. One way is through data mining, which is defined as "knowledge discovery within databases". Data mining techniques like clustering analysis, anomaly detection, association rule ...
On the basis of Rocco (2010), Storberg-Walker's (2012) amended list on qualitative data analysis in research papers included the following: (a) the article should provide enough details so that reviewers could follow the same analytical steps; (b) the analysis process selected should be logically connected to the purpose of the study; and (c ...
Now that you're familiar with the fundamentals, let's move on to the exact step-by-step guide you can follow to analyze your data properly. Step 1: Define your goals and the question you need to answer. Step 2: Determine how to measure set goals. Step 3: Collect your data. Step 4: Clean the data.
Below are the steps to prepare a data before quantitative research analysis: Step 1: Data Collection. Before beginning the analysis process, you need data. Data can be collected through rigorous quantitative research, which includes methods such as interviews, focus groups, surveys, and questionnaires. Step 2: Data Cleaning.
How to analyze qualitative data from an interview. To analyze qualitative data from an interview, follow the same 6 steps for quantitative data analysis: Perform the interviews. Transcribe the interviews onto paper. Decide whether to either code analytical data (open, axial, selective), analyze word frequencies, or both.
Step 1: Gather your qualitative data and conduct research (Conduct qualitative research) The first step of qualitative research is to do data collection. Put simply, data collection is gathering all of your data for analysis. A common situation is when qualitative data is spread across various sources.
Step 5: Query your coded data and write up the analysis. Once you have coded your data, it is time to take the analysis a step further. When using software for qualitative data analysis, it is easy to compare and contrast subsets in your data, such as groups of participants or sets of themes.
Step 1: Organizing the Data. "Valid analysis is immensely aided by data displays that are focused enough to permit viewing of a full data set in one location and are systematically arranged to answer the research question at hand." (Huberman and Miles, 1994, p. 432)
It is important to know w hat kind of data you are planning to collect or analyse as this w ill. affect your analysis method. A 12 step approach to quantitative data analysis. Step 1: Start with ...
Step 1: Consider your aims and approach. Step 2: Choose a type of research design. Step 3: Identify your population and sampling method. Step 4: Choose your data collection methods. Step 5: Plan your data collection procedures. Step 6: Decide on your data analysis strategies. Other interesting articles.
To analyze data collected in a statistically valid manner (e.g. from experiments, surveys, and observations). Meta-analysis. Quantitative. To statistically analyze the results of a large collection of studies. Can only be applied to studies that collected data in a statistically valid manner. Thematic analysis.
Data analysis is a crucial step in the research process because it enables companies and researchers to glean insightful information from data. By using diverse analytical methodologies and approaches, scholars may reveal latent patterns, arrive at well-informed conclusions, and tackle intricate research inquiries.
Step 1: Write your hypotheses and plan your research design. To collect valid data for statistical analysis, you first need to specify your hypotheses and plan out your research design. Writing statistical hypotheses. The goal of research is often to investigate a relationship between variables within a population. You start with a prediction ...
For predictive analysis: Python and R are perfect examples of scientific languages due to their strong focus on advanced statistical and machine learning opportunities. For prescriptive analysis: The best software solutions to process massive data and model complicated data are SAS and Apache Hadoop. 2.
Step 1: Define your qualitative research questions. The qualitative analysis research process starts with defining your research questions. It's important to be as specific as possible, as this will guide the way you choose to collect qualitative research data and the rest of your analysis. Examples are:
Initial data analysis (IDA) is the part of the data pipeline that takes place between the end of data retrieval and the beginning of data analysis that addresses the research question. Systematic IDA and clear reporting of the IDA findings is an important step towards reproducible research. A general framework of IDA for observational studies includes data cleaning, data screening, and ...
Data in Research. Clinical Trials Data Management and Analysis. Medical research is a process of gathering data that will expand scientists' understanding of human health. Researchers take steps to ensure the accuracy of all their data, then use sophisticated methods to analyze their findings to ensure the accuracy of their conclusions.
The RPF offers dual guidelines that include step-by-step reflection on the data analysis and a reflection on personal and situational factors, making this process holistic. ... Anfara VA Jr, Brown KM, Mangione TL (2002) Qualitative analysis on stage: making the research process more public. Educational Researcher 31(7):28-38. Article Google ...
How to Do Thematic Analysis | Step-by-Step Guide & Examples. Published on September 6, 2019 by Jack Caulfield.Revised on June 22, 2023. Thematic analysis is a method of analyzing qualitative data.It is usually applied to a set of texts, such as an interview or transcripts.The researcher closely examines the data to identify common themes - topics, ideas and patterns of meaning that come up ...
The best way to accomplish any business or personal goal is to write out every possible step it takes to achieve the goal. Then, order those steps by what needs to happen first. Some steps may ...
Qualitative data analysis. A directed content analysis approach (Hsieh & Shannon, Citation 2005) was used to analyze the qualitative data. An initial codebook was developed deductively using codes based on the MCTR program components; for example, one initial code was 'perceptions of Annie' because the text messaging subscription was an ...
This research aims to develop an integrated approach to construction project management by integrating digital technology into monitoring and surveillance operations. Through the use of drones and image processing software, data can be updated regularly and accurately about the progress at the construction site, allowing managers and decision makers to have a clear view of the current ...